


INTRODUCTION
The emergence of the highly pathogenic H5N1 virus among poultry and ducks has led to fears of an imminent influenza pandemic. Given the problems associated with the available control measures, for example, the limited supplies of antivirals and the delay between the emergence of a strain which is transmissible to humans and a suitable vaccine, there is much interest in applying social measures, such as school closures, to reduce the size of the pandemic [1]. The World Health Organization currently recommends that countries should consider closing schools during an influenza pandemic [2], although the potential impact of such closures is poorly understood.
The impact will probably depend on several factors. First, it depends on contact patterns in the population: in settings where children contact each other frequently, for example, the impact is likely to be bigger than that in populations in which children rarely contact each other. Second, it depends on how school closures affect contact patterns. One study of measles data suggested that the amount of contact (or the ‘transmission parameter’) between individuals was 27% lower during school holidays than during the school terms [Reference Fine and Clarkson3]; the impact on contact between individuals in specific age groups (e.g. schoolchildren and adults) is unknown. Third, it depends on the stage of the pandemic and the time period during which schools are closed: school closures introduced for a short time once the epidemic has peaked will probably have a smaller effect than those introduced early in the epidemic and for a long time period.
A recent study provides some insight into the impact of school closures on an influenza pandemic [Reference Heymann4], finding that schoolchildren were diagnosed with respiratory infections 42% and 20% less frequently during the 3 weeks when schools were closed because of strike action, than before and after the strike, respectively; the impact on diagnoses in the overall population was not estimated. Other studies, which were based on detailed microsimulation models, estimated that school closures might reduce the size of an influenza pandemic by 12–14% if the basic reproduction number (R 0) was 2–2·4 [Reference Ferguson5, Reference Germann6], with the reduction decreasing as R 0 increased. The sensitivity of these findings to assumptions about contact patterns and how they are affected by school closures is unknown.
We here apply an age-structured model of the transmission dynamics of pandemic influenza to data from the United Kingdom from the 1957 (Asian) influenza pandemic, and discuss how school closures implemented at different stages of a pandemic, for different assumptions about contact between individuals, would affect its size and duration in the future.
METHODS
Overview
The model was designed to re-create the pandemic wave caused by the Asian influenza pandemic in 1957 in the United Kingdom. We first describe the general structure of the model, how it was applied to estimate unknown parameters (e.g. the rate at which individuals in different age groups contact each other, the proportion of infected individuals who experienced clinical influenza) and then to infer the effect of school closures.
General structure of the model
The model population was stratified into those who were susceptible to infection, those infected but not yet infectious, those who were infectious, and those who were immune as a result of infection. For simplicity, it was assumed that all infected individuals were infectious for an average period of 2 days (irrespective of whether they experienced clinical symptoms) after an average latent period of 2 days. These assumptions imply an average serial interval (time interval between successive cases in a chain of transmission [Reference Fine7, Reference Hope-Simpson8]) of 4 days, which is consistent with data on the time period between the first case and the first subsequent cases in households, and on viral shedding [Reference Glezen, Couch and Evans9–Reference Jordan11]. Given a recent study which found that the serial interval could be 3 days or shorter [Reference Ferguson12], we also explore the effect of assuming that the latent and infectious periods are each 1·5 days. Given serological data pre-dating 1957 [Reference Mulder and Masurel13], we assume that 0% and 20% of those aged under and over 70 years respectively were immune to Asian influenza at the start of the pandemic.
Since both the proportion of infected individuals who were symptomatic during the Asian influenza pandemic, and the proportion of the cases which were reported were unknown, these were estimated by fitting model predictions of the weekly number of cases to the observed data. Further details of the model are provided in Appendix A (available with the online version of the paper).
Age-dependency in contact
Contact between individuals was assumed to be age-dependent, differing between the age groups <1, 1–4, 5–14, 15–24, 25–44, 45–64 and ⩾65 years. The general structures of the matrices of Who Acquired Infection From Whom (WAIFW) are summarized in Table 1. According to all the matrices, individuals aged <1 year are as likely to contact individuals of the same age as they are to contact individuals of any other age. All four matrices assume that individuals aged 1–4, 5–14 and 15–24 years mixed differently among individuals of their own age from the way that they mixed with individuals in other age bands, and allowed for different degrees of interaction between younger and older individuals. For example, according to matrix W4, the probability of an effective contact between individuals aged >65 years and those aged 1–14 years was assumed to be 20% of that between individuals aged at least 65 years.
Table 1. Summary of the general assumptions about contact patterns in the model

The size of these contact parameters was estimated by fitting, using maximum likelihood, predictions from this model to the observed data (see below) together with the other unknown parameters.
The R 0 associated with each matrix was calculated using standard techniques (i.e. as the dominant eigenvalue of the Next Generation Matrix [Reference Diekmann, Heesterbeek and Metz14]).
Data sources
The following data sources were used in the analyses:
(1) The weekly age-specific number of influenza cases reported to a general practice in Wales during the 1957 influenza pandemic, spanning the period 25 August 1957 to 29 December 1957 [15]. The population in the practice comprised 8000 individuals. Neither the definition of a ‘case’ (e.g. whether it involved virological confirmation of specimens) nor the proportion of cases in the population who were reported to the practice were provided in the report. The latter proportion was therefore estimated at the same time as the other unknown parameters were estimated, by fitting model predictions to the observed data, assuming that it was either the same for all age groups or differed between children and adults (see below).
(2) The age-specific proportion of individuals who were found to have experienced clinical influenza during the Asian influenza pandemic, as recorded in a general practice in South East London [Reference Woodall, Rowson and McDonald16]. These data probably gave a reliable indication of the true attack rate in the population, since the numbers of individuals who experienced influenza were determined by detailed house-to-house surveys.
(3) The age-specific proportion of individuals who were found to be serologically positive to the Asian influenza subtype in Sheffield, UK between 1 and 30 November 1957 [Reference Clarke17], i.e. towards the end of the pandemic wave in Sheffield; the peak of the influenza epidemic in Sheffield occurred during the week ending 21 September 1957. Most of the sera came from blood donors or from specimens collected for Wassermann or other routine tests.
Fitting the model to the data
The unknown parameters in the model, namely the contact parameters used in the WAIFW matrices, the proportion of infected individuals who experienced clinical symptoms, the proportion of cases who consulted a General Practitioner (GP) and the proportion of the individuals in different age groups who were infectious at the start, were estimated by fitting (using maximum likelihood) model predictions of:
(a) the weekly numbers of cases in the age groups <1, 1–4, 5–14, 15–24, 25–44, 45–64 and ⩾65 years in the GP practice;
(b) the age-specific proportion of individuals who experienced clinical disease during the pandemic wave;
(c) the age-specific proportion of individuals who would be expected to have antibodies to influenza at the end of the pandemic
to the three datasets described above simultaneously. In our sensitivity analyses, we explored the effect of the following assumptions:
(1) the proportion of cases which were reported to the GP practice in Wales was (i) the same for all age groups, (ii) differed between those aged ⩽16 and >16 years, (iii) differed between those aged ⩽11 and >11 years;
(2) the infectious and latent periods were each 1·5 days.
Further details of the fitting process are provided in Appendix B (available online). The likelihood ratio test was used to compare the fit of the models based the assumption that the proportion of cases who were reported to the GP practice was the same for all age groups, against that obtained assuming that this proportion was age-dependent.
Modelling the effect of school closures
The contact patterns W1, W2, W3 and W4 which were used in our analyses of the impact of school/nursery closures on an influenza pandemic were taken to be those which led to the best overall fit to the data, and had a realistic structure.
We explored the effect of introducing closures of schools and nurseries at different threshold values in the overall influenza disease incidence (e.g. such as those which might be reported to a sentinel site, and for which reporting was likely to be reliable), namely 50, 100, 200 and 1000/100 000 per week, for different values for R 0. Schools and nurseries were assumed to reopen once the disease incidence dropped below the corresponding threshold incidence. The best-fitting WAIFW matrices were scaled accordingly to recreate scenarios for different values for R 0.
The effect of several different assumptions of the effect of pre-school and school closures on contact among individuals were explored, namely that the amount of contact between individuals in the same age groups in the age bands 1–4 and 5–14 years decreased by 25%, 50% and 75%. A 25% reduction in the amount of contact between individuals of pre-school and school-age is comparable to that estimated for contact leading to measles transmission during school holidays, compared with that estimated during term time [Reference Fine and Clarkson3]. Although the contact parameter in this study was not broken down by age, the majority of cases considered in this study would have been aged <10 years [18]. For each of these scenarios, contact between children and individuals in other age groups was assumed to remain unchanged. The duration of the epidemic was defined as the time period during which the disease incidence was above 10/100 000 per week. Further details about how the model was used to analyse the impact of school closures are provided in Appendix C (available online).
RESULTS
Estimates of the epidemiological parameters
The best-fitting estimates of the proportion of infected individuals who experienced clinical disease, the proportion of symptomatic cases who were reported to the GP practice in Wales and the R 0, for the different matrix structures are summarized in Table 2 and Table B2 (available online). The corresponding WAIFW matrices are summarized in Figure B1 (online).
Table 2. Summary of the best-fitting estimates of the basic reproduction number, the percentage of infected individuals who experience clinical symptoms and the proportion of clinical cases which were reported to the GP practice, which were associated with the best-fitting matrices of Who Acquires Infection From Whom
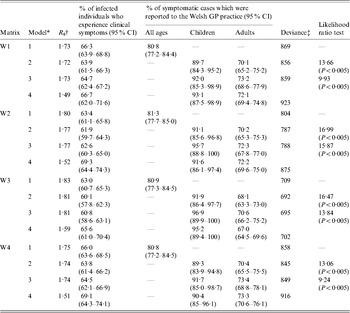
* Model 1: proportion of cases which are reported to the GP practice is assumed to be identical for all age groups; Model 2: proportion of cases which are reported to the GP practice is assumed to differ between those aged ⩽16 and >16 years; Model 3: proportion of cases which are reported to the GP practice is assumed to differ between those aged ⩽11 and >11 years; Model 4: the assumptions are identical to those in Model 2, except that the latent and infectious periods each equal 1·5 days.
† The basic reproduction number associated with each matrix was calculated using standard techniques (i.e. as the dominant eigenvalue of the Next Generation Matrix [Reference Diekmann, Heesterbeek and Metz14]).
‡ The number of degrees of freedom for model 1 is 130 (matrices W2 and W3) and 129 (matrices W1 and W4); for models 2–4, the number is 129 (matrices W2 and W3) and 128 (matrices W1 and W4).
In general, the contact between individuals based on matrices W2 and W3 was more assortative than that based on matrices W1 and W4, i.e. there was more contact between individuals in different age groups according to matrices W1 and W4 than according to matrices W2 and W3 (Fig. B1, online). In addition, the matrices obtained assuming that the latent and infectious periods were each 2 days were more assortative than those based on the assumptions that the latent and infectious periods were each 1·5 days. The structure of matrix W1 based on the latter assumption was also unrealistic, i.e. implying that there was very little contact between age groups 1–4 years and 5–14 years. For all the matrices 6–8% and 37–43% of all infections during the pandemic wave were estimated to have resulted from age groups 1–4 and 5–14 years, which made up about 5% and 13% of the population in 1957 [19] (Fig. B2, available online). In contrast, 20–24%, 16–25%, 8–18% and <4% of the infections were attributed to age groups 15–24, 25–44, 45–64 and ⩾65 years, respectively; these age groups made up about 13, 29, 24 and 16% of the population in 1957, respectively.
For the best-fitting models, 60–65% of infected individuals were estimated to have experienced clinical disease, with 89–97% and 68–73% of symptomatic children and adults being reported to the GP practice (Models 2 and 3 in Table 2). The difference in this percentage between children and adults was statistically significant. The best-fitting estimates based on the assumption that the proportion of symptomatic individuals who were reported to the GP practice differed between those aged ⩽16 and >16 years or between those aged ⩽11 and >11 years were similar.
As shown in Figures 1, 2, B3 and B4 (available online), the best-fitting model predictions compared well against the observed data, with the best fitting estimates being associated with matrix W3 (Table 2). In addition, the fit obtained assuming that the latent and infectious periods were 1·5 days was slightly worse than that obtained assuming that they were each 2 days. The basic reproduction numbers associated with the best-fitting estimates were 1·7–1·8 and 1·5–1·6, based on the assumptions that the latent and infectious periods were each 2 days and 1·5 days respectively.

Fig. 1. Comparison between the best-fitting model-predictions of the weekly numbers of cases per 100 000 in different age groups which were reported to the general practice in Wales [15] for matrices W1, W2, W3 and W4 and the observed data, assuming that the average durations of the latent and infectious periods were each 2 days.

Fig. 2. Comparison between (a) the best-fitting model predictions of the expected proportion of individuals who were positive to antibodies of the Asian strain of influenza by the end of the pandemic against data collected in Sheffield in November 1957 [17] and (b) the best-fitting model predictions of the proportion of individuals who experienced clinical disease during the Asian influenza pandemic wave, and the corresponding observed proportion of individuals who experienced disease during the pandemic in a practice in South East London [Reference Woodall, Rowson and McDonald16]. These predictions are based on the assumption that the latent and infectious periods were each 2 days.
Estimates of the impact of school closure
As shown in Figures 3 and 4, the predicted impact of school/nursery closures decreased as R 0increased. For example, the average epidemic size decreased by 6–22%, 2–8% and <3%, assuming a R 0 of 1·8, 2·5 and 3·5 respectively (Fig. 4). There was a three- to fourfold difference between the impact predicted using the most extreme assumptions about how school closures affected contact patterns. For example, the average epidemic size decreased by 22% and 6% if school/nursery closures reduced the amount of contact between pre-school and schoolchildren by 75% and 25% respectively, assuming a low R 0 (1·8) and that schools/nurseries were closed whilst the disease incidence rate exceeded 50/100 000 per week (Fig. 4). The size of the reduction was relatively insensitive to assumptions about the duration of the latent and infectious periods [see Fig. D1 (online)].

Fig. 3. Model predictions of the impact of school closures on the overall weekly influenza disease incidence rate, assuming that individuals contact each other according to WAIFW matrix W3 and W4 (left- and right-hand panels respectively), for different assumptions about the threshold weekly influenza disease incidence rate at which school/nursery closures are introduced, the effect of school/nursery closures on contact between individuals of pre-school and school age and the basic reproduction number. Predictions based on matrix W3 are similar to those based on matrix W2; those based on W1 are similar to those based on matrix W4. The epidemic curves predicted using assumptions that schools/nurseries are closed at a threshold incidence of 50 and 200 per 100 000 per week were identical. The latent and infectious periods are here assumed to be 2 days.

Fig. 4. Model predictions of the impact of school/nursery closures on the average reduction in the epidemic size, for different assumptions about the threshold weekly influenza disease rate at which school/nursery closures are introduced, the effect of school/nursery closures on contact between individuals of pre-school and school age, and the basic reproduction number. The lower and upper limits of the vertical bars reflect the minimum and maximum reductions predicted under each WAIFW matrix. The latent and infectious periods are here assumed to be 2 days.
Contact patterns between individuals further determined the size of the impact with the reduction in the predicted epidemic size ranging between 17% and 25% for the most and least assortative contact patterns respectively, assuming that school closures reduced the amount of contact between (pre)schoolchildren by 75%, a R 0 of 1·8 and that schools were closed if the disease incidence exceeded 50/100 000 per week. As shown in Figures 5 and 6, for this scenario, school closures had a relatively small impact on the influenza incidence among adults, i.e. a reduction in the proportion who experienced clinical disease of <25%. The corresponding reduction in the incidence among schoolchildren was 43–54%. These decreases in specific age groups were similar to those estimated assuming that the latent and infectious periods were each 1·5 days [see Fig. D2 (online)].

Fig. 5. Model predictions of the impact of school/nursery closures on the weekly influenza disease incidence rate in specific age groups, assuming that individuals contact each other according to WAIFW matrices W3 and W4 (left- and right-hand panels respectively). The basic reproduction number is here assumed to be 1·8 and school/nursery closures are assumed to reduce contact between nursery/school-aged children by 75%. Predictions based on matrix W3 are similar to those based on matrix W2; those based on W1 are similar to those based on matrix W4. The latent and infectious periods are here assumed to be 2 days.

Fig. 6. Model predictions of the impact of school closures, which are introduced once the disease incidence exceeds 50/100 000 per week, on the reduction in the proportion of individuals experiencing influenza, assuming that the basic reproduction number is 1·8 and that school closures reduce contact between individuals of nursery/school-age by 75%, for different assumptions about contact between individuals in the overall population (matrices W1, W2, W3 and W4). The latent and infectious periods are here assumed to be 2 days.
The epidemic size was sensitive to the disease incidence rate at which school/nursery closures were introduced only if it was assumed that they reduced the amount of contact between children by 75% and R 0 was 1·8, e.g. decreasing by 17–25% and 13–19% if schools and nurseries were closed when the weekly disease incidence rate was 50 and 1000/100 000 respectively.
Figure 7 summarizes the durations of the epidemic and time periods during which schools/nurseries would be closed for the above scenarios. In general, the results indicate that for low values for R 0 (1·8), the most effective strategies (i.e. those in which nursery/school closures reduced contact between children by 75% and schools were closed when the disease incidence was low) were associated with the longest periods of school closures and the longest durations in the epidemic. On average, schools/nurseries were predicted to be closed for 49–126 days and 28–49 days assuming a R 0 of 1·8 and 3·5 respectively, whereas the epidemic was predicted to last 115–274 days, and 53–58 days for these assumptions about the R 0. Similar values for the time periods during which schools would be closed and the duration of the epidemic were predicted under the assumption that the latent and infectious periods were each 1·5 days [Fig. D3 (online)].

Fig. 7. Model predictions of the time period during which schools would be closed (left-hand panel) and the duration of the epidemic (right-hand panel), defined as the time period during which the disease incidence rate was above 10/100 000 per week, for different assumptions about the threshold weekly influenza disease rate at which school closures are introduced, the effect of school closures on contact between individuals of pre-school and school age and the basic reproduction number. The lower and upper limit of each vertical bar reflects the minimum and maximum durations predicted under each WAIFW matrix. The latent and infectious periods are here assumed to be 2 days.
DISCUSSION
We have estimated the R 0 of the strain which caused the Asian influenza pandemic in the United Kingdom, taking account of the effect of age-dependent mixing, the proportion of individuals who are infected who go on to develop clinical symptoms, and the fraction of cases who consulted a GP. Our findings illustrate that school closures could have an impact on a future influenza pandemic if R 0 is small (~1·8), depending on contact patterns and how they are affected by school closures, and when school closures are introduced.
Our parameterization of the model is novel, in that we fitted predictions from an age-structured model to data from the United Kingdom on age-specific consultations, serology and clinical attack rates simultaneously. This allowed us to estimate the age-dependent contact patterns in the population, the proportion of infected individuals who experience clinical symptoms and the proportion of influenza cases who consulted a GP. To our knowledge, no other studies have used this approach to estimate age-specific contact parameters for influenza, and many modelling studies to date have assumed particular values (e.g. 50% [Reference Ferguson5] or 67% [Reference Germann6, Reference Longini20]) for the proportion of infected individuals who experience clinical symptoms.
Our model of the influenza pandemic in 1957 incorporated several simplifying assumptions. For example, we assumed that contact patterns did not change during the pandemic; in practice, contact between individuals probably changed over time, as people became aware of the pandemic, and we may have, therefore, slightly underestimated the R 0 for the early part of the pandemic using our model. In addition, all cases were assumed to be equally likely to consult a GP, irrespective of the time period, which may be unrealistic. Furthermore, the infectious period is here assumed to be identical for all age groups, although children sometimes shed influenza virus for longer periods than do adults [Reference Whitley21, Reference Frank22]. On the other hand, the fact that it was possible to fit age-specific model predictions of the weekly disease incidence, the proportion of individuals experiencing clinical symptoms or who had experienced infection to consultation, clinical and serological data simultaneously, suggests that the assumptions in the model were reasonable.
Despite these limitations, our estimates of R 0 for Asian influenza (i.e.~1·8) seem plausible and are consistent with other estimates (e.g. 1·5 [Reference Viboud23], 1·65 [Reference Gani24] and 1·68 [Reference Longini20]). They are also compatible with estimates of R 0 obtained for other influenza pandemics, i.e. ranging between 1·8 and <4 for the 1918 (Spanish) influenza pandemic [Reference Chowell25, Reference Mills, Robins and Lipsitch26].
Our analyses of the impact of school closures are based on contact patterns which were inferred from the 1957 influenza pandemic, and it is likely that contact patterns have changed considerably since then. It is therefore reassuring that our estimates of the impact are compatible with those from other modelling studies, which predicted a 12·5% and 14% reduction in the epidemic size assuming a R 0 of 2 [Reference Ferguson5] and 2·4 [Reference Germann6] respectively. These models had differing assumptions both about the introduction of school closures and their effect on contact patterns. For example, one of the studies [Reference Ferguson5] assumed that a given school would be closed for 3 weeks whenever a case was found there, and that consequently, contact between children and adults in the household and the community increased by 50% and 25% respectively. The other study [Reference Germann6] assumed that schools/nurseries would be closed during the entire pandemic, but that this only affected contact between children.
Our analyses extend those studies, illustrating the sensitivity of the impact to assumptions about the effect of school closures on contact patterns. For example, our analyses predicted a three- to fourfold difference between the reduction in the epidemic size using the two most extreme assumptions about how school/nursery closures affected contact between individuals, ranging between 6% and 22%, assuming that R 0 was low (1·8) and that schools/nurseries were closed whilst the disease incidence exceeded 50/100 000 per week. The size of this reduction also differed between the assumed contact patterns, for example ranging between 17% and 25% for this particular scenario, for the most optimistic assumptions about how school closures affected contact.
There are few data on how school closures affect contact between individuals. Our most pessimistic assumption was that school closures reduced the amount of contact between schoolchildren by 25%. This is based on findings from analyses of measles data in the United Kingdom, which suggested that the amount of contact between individuals decreased by ~27% because of school holidays [Reference Fine and Clarkson3] (e.g. the ‘transmission parameter’ estimated in this study decreased from about 2·2×10−5 per week during the school terms to about 1·6×10−5 per week during school holidays). Since the cases in this study were not stratified by age, the reduction in the amount of contact between individuals in specific age groups is unknown. Also, the study could not provide insight into contact between adults and children during school holidays since measles affected few adults in the study. On the other hand, recent (unpublished) analyses, which used methods similar to those presented here, suggest that the amount of contact between schoolchildren may decrease by approximately two thirds as a result of school holidays (N. Gay, personal communication). This study found no evidence of an impact of school holidays on contact between adults and children.
We have assumed that school/nursery closures only affected contact between individuals of nursery or school age with others in their own age range. The effect of this assumption on our predictions of the impact of school closures is unclear. For example, the amount of contact between adults and children might increase during school/nursery closures, if parents stay at home to look after their children. On the other hand, the effect that this might have on the risk to an adult is debatable, since parents are likely to be heavily exposed to their children even without school closures, particularly when they are unwell (i.e. infectious). In addition, if the infectiousness of individuals declines rapidly after onset, as assumed in other modelling studies [Reference Ferguson5, Reference Ferguson12] the effect of parents being exposed to children for an increased duration as a result of school closures is likely to be minimal. We could have also underestimated the impact, since we have not incorporated the assumption that school closures may lead to reductions in the amount of contact between those (working) adults who have children and other adults.
Our estimates of the impact of school closures are based on data from the 1957 influenza pandemic in which schoolchildren experienced higher clinical attack rates than any other age group (see e.g. Figs 1 and 2). According to the contact patterns estimated here, children led to 30–40% of all the infections during the pandemic, even though they constituted ~13% of the entire population. In contrast, children appeared to be less important in introducing infection into households during the 1968 influenza pandemic [Reference Davis27], for reasons which are not understood. If a future pandemic follows a similar pattern to that in 1968, the impact of school closures may be smaller than that predicted here.
The World Health Organization currently recommends that countries should consider closing schools during an influenza pandemic [2]. Our analyses indicate that during a future pandemic, closure of schools/nurseries would probably reduce the size of the epidemic only by a very small amount (<10%) if R 0 is high (e.g. 2·5 or 3·5) and modest reductions (e.g. 22%) might be possible if R 0 is low (1·8) and schools are closed early. The sensitivity of the predicted impact to both assumptions about contact patterns and how they are affected by school closures suggests that this impact will differ between different countries. There is therefore an urgent need for further data on contact patterns and how they are affected by school closures, before reliable predictions of the impact of school closures for a given setting can be made.
ACKNOWLEDGEMENTS
We thank Mr Nigel Gay and Dr Jonathan van Tam (Health Protection Agency Centre for Infections) for helpful comments on the manuscript.
NOTE
Supplementary information accompanies this paper on the Journal's website (http://journals.cambridge.org).
DECLARATION OF INTEREST
None.


