


1 Introduction
A rapid development of various articulatory measurement methodologies over the last few decades has revolutionised the fields of phonetics and phonology, considerably enriching our understanding of the variation observed in the production of sounds within and across languages. Yet, the majority of articulatory work done so far has focused on a handful of languages, most of which are native to Europe. Thus, among articulatory phonetic studies published in major journals between 2000 and 2019, more than one third focus on English, and more than two thirds focus on Indo-European languages native to Europe (with the bulk being major Germanic and Romance languages; Kochetov Reference Kochetov2020). Given this linguistic bias, it remains to be seen whether empirical findings and theoretical generalizations obtained based on major European languages can extend to a wider range of sound pattern types.
As part of our general effort to document articulatory structures of less studied languages, we have developed an extensive midsagittal MRI corpus of two female speakers’ static vocal tract postures in Kannada, a Dravidian language spoken in India. Apart from being phonetically under-documented, Kannada is phonologically interesting in having a robust set of coronal phonemic contrasts, with dentals and retroflexes in particular, occurring at four manners of articulation. Articulatory mechanisms involved in the production of retroflexes are topics of an ongoing debate (as reviewed in the following section). The goal of this work, therefore, is to present a preliminary, yet fairly detailed, articulatory investigation of the production of the dental-retroflex contrast produced by two speakers of Kannada. This is done by employing recent MRI techniques and articulatory computational modelling (Labrunie et al. Reference Labrunie, Badin and Voit2018). While the small participant sample is a clear limitation of the study, the use of an extensive dataset and new analytical methods are hoped to provide a direction for further, more systematic investigations of coronal contrasts in Kannada and other languages. Specifically, this work aims to add to the insights obtained in articulatory research on retroflexes in Dravidian (Narayanan et al. Reference Narayanan, Byrd and Kaun1999; McDonough & Johnson Reference McDonough and Johnson1997; Scobbie et al. Reference Scobbie, Punnoose, Khattab, Spreafico and Vietti2013; Kochetov et al. Reference Kochetov, Sreedevi, Kasim and Manjula2014; Irfana Reference Irfana2017) and other languages (Tabain Reference Tabain2012; Tabain & Beare Reference Tabain and Beare2018).
1.1 Coronal consonant contrasts
Coronal place contrasts, such as distinctions between dentals, alveolars, retroflexes, and alveolopalatals, have been a major focus of the distinctive feature theory in phonology for several decades (e.g. Chomsky & Halle Reference Chomsky and Halle1968; Lahiri & Blumstein Reference Lahiri and Blumstein1984; Sagey Reference Sagey1986; Paradis & Prunet Reference Paradis, Prunet, Paradis and Prunet1991; Hamilton Reference Hamilton1996; Arsenault Reference Arsenault2008; Hall Reference Hall, Oostendorp, Ewen, Hume and Rice2011). Among the coronal places, retroflexes have attracted considerable attention due to their less common occurrence in languages (largely limited to South Asia and Australia: Ladefoged & Maddieson Reference Ladefoged and Maddieson1996), and to the lack of consensus among researchers about their production mechanisms and feature specifications.
1.1.1 Constriction location
One of the key characteristics noted to distinguish dentals (or alveolars) and retroflexes is the location of the constriction along the palate – more anterior (denti-alveolar) for the former and more posterior (postalveolar, prepalatal, or palatal) for the latter (Švarný & Zvelebil Reference Švarný and Zvelebil1955; Balasubramanian Reference Balasubramanian1972; Keating Reference Keating, Paradis and Prunet1991; McDonough & Johnson Reference McDonough and Johnson1997; Narayanan et al. Reference Narayanan, Byrd and Kaun1999; Hamann Reference Hamann2003; Proctor et al. Reference Proctor, Bundgaard-Nielsen and Best2010; Tabain Reference Tabain2011). Unlike dentals, which are typically produced with the tongue blade (i.e. laminal), retroflexes are produced with the tongue tip or the tongue underside (i.e. apical or sublaminal). The use of the latter articulator is more typical of Dravidian languages such as Tamil and Telugu (Ladefoged & Bhaskararao Reference Ladefoged and Bhaskararao1983). The corresponding consonants can therefore be differentiated by laminality on the one hand and apicality or sublaminality on the other (Hamilton Reference Hamilton1996; Gnanadesikan Reference Gnanadesikan and Conzalez1994). These tongue tip orientation parameters can be combined with the place distinctions (dental vs. postalveolar/palatal) to capture complex coronal contrasts as in Australian Aboriginal languages, such as among laminal dentals, apical alveolars, apical retroflexes, and laminal alveolopalatals (Hamilton Reference Hamilton1996; Tabain Reference Tabain2011).
1.1.2 Tongue shape
Differences between dentals and retroflexes have also been found to be related to the shape of the tongue behind the constriction. Specifically, dentals are typically produced with a convex or flat tongue, while retroflexes show a characteristic concavity behind the constriction. The latter results from a simultaneous raising/retraction of the tip and lowering/backing of the middle portion of the tongue (also tongue body, see Section 2.6.1 and footnote 7) (Švarný & Zvelebil Reference Švarný and Zvelebil1955; Hamann Reference Hamann2003; Arsenault Reference Arsenault2008; Proctor et al. Reference Proctor, Bundgaard-Nielsen and Best2010). This particularly appears to be the case for sublaminal retroflexes reported for Dravidian languages such as Tamil and Telugu (Ladefoged & Bhaskararao Reference Ladefoged and Bhaskararao1983; Narayanan et al. Reference Narayanan, Byrd and Kaun1999). The retraction of the tongue tip and the concomitant lowering/backing of the tongue middle can be facilitated by lowering the jaw, as has been reported for retroflexes in Arrernte (Tabain Reference Tabain2012).
1.1.3 Tongue retraction
As retroflexes in some languages have been noted to back or centralise adjacent front vowels, it was proposed that these consonants are produced with a distinct ‘retraction’ – raising/backing of the posterior portion of the tongue towards the velum (velarization) or the upper pharynx (pharyngealization) (Bhat Reference Bhat1974; Gnanadesikan Reference Gnanadesikan and Conzalez1994; Hamann Reference Hamann2003; Arsenault Reference Arsenault2008). Some of these researchers consider the tongue retraction movement optional, language-particular (Bhat Reference Bhat1974), while others see it as one of the defining characteristics of retroflexes as a class (Hamann Reference Hamann2003). In particular, Hamann (Reference Hamann2003) makes a strong claim of ‘the absence of non-retracted (i.e. non-velarized or non-pharyngealized) retroflexes in languages of the world’ (p. 39), based on the assumption that retraction is a concomitant property of posterior apical articulations (‘apicality & posteriority → retraction …’). Relatively little cross-language articulatory work, however, exists that would clarify the status of such retraction (or its presence or absence). For example, we are aware of only two X–ray/MRI studies that compared posterior tongue body/root positions for retroflexes and the corresponding dentals/alveolars. In one of them, Švarný & Zvelebil (Reference Švarný and Zvelebil1955) presented X-ray tracings of coronal consonants of various manners produced by speakers of Hindi/Urdu, Tamil, and Telugu (one speaker per language). While retroflexes and dentals clearly differed in their constriction location and the anterior tongue body shapes, no differences were apparent in the positions of the posterior portion of the tongue or its root. Similarly, no tongue body/root retraction was observed for the Tamil /ɭ/ and /ɻ/ (compared to /l/, /r/, and /ɾ/), in a single-speaker MRI study by Narayanan et al. (Reference Narayanan, Byrd and Kaun1999). In fact, if anything, it was the alveolar /l/ that showed a more raised posterior tongue body and a narrower pharyngeal cavity. More recently, no evidence of retraction was observed in ultrasound studies of retroflexes in Kannada (see below) and Arrernte (an Australian Aboriginal language, Tabain & Beare Reference Tabain and Beare2018). In the latter study specifically, dentals, alveolars, and retroflexes of various manners produced by all six of the examined speakers did not differ in terms of the tongue retraction (while being different from the more fronted alveolopalatals). In contrast to these studies, some consistent retraction for retroflexes relative to alveolars was reported in a single speaker ultrasound study of Malayalam liquids (Scobbie et al. Reference Scobbie, Punnoose, Khattab, Spreafico and Vietti2013). Specifically, the speaker produced the lateral /ɭ/ and the rhotic /ɻ/ with the backing of the tongue root (pharyngealization), compared to the dental/alveolar counterparts /l/, /r/, and /ɾ/.Footnote 1 Overall, the few available studies suggest that retraction is likely to be an optional, language-particular property of retroflexes (or perhaps a speaker-specific strategy).
1.1.4 Sublingual cavity
In addition to constriction and tongue shape differences, retroflexes have been noted to be consistently produced with a sublingual cavity, the property that is usually absent in dentals and found only occasionally in alveolars (Švarný & Zvelebil Reference Švarný and Zvelebil1955; Balasubramanian Reference Balasubramanian1972; Ladefoged & Bhaskararao Reference Ladefoged and Bhaskararao1983; Sundberg & Lindblom Reference Sundberg and Lindblom1990; Keating Reference Keating, Paradis and Prunet1991; Narayanan et al. Reference Narayanan, Byrd and Kaun1999). One may see the formation of the sublingual cavity as a mere consequence of these consonants’ characteristic tongue tip curling (Hamann Reference Hamann2003). Yet, this cavity serves to produce the characteristic lowering of the third formant (F3) for retroflexes (as an increased front-cavity resonance, cf. Narayanan et al. Reference Narayanan, Byrd and Kaun1999), and thus may be deliberately planned in production.
1.1.5 Interim summary
In sum, retroflexes across languages have been noted to show several articulatory characteristics, some of which appear to be more or less established, and some are still controversial. The most extensive review of retroflex articulations by Hamann (Reference Hamann2003) posits four ‘defining criteria for retroflexion’: (i) apicality (including sublaminality), (ii) posteriority, (iii) sublingual cavity, and (iv) retraction. As Hamann (Reference Hamann2003) notes, these characteristics are inter-related, often implying each other. For example, posteriority and retraction, taken together, presuppose the presence of apicality and sublingual cavity, which means that articulations produced behind the alveolar ridge and with the tongue retraction are always produced with the tongue tip (or its underside) and a large sublingual cavity. Producing an apical sound with a sublingual cavity, on the other hand, would automatically result in the retraction of the posterior portion of the tongue. One of the goals of this study is to examine whether Kannada retroflexes produced by our speakers meet these criteria.
1.1.6 Manner effects
It should be noted that many previous generalizations about retroflexes and their contrasts with dentals or alveolars have been made on the basis of relatively few articulatory studies representing only a handful of languages with relevant contrasts. Further, many previous studies have focused on a subset of manners of articulation. For example, only stops were investigated by Ladefoged & Bhaskararao (Reference Ladefoged and Bhaskararao1983) and Proctor et al. (Reference Proctor, Bundgaard-Nielsen and Best2010), while only liquids (laterals and rhotics) were investigated by McDonough & Johnson (Reference McDonough and Johnson1997), Narayanan et al. (Reference Narayanan, Byrd and Kaun1999), and Scobbie et al. (Reference Scobbie, Punnoose, Khattab, Spreafico and Vietti2013). Studies that considered multiple manners of coronals have produced somewhat conflicting results, possibly due to language-particular differences or the use of different methods. The X-ray study by Švarný & Zvelebil (Reference Švarný and Zvelebil1955) found that their Tamil and Telugu speakers showed more posterior constrictions for dental and retroflex sonorants (laterals and/or nasals) than stops, with retroflex consonants also differing in the shape of the constriction (more apical for stops and more sublaminal for sonorants). No clear manner-specific constriction differences, on the other hand, were observed in a static palatography study of Malayalam stops and nasals by Dart & Nihalani (Reference Dart and Nihalani1999) and an EPG study of Arrernte stops, nasals, laterals, and rhotics by Tabain (Reference Tabain2011). Yet, a follow-up ultrasound with the same Arrernte speakers (Tabain & Beare Reference Tabain and Beare2017) did reveal some manner-specific differences: the liquids were produced with a more raised/retracted posterior portion of the tongue. For laterals, this difference was attributed by the authors to the lowering of the tongue sides in order to produce lateral airflow. A few articulatory studies that examined retroflex fricatives have noted that these consonants were different from retroflexes of other manners and overall more variable. Thus Ladefoged & Maddieson (Reference Ladefoged and Maddieson1996) commented on only a moderate raising of the tongue tip in the post-alveolar region and hardly any concavity behind the constriction for /ʂ/ in Tamil and Toda (cf. Hamann Reference Hamann2003). A recent electromagnetic articulatography (EMA) study of Polish retroflex sibilant fricatives and affricates by Lorenc et al. (Reference Lorenc, Żygis and Mik2023) found considerable inter-speaker variation in the tongue shapes. Yet, the overwhelming majority of tokens produced by their twenty speakers involved tongue tip constrictions in the post-alveolar region, and thus conformed to the retroflex status of these consonants.
In sum, there is a need to further investigate how lingual differences serve to distinguish both place and manner contrasts, particularly in complex coronal inventories. It is also important to examine contributions of non-lingual articulators, as some of these may facilitate the production of lingual constrictions. For example, previous studies found that the jaw tends to be actively raised for obstruents and lowered for laterals, compared to nasals (Keating et al. Reference Keating, Lindblom, Lubker and Kreiman1994 on English and Swedish; Mooshammer et al. Reference Mooshammer, Hoole and Geumann2006 on German; Tabain Reference Tabain2012 on Arrernte), as well as lowered for retroflexes, compared to dentals (Tabain Reference Tabain2012). Some lip protrusion or rounding has been noted to accompany retroflex fricatives in languages like Polish and Russian (Ladefoged & Maddieson Reference Ladefoged and Maddieson1996; Flemming Reference Flemming2002; Hamann, Reference Hamann2003; Lorenc et al. Reference Lorenc, Żygis and Mik2023). The larynx has been generally observed to raise to accommodate the retraction of the tongue root (Esling et al. Reference Esling, Moisik, Benner and Crevier-Buchman2019), which may be expected of retroflexes and voiceless obstruents. Given this, exploring contributions of different lingual and non-lingual articulators to place and manner contrasts is one of the goals of the current study.
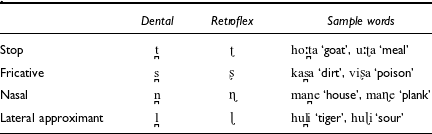
Table 1 The Kannada consonants examined in the study and word examples
1.2 Kannada dentals and retroflexes
Kannada, a Dravidian language spoken in the southern Indian state of Karnataka, presents an interesting case for examining the dental-retroflex contrast across manners, as the two places are distinguished in stops, nasals, fricatives, and laterals (Upadhyaya Reference Upadhyaya1972; Schiffman Reference Schiffman1983). Our focus here is thus to investigate articulatory properties of these contrasts shown in Table 1, as produced by two female speakers across five vowel contexts (/i e a o u/).
Previous descriptive accounts of Kannada consonants agree on the place distinction across all four manners, as between the anterior /t̪ n̪ s̪ l̪/ and posterior /ʈ ɳ ʂ ɭ/ (Nāyaka Reference Nāyaka1967; Upadhyaya Reference Upadhyaya1972; Schiffman Reference Schiffman1983). There is some variation among authors, however, on whether /n̪/, /l̪/, or /s̪/ are dental (as the prototypically dental /t̪/) or alveolar, as well as which of these anterior consonants have laminal or apical constrictions. For example, /n̪/ and /l̪/ are considered to be laminal dentals by Nāyaka (Reference Nāyaka1967), laminal alveolars by Upadhyaya (Reference Upadhyaya1972), and apical alveolars by Schiffman (Reference Schiffman1983). In contrast, the posterior stop, nasal, and lateral are unanimously considered to be produced with the underside of the tip behind the alveolar ridge, that is, sub-laminal post-alveolars or palatals. The details of the realization of the fricative /ʂ/ are less clear, however. Sridhar (Reference Sridhar1990) mentions that the sound is an apical, rather than a sub-laminal retroflex. Other authors note that the sound may lose its retroflex articulation for some speakers or in some dialects, merging with the phonemic alveolopalatal /ɕ/ (Schiffman Reference Schiffman1983; Sridhar Reference Sridhar1990).
Unlike other major Dravidian languages, Kannada has received relatively little attention in articulatory phonetic studies. To our best knowledge, there exist no X-ray, MRI, or static palatography data on the language, which is in contrast to the relatively well documented Tamil (e.g. Švarný & Zvelebil Reference Švarný and Zvelebil1955; Balasubramanian Reference Balasubramanian1972; Ladefoged & Bhaskararao Reference Ladefoged and Bhaskararao1983; McDonough & Johnson Reference McDonough and Johnson1997; Narayanan et al. Reference Narayanan, Byrd and Kaun1999). For Kannada, articulatory studies have been largely limited to the work by the first author and colleagues – EMA and/or ultrasound investigations of selected geminate coronals (/t̪ ʈ ʨ n̪ ɳ l̪ ɭ/) produced by ten Kannada speakers (Kochetov et al. Reference Kochetov, Sreedevi, Kasim and Manjula2014; Kochetov & Sreedevi Reference Kochetov and Sreedevi2016; Kochetov et al. Reference Kochetov, Tabain, Sreedevi and Beare2018). While confirming the fairly posterior articulation of retroflexes, this research revealed no apparent raising of the posterior portion of the tongue towards the velum, the property previously assumed of retroflexes (Bhat Reference Bhat1974; Hamann Reference Hamann2003; Arsenault Reference Arsenault2008; see the Section 1). In fact, the posterior portion of the tongue for the Kannada /ʈ/ was found by Kochetov et al. (Reference Kochetov, Sreedevi, Kasim and Manjula2014) in a lower/more front position compared to /t̪/. A similar lack of posterior tongue body raising was observed for the Kannada /ɳ/ and /ɭ/ (relative to /n̪/ and /l̪/; Kochetov et al. Reference Kochetov, Tabain, Sreedevi and Beare2018), suggesting that this gesture is not characteristic of Kannada retroflexes (unlike for the Malayalam /ɭ/: Scobbie et al. Reference Scobbie, Punnoose, Khattab, Spreafico and Vietti2013). Another finding was that tongue shapes for sonorant coronals (nasals and laterals) were somewhat different from those for their stop counterparts (and particularly among the dentals: /n̪/ and /l̪/ vs. /t̪/; cf. Švarný & Zvelebil Reference Švarný and Zvelebil1955 for Tamil and Telugu). This suggests some manner-specific differences in the constriction location and/or shape, some of which might be attributed to different aerodynamic requirements. We are not aware of any previous phonetic work on Kannada fricative dentals and retroflexes. However, based on the palatographic work on another Dravidian language, Toda (Ladefoged & Maddieson Reference Ladefoged and Maddieson1996), tongue shapes for the retroflex fricative appear to be distinct from the corresponding stops.
Observations made about Kannada consonants in previous EMA and ultrasound studies should be taken with caution, as these methods provide an inherently partial view of the tongue and limited information about other articulators or organs. The curling of the tongue tip for retroflexes, for example, can only be indirectly inferred from ultrasound images, and the information about the most posterior portion of the tongue is frequently missing as well. It is also important to consider the role of non-lingual articulators/organs, such as the jaw, the larynx, and possibly the hyoid bone in the production of place contrasts. Relative positions of some of these articulators/organs are particularly important when considering the possibility of the tongue body/root retraction for retroflexes. Specifically, this movement is expected to be facilitated by, and therefore manifested in differences in the vertical position of the larynx and the hyoid (Esling et al. Reference Esling, Moisik, Benner and Crevier-Buchman2019). It is therefore important to examine both lingual and non-lingual articulators involved in the production of Kannada coronal contrasts, something that can only be done using MRI.
In summary, based on descriptive accounts and articulatory studies of Kannada reviewed above, we expect the dental-retroflex contrast to be distinguished by a set of properties, among which are: the location and extent of the constriction between the tongue and teeth/alveolar ridge/palate (dental vs. post-alveolar or palatal), the part of the active articulator involved (apical, laminal, or sublaminal) and its shape or direction (the tongue middle down or not, convex or concave, tip-up or tip-down), the involvement of the posterior portion of the tongue (lowering of the anterior tongue body away from the hard palate and raising of the posterior tongue body towards the velum) and presence or absence of a sublingual cavity. Within the two places, subtler differences in the tongue shape/constriction are expected across different manners of articulation, and most particularly between stops and nasals or laterals, as well as between fricatives and the other manners. For example, the need to channel air through the sides for laterals and through the middle portion of the vocal tract for fricatives, as opposed to the entire sealing off of the airflow for stops, could reasonably modify tongue shapes and possibly affect jaw and larynx positions for all four manners of articulation at each of the two places.
2 Methodology
Note that Appendix A1 provides a table of abbreviations for articulatory parameters.
2.1 Speakers
The participants were two female native speakers of Kannada from the state of Karnataka, South India. The speaker KMU was twenty-five years old, born and raised in the city of Mysore. At the time of the recording, she was a recent graduate of the University of Grenoble, having spent a total of three years in France. Apart from Kannada, she reported speaking Sanskrit, Hindi, English, and French. The speaker KD was twenty-six years old, born and raised in the city of Kalasa. She was a student at the University of Grenoble, having spent two years in France. She reported speaking English and Hindi as second and third languages. Both participants mentioned using their first language on a daily basis. Neither of them had previously participated in a phonetic study.
2.2 Recording setup
Magnetic Resonance Imaging (MRI) is the only experimental method that allows us to observe all the speech articulators and the entire vocal tract, including the sublingual cavity, that is important for retroflex consonants. Indeed, other classical approaches, such as EMA or ultrasound imaging, that offer other advantages such as higher frame rates, flesh point tracking or better practical availability, do not provide a full view of the vocal tract. This is why MRI was used in the present study.
We recorded static single slice mid-sagittal images, with a standard speech recording protocol. We operated with a Philips Achieva 3.0T dStream scanner equipped with a twenty-channel head-neck coil at the IRMaGe MRI facility, Grenoble, France. Turbo Spin Echo mode was used, with 85 $\%$
half-scan factor, no SENSE acceleration, 80° flip angle, shortest TR and TE (leading to actual TR/TE values of 731 ms/12 ms for KMU, and of 864 ms/10 ms for KD), minimum water-fat shift, and a TSE factor of 38. The acquisition duration per image was 6.58 s for KMU and 6.95 s for KD. This sequence produced single slice mid-sagittal images with a thickness of 4 mm covering a 192×256 mm2 field of view with an isotropic 1 mm in-plane resolution.
$\%$
half-scan factor, no SENSE acceleration, 80° flip angle, shortest TR and TE (leading to actual TR/TE values of 731 ms/12 ms for KMU, and of 864 ms/10 ms for KD), minimum water-fat shift, and a TSE factor of 38. The acquisition duration per image was 6.58 s for KMU and 6.95 s for KD. This sequence produced single slice mid-sagittal images with a thickness of 4 mm covering a 192×256 mm2 field of view with an isotropic 1 mm in-plane resolution.
Note that, though the acoustic speech signal was recorded simultaneously with the images, we focussed on the MRI data. The data involved in our study may thus not be plainly referred to as ‘speech data’ but rather as ‘articulatory data related to speech’.
2.3 Corpus and recording procedure
The corpus was designed to include Kannada consonants of all places and manners of articulationFootnote 2 occurring in symmetric V_V contexts with the (phonemically) short vowels /a e i o u/). This is necessary for developing comprehensive articulatory models of these speakers, taking into account the full range of articulatory positions (cf. Badin et al. Reference Badin, Bailly and Revéret2002). This produced 115 nonsense items, five for each consonant (e.g. /aʈa/, /iʈi/, /uʈu/, /eʈe/, and /oʈo/). Although limited to data from two speakers, this corpus represents the articulatory behaviour of these individuals in considerable detail, and through this serves to document articulatory patterns of Kannada to an extent rarely available in the current literature. The consonants and sample words used to exemplify the intended articulations were transcribed using the Kannada orthography and presented on a computer screen seen via a mirror to the speaker lying in a supine position in the MRI scanner.
The speakers were instructed to first repeat the utterances three or more times in a natural manner, being able to have auditory feedback, and then to freeze the consonant in the last repetition for the approximately 7.0 s duration of the scan for each recording.Footnote 3 The scan was launched by the operator as soon as he heard (through the MRI scanner communication system) that the consonant articulation was being maintained. This protocol ensured that the consonant was truly coarticulated with the vowel. After each recording it was visually verified that the image was not affected by blurring, which could signal unwanted movement, in which case the speaker was invited to make a new recording. The appropriateness of each produced item was further verified auditorily and acoustically based on the audio recordings of the session obtained through an optical microphone positioned close to the speaker’s lips and using a denoising procedure (Kahana et al. Reference Kahana, Paritsky, Kots and Mican2003). As Supplementary File S1 shows, there were no apparent differences in trajectories of F1 and F2 formants between the normally produced and sustained articulations. As expected, retroflexes under both conditions showed lower F3 than dentals prior to the constriction. Note that, though the experiment was intense, the speakers did not report any noticeable fatigue, as confirmed by our acoustic verifications.
An issue with MRI is the unnatural position of the speaker who lies in a supine position and is thus submitted to gravity in an unusual direction compared to an upright position. This has been discussed in several papers. Based on data from X-ray microbeam, Tiede et al. (Reference Tiede, Masaki and Vatikiotis-Bateson2000) observed the greatest effect of supine position for sustained vowels compared to running speech, concluding that ‘the results of MR imaging of sustained production in supine position should be interpreted with some caution’. Using an open-type MRI scanner, Kitamura et al. (Reference Kitamura, Takemoto and Honda2005) observed influences both on the soft tissue and rigid structures but noted that these effects might be ascribed to head posture rather than to gravity. Using ultrasound imaging, Stone et al. (Reference Stone, Stock and Bunin2007) observed significant effects of the upright-supine position, though these effects were small for most of their subjects. Finally, using a rotating MRI scanner, Traser et al. (Reference Traser, Burdumy and Richter2013) compared the vocal tract profiles of trained tenors between supine and upright position, and concluded that the effect could be considered to be rather small for these professional tenors. In order to reduce the possible bias of the supine position in our own experiment, we instructed the speakers to rehearse reading the corpus while lying in their beds the night before the recording. In addition, we positioned them in the MRI scanner so as to maintain the most natural head posture possible. We cannot conclude that the bias did not exist, but certainly that it was minimized. A further step would likely be to use dynamic MRI for running speech, which is out of the scope of this study.
2.4 Semi-automatic contour segmentation
The speech articulators/organs examined here, illustrated in Figure 1, are the jaw, the upper and lower lips, the tongue, the hard palate, the velum, the naso-oropharyngeal wall, the laryngeal articulator (in reference to the laryngeal articulator model, cf. Esling Reference Esling2005 and Esling et al. Reference Esling, Moisik, Benner and Crevier-Buchman2019 Footnote 4 ), the epiglottis (though it is not an active articulator, cf. Esling et al. Reference Esling, Moisik, Benner and Crevier-Buchman2019) and the hyoid bone. Semi-automatic segmentation of the associated contours from the MRI images was performed according to the method developed by Labrunie et al. (Reference Labrunie, Badin and Voit2018). First, the boundaries of the upper teeth and hard palate as well as those of the lower teeth and jaw bone were manually outlined on reference images in order to serve as reference rigid contours. Besides, the unwanted head movements of translation parallel to the midsagittal plane and of rotation around the left-right direction were automatically determined and counterbalanced for all images, in order to realign the skull structures – and in particular the hard palate – on the same chosen reference image (cf. Labrunie et al. Reference Labrunie, Badin and Voit2018 for details). However, this procedure cannot compensate for the fluctuation of head tilt, i.e. of the angle between the skull and the posterior wall of the pharynx. The effects of this variation on the articulators’ shape were thus removed based on linear articulatory modelling. This procedure was validated (cf. 2.6.2), and thus further analysis or modelling of the whole set of contours was performed on the corrected shapes.
A set of 60 images was then automatically selected among the 120 available items by means of unsupervised ascending hierarchical clustering to include the most different images (cf. Labrunie et al. Reference Labrunie, Badin and Voit2018). All contours were manually segmented for these images. The rigid contours (jaw and hyoid bone) were positioned by means of rotation and translation, while deformable contours were edited using B–splines. In addition, specific anatomical landmarks were located by the expert in order to determine coherent extremities for some of the articulators: e.g. tongue tip extremity TT, subnasale for the upper lip N2, i.e. the anatomical point of face at the junction of the lower border of nasal septum and the superior border of upper lip (Subnasale | Semantic Scholar, n.d.) or submentale for the lower lip LL1, i.e. the dip between the lower lip and the chin. See Figure 1 for an illustration, and Bishara et al. (Reference Bishara, Cummins, Jorgensen and Jakobsen1995) for more details.
The data were subsequently used to train modified Active Shape Models that could predict the contours from the images for the rest of the corpus (Labrunie et al. Reference Labrunie, Badin and Voit2018). All contours of the full corpus, i.e. the 120 items, were finally checked and manually corrected if needed. Figure 1 illustrates the resulting contours and landmarks for one speaker. Next, the contours were all aligned on the same hard palate contour and each resampled with a number of points fixed for each articulator, using the landmarks as extremities when needed. This resampling ensures the possibility to reliably compare contours and build models based on methods requiring a constant number of variables, such as Principal Component Analysis (PCA). Supplementary File S2 provides individual images with overlaid contours as exemplified in Figure 1 for the eight coronal consonants and five vowel contexts for both speakers.
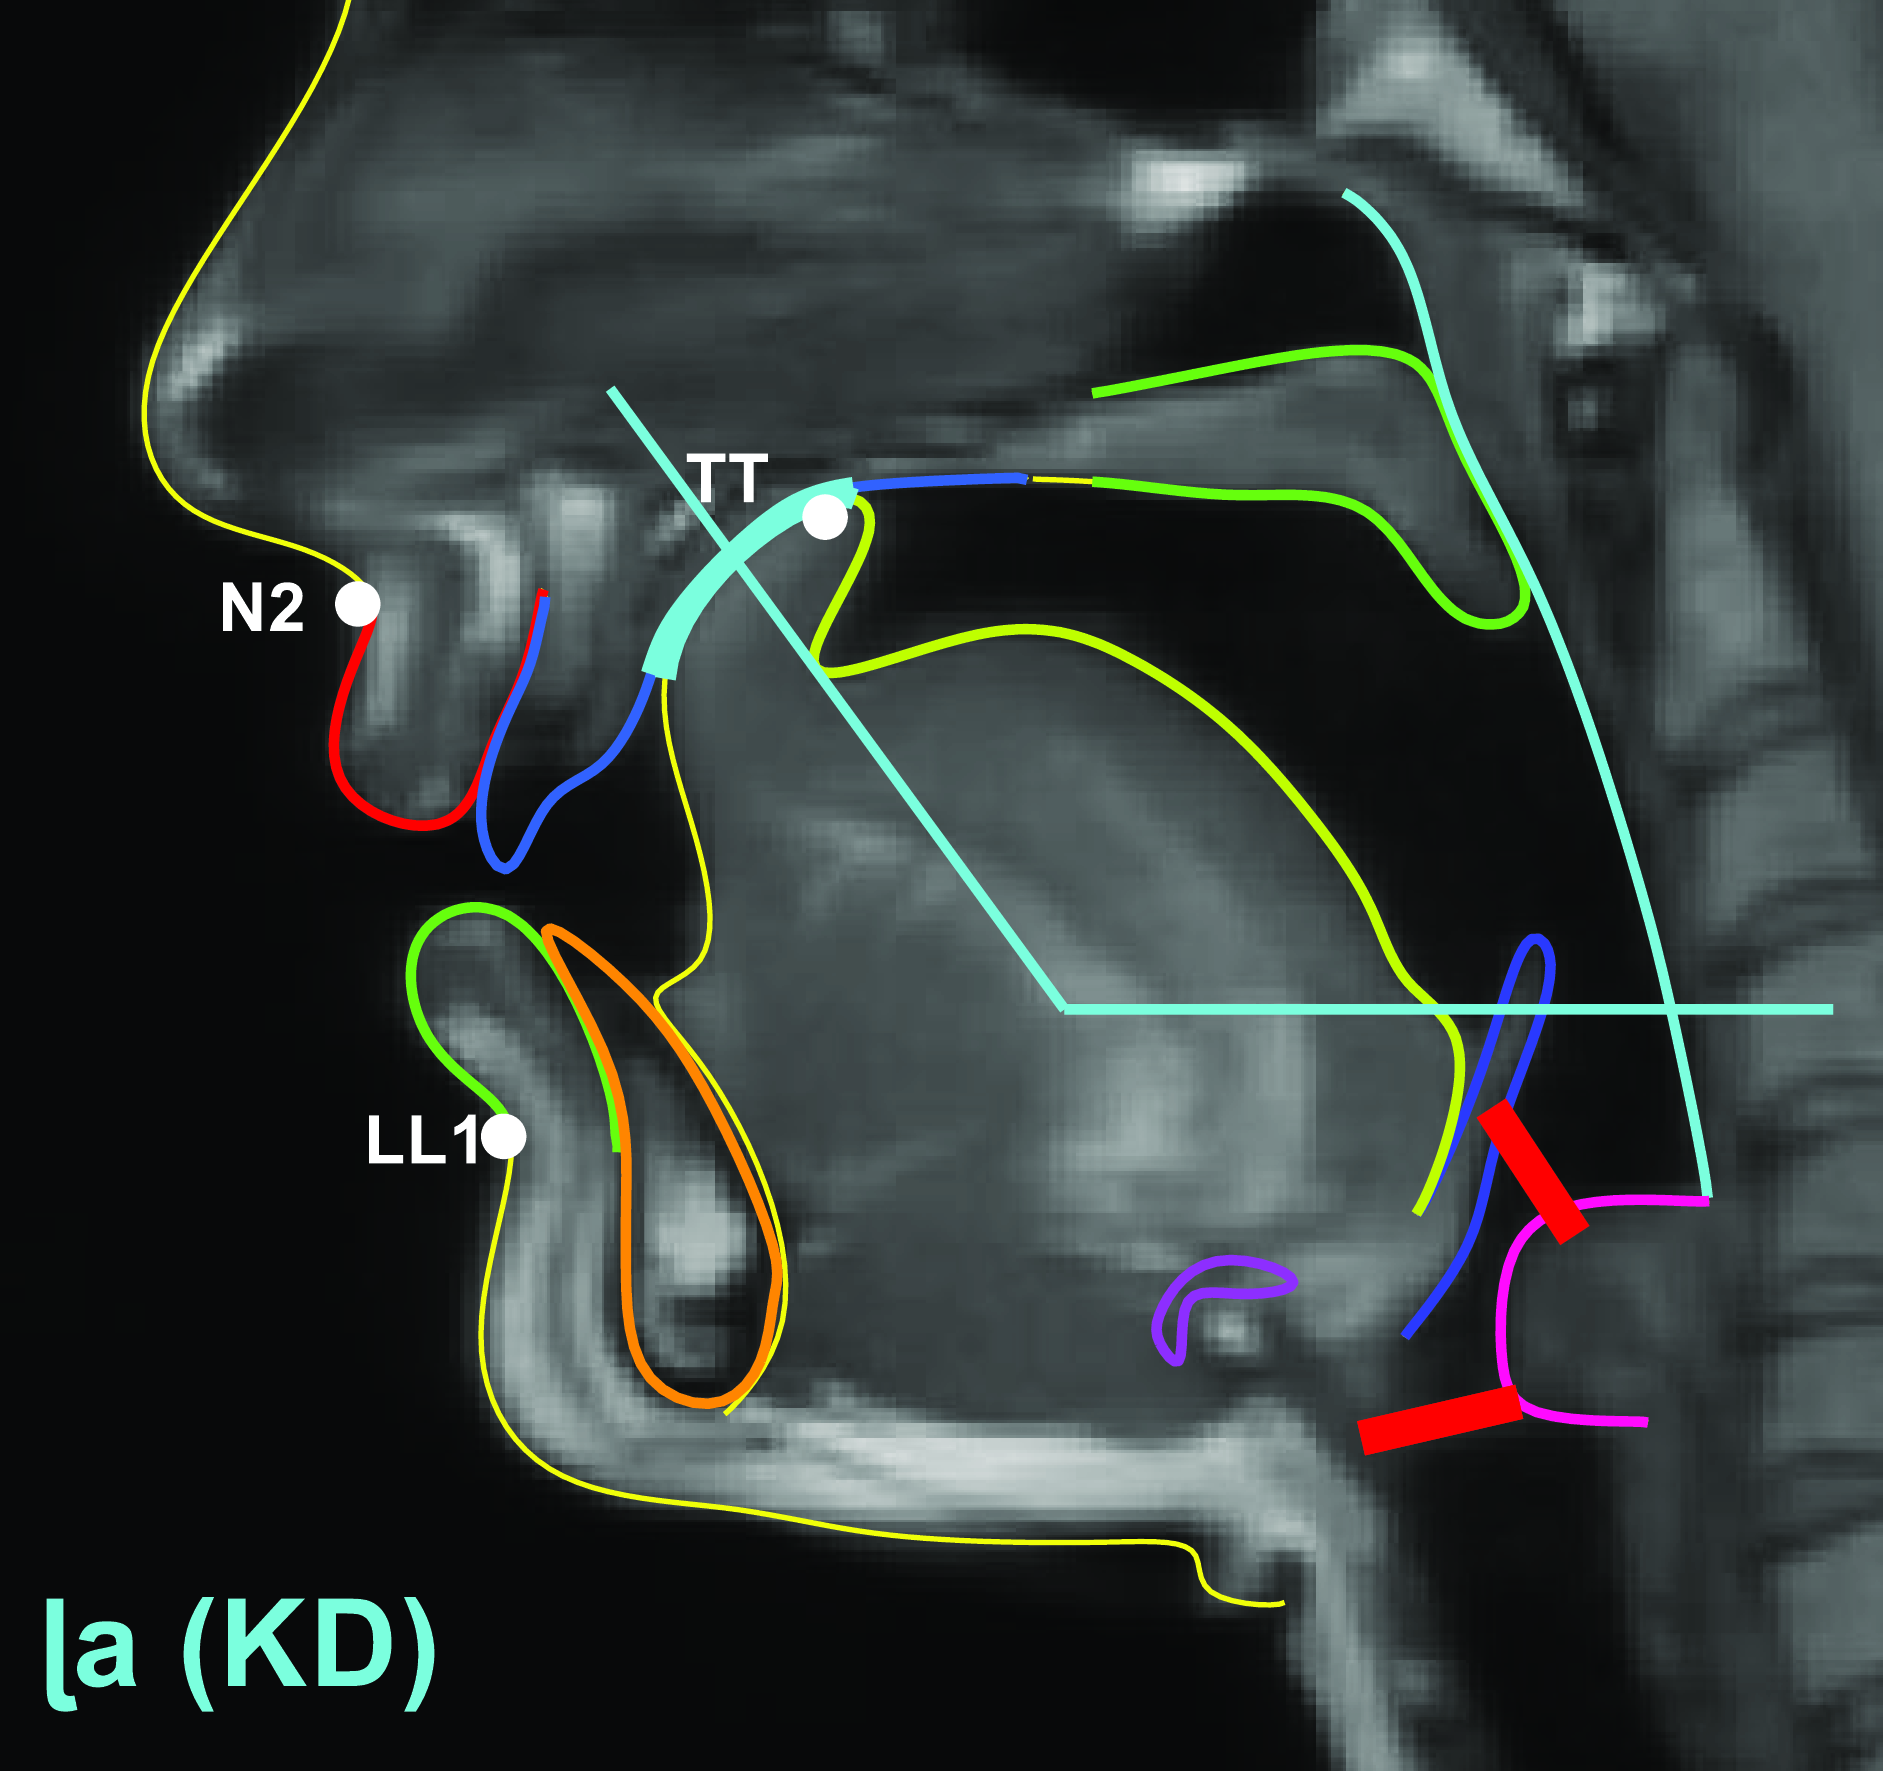
Figure 1. Articulator/organ contours superimposed on a midsagittal image of /ɭ/ in /aɭa/ (speaker KD). Resampled contours are identified by different colours, in a clockwise rotation along the vocal tract walls: upper lip, palate, velum, naso-oropharyngeal wall, laryngeal articulator, epiglottis, hyoid bone, tongue, jaw, and lower lip. The original contours available for the image are traced in yellow lines. The three anatomical landmarks are displayed with white dots. Two red thick lines have been added to facilitate the interpretation of the laryngeal region: the aryepiglottic folds (top) and the vocal folds (bottom) that cannot be seen in such a midsagittal image correspond to the extremities of the epilaryngeal tube.
2.5 Tongue tip constriction geometric characteristics
In order to characterize articulations in terms of location and size of the tongue tip constriction (TTC), we determined both parameters for each articulation, following Proctor et al. (Reference Proctor, Bundgaard-Nielsen and Best2010)’s analysis of coronal consonants in Wubuy (an Australian Aboriginal language).
We have adopted a method based on a low frequency approximation of the constriction tube acoustic impedance Low Frequency Impedance (LFI)Footnote 5 (cf. Fant Reference Fant1960: 80) to smooth out acoustically irrelevant details (see a detailed description in Supplementary File S3). First, we divided the vocal tract contours into a chain of quadrilateral sections that constitutes a sampling of the midsagittal function. Then, we computed the LFI for each quadrilateral having a cross-dimensional distance below a given threshold: the centre of the constriction was considered as the location upstream and downstream of which the cumulated LFIs are equal. Next, the whole constriction duct was considered as the set of all contiguous sections with an LFI below a given ratio of the maximum LFI. Finally, we computed the cross-dimension of the constriction duct as the cross-dimension of a uniform tube having the same total length and the same cumulated LFI over all the quadrilaterals belonging to the constriction. The centre of the constriction coordinate was finally expressed as the angle of this point in reference to the centre of the vocal tract,Footnote 6 referred to as TTCL (tongue tip constriction location) in the following. The results of this approach are illustrated further in Figure 3, where the constriction limits are outlined by thicker cyan lines on the inner and outer walls, and the centre of the constriction is marked by the radial line. The acoustically equivalent length will be referred to as TTClength, while the cross-dimension of the acoustically equivalent constriction duct will be referred to as TTCD (tongue tip constriction degree).
2.6 Linear articulatory modelling
2.6.1 Principles of linear articulatory modelling
Due to their complexity, articulatory contours are difficult to characterize in a manner that is meaningful and relevant for speech. Articulatory modelling constitutes a way to deal with this issue, as it offers the possibility to boil down the apparent articulatory complexity to a few basic components. As reviewed in Serrurier et al. (Reference Serrurier, Badin, Lamalle and Neuschaefer-Rube2019), linear articulation models based on principal component analysis (PCA) have been successfully used to extract and characterize the basic articulatory components of a speaker. In this framework, each set of contour coordinates for each organ is modelled as a sum of linearly uncorrelated components. This can be illustrated with the tongue model that is controlled by five parameters JH, TB, TD, TTF and TTH (jaw height, tongue body, tongue dorsum, tongue tip fronting, tongue tip height, see Appendix A1 for the full list and further below for more details). For a given articulation of the corpus, each of the x & y coordinates xyv(i) of the tongue contour points (for i varying from the first to the last tongue point) is modelled as:
xyv(i) = xy_mean (i)+ JH × coef_JH (i)+ TB × coef_TB (i)+ TD × coef_TD (i)+ TTF × coef_TTF (i)+ TTH × coef_TTH (i)+xy_error (i)
where JH, TB, TD, TTF and TTH are the values of the control parameters corresponding to the given articulation, xy_mean (i) is the mean of the coordinate over the corpus, coef_JH, TB, TD, TTF and TTH (i) are the model coefficients for the point (i) and xy_error (i) a reconstruction error for the given articulation.
In the present study, we used ‘guided’ PCA to determine the model coefficients – and thus the associated control parameters – in order to take into account the sole correlations related to biomechanisms while excluding correlations clearly related to pure control strategies (cf. Maeda Reference Maeda, Hardcastle and Marchal1990; Beautemps et al. Reference Beautemps, Badin and Bailly2001).
For each speaker, we built articulatory models of all organs of potential interest (jaw, upper and lower lips, tongue, velum, laryngeal articulator, epiglottis, hyoid bone) following the approach described by Badin et al. (Reference Badin, Bailly and Revéret2002). We could have attempted to perform a combined analysis of the two speakers, as in Serrurier et al. (Reference Serrurier, Badin, Lamalle and Neuschaefer-Rube2019), but this might have missed speaker-specific differences resulting either from specific strategies or anatomical differences. Note that the full set of the 120 articulations of the corpus was used for building the models (see footnote 2), though the analysis of coronal contrasts presented here was based on a smaller set of relevant articulations. To illustrate the general behaviour of these models, we generated articulatory nomograms, i.e. displays of the articulator shapes associated with variations of the control parameters of the model over a –3/+3 range (note that all control parameters are z-scored). Figure 2 displays a few of these nomograms. The two control parameters of the jaw articulator, JH (jaw height) and JA (jaw advance), were the z-scored values of the vertical and horizontal coordinates of the lower incisors’ edge. JH was also used as the first control parameter of the tongue. Its main effect on the tongue was a rotation around a point in the back of the tongue, as illustrated in Figure 2a for speaker KD; the effect is much more limited for KMU.Footnote 7
For simplification and coherence with previous papers (Beautemps et al. Reference Beautemps, Badin and Bailly2001; Serrurier et al. Reference Serrurier, Badin, Lamalle and Neuschaefer-Rube2019), we used the term tongue body (TB) to refer to the component that controls the front/high vs. back/low movement of the body of the tongue towards/away from the hard palate (see Figure 2b). We used the term tongue dorsum (TD) to refer to the component that controls the tongue back raising vs. lowering movements of the tongue towards/away from the velum that is particularly visible in its dorsum region (see Figure 2c).Footnote 8 The TB and TD parameters were extracted by PCA from the tongue contour coordinates from which the jaw height JH contribution had been removed, but excluding the tongue tip region to make sure to capture main movements related to the bulk of the tongue. Note that the raising movement of the posterior region of the tongue towards the velum is accompanied by some lowering of the tongue blade. The last two parameters, tongue tip fronting (TTF), and tongue tip height (TTH), were extracted by PCA from the tongue contour coordinates from which the TB and TD contributions (and also JH) were removed (see Figures 2d and 2e). Figure 2d shows that TTF is responsible for the lowering of the middle region of the tongue and the fronting of its back region, which seems crucial for the raising and retraction of the tongue tip during retroflexion. Note that the less visible but very important effect of TTH is the fronting/backing of the tongue tip in a slightly oblique way for both speakers. This appears indeed to be accompanied by a raising/flattening movement but in different parts of the vocal tract.
For the upper and lower lips, the z-scored values of the protrusion (ULP, LLP) and height (ULH, LLH) measurements were used as control parameters in complement to JH (see Figures 2d and 2e). This approach led to somehow lower performances than using the first two PCA components of the JH residue, but ensured a better interpretation of these components in terms of phonetics.
The models of the other organs (velum, hyoid, epiglottis and laryngeal articulator) were simply controlled by their first one or two PCA components. The vertical and horizontal movements of the laryngeal articulator, epiglottis and hyoid bone were controlled by three pairs of parameters respectively: LAH/LAF (laryngeal articulator height/fronting), EPH/EPF (epiglottis height/fronting) and HYH/HYF (hyoid height/fronting) (see Appendix A1).
It was expected that the lingual parameters TTF, TTH, TB, and TD would be primarily responsible for differences among consonants in place (dental vs. retroflex). Specifically, TTF and TTH would serve as articulatory manifestations of respective differences in the location (more anterior or posterior) and shape of the constriction (apical, laminal, or sublaminal). TB would be expected to capture the tongue body backing away from the hard palate for retroflexes (also referred to as tongue middle lowering: Hamann Reference Hamann2003). A higher TD would be indicative of the tongue back raising towards the velum (velarization: Hamann Reference Hamann2003), if this would indeed be the case for our speakers. Other parameters were expected to implement manner differences, but could also potentially contribute to the place contrast. In particular, retroflexes may be produced with a lower jaw (JH) and – in case of the tongue root retraction – a raised larynx (LAH; see Section 1.2).
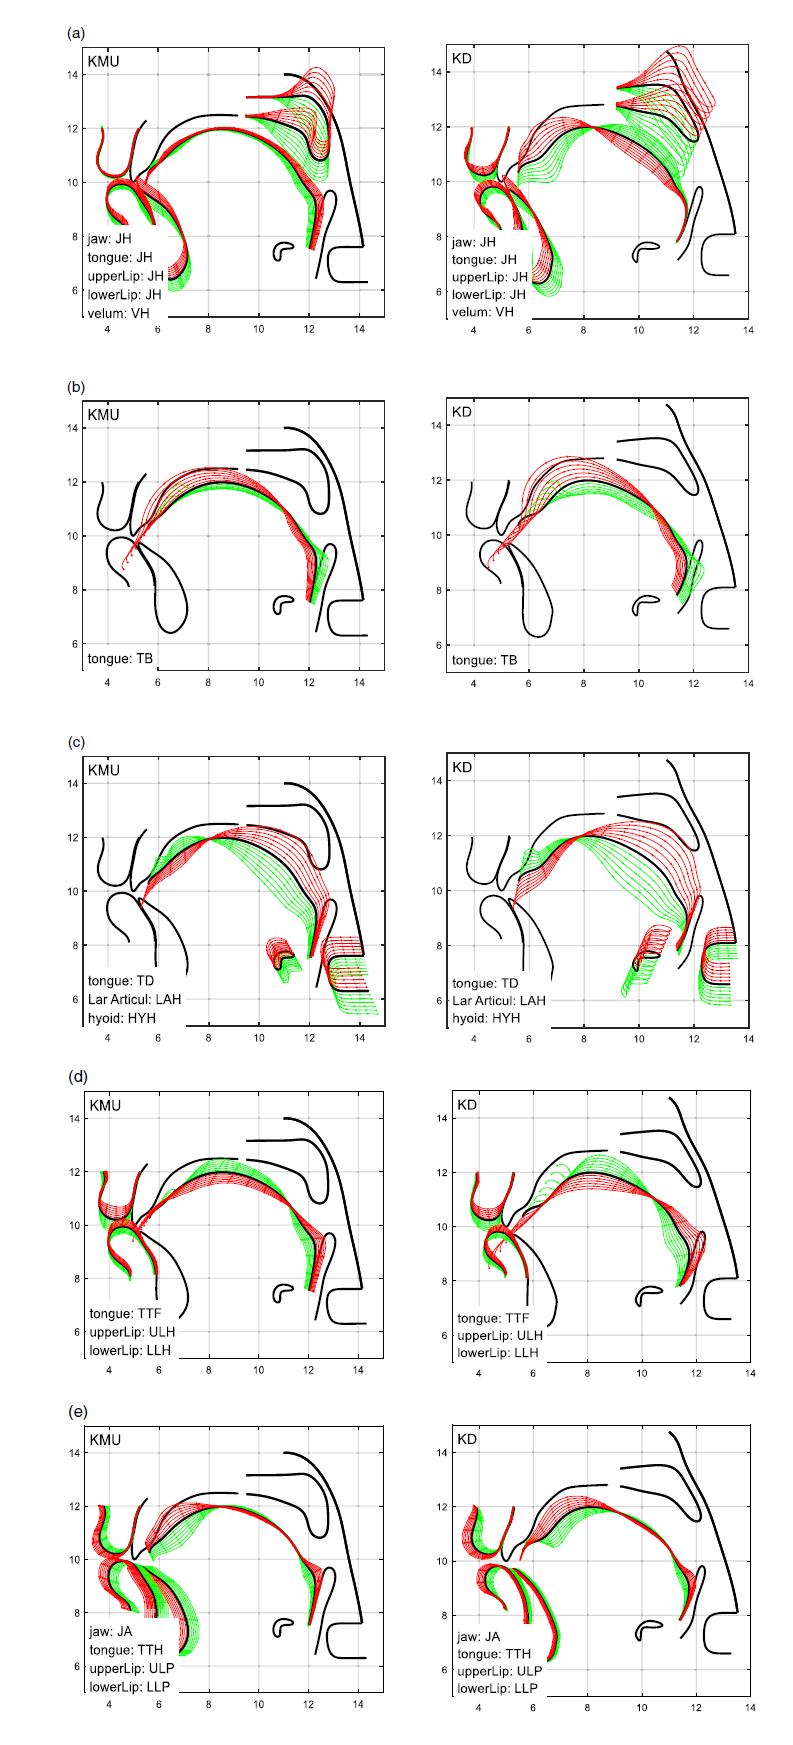
Figure 2. Most important articulatory nomograms for both speakers (left KMU, right KD). Nomograms of jaw, tongue, lips, velum, hyoid, epiglottis and laryngeal articulator are displayed as the variations of their shapes for some of the control parameters varying from -3 to +3 by 0.5 steps [the scale is 2 cm for each square]. Mean contours are drawn in black lines, contours for negative parameter values in green, and those for positive values in red. Every tenth point is displayed with dots to illustrate the movements of the models points. Each figure contains nomograms grouped together for two or more organs and parameters. The lists at the bottom left indicate the organs involved and the control parameters that are varied. For instance, Figure 2e corresponds to the jaw movement controlled by JA and the tongue movement controlled by TTH, in addition to lip protrusion parameters ULP and LLP. Note also that in Figure 2a, JH controls simultaneously the jaw, tongue and the lips.
2.6.2 Assessment of the articulatory models
The models were evaluated in terms of cumulative relative variance explained (VarCum) and of root mean square contour reconstruction error (RMSE). Overall, the model reconstruction was accurate, with an explained variance between 66
$\%$
and 98
$\%$
, and an RMSE between 0.02 cm and 0.10 cm, which is consistent with previous similar models elaborated by other speakers (Serrurier et al. Reference Serrurier, Badin, Lamalle and Neuschaefer-Rube2019).
In addition, in order to assess the similarity of articulatory strategies of the speakers, we estimated the Pearson correlation coefficient between each articulatory parameter of the two speakers. Values revealed that the tongue strategy was rather similar (0.75 for TB, 0.55 for TD, up to 0.70 for TTF, though the jaw was not as highly correlated: 0.18). Other important similarities were found for the velum (0.90 for VH) or for the upper lip (0.60 for ULH).
In order to validate the head tilt correction procedure, we performed all the modelling and the statistical analysis on both sets of raw original contours and head tilt corrected contours. We determined the Pearson correlation coefficients between each of the articulatory parameters of the two speakers and found that the parameters with the lowest coefficients (below 0.95) were those related to fronting in the larynx region (LAF, EPF), which is precisely the region that has been most affected by the correction. In addition, a visual comparison of the nomograms and of the radar plots (see Section 2.6.3) between the two sets did not reveal noticeable differences, except for these specific parameters, which validates the approach.
2.6.3 Radar display of articulatory parameters
We saw that the articulatory parameterization allows us to characterize each articulation with a small number of articulatory parameters. Following Silva et al. (Reference Silva, Martins, Oliveira, Teixeira, Mesa, Ortega, Teixeira, Pérez, Morales, García, Moreno and Toledano2014), we used a radar (spider) chart to display the main articulatory parameter values simultaneously in a compact way: the superposition of two or three sets of such displays allows a comparison of articulations in terms of main articulatory components, as will be illustrated later in the paper (Figure 5). In such plots, values for each component are the means over five vowel contexts; along each radius, the values increase from the minimum on the inner polygon (corresponding to the extreme green contours on the nomograms, Figure 2) to zero on the intermediate polygon, to the maximum on the outer polygon (corresponding to the extreme red contours in the nomograms).
2.6.4 Statistical analyses
Although our dataset is fairly limited, being based on single repetitions of items produced by two speakers, we chose to provide an exploratory statistical analysis of the data. This was done in order to discern more or less important place/manner differences and relative contributions of articulatory parameters. These results should be interpreted with caution and will require further confirmation with larger datasets.
Two kinds of statistical analyses were performed in the study. The first analysis was used to assess the relative importance of each variable (tongue constriction parameters and articulatory components) employing a classification and regression tree (CART) method implemented using the rpart package (Therneau & Atkinson Reference Therneau and Atkinson2019) and predict() function in R. This classification method determines which variables – and to what extent – predict Place or Manner distinctions. This is done through recursive binary partitions of the data until the algorithm arrives at maximally homogeneous groups (see e.g. Gao et al. Reference Gao, Yun and Arai2021) for a recent application of the method in phonetics). The classification analyses were performed separately for each speaker.
The second analysis made use of linear mixed effects regression (LMER) models with tongue constriction parameters and articulatory components as dependent variables. Fixed effects were Place (dental, retroflex), and Manner (stop, fricative, nasal, lateral). These were included in the models as well as their interactions, implemented with the lme4 package (Bates et al. Reference Bates, Mächler, Bolker and Walker2015) using R (version 3.6.1, Team, 2014). The random effects were Manner (for Place analyses) or Place (for Manner analyses) and Vowel (/i/, /e/, /a/, /o/, /u/), with random intercepts only. For example, a model for TB was defined as lmer(TB ∼ Place + (1 | Manner) + (1 | V), data). In each case, likelihood ratio tests were used to compare a full model to a nested model excluding the factor of interest, employing the Anova() function of lmerTest package (Kuznetsova et al. Reference Kuznetsova, Brockhoff and Christensen2017). Pairwise comparisons and post-hoc tests (with a Bonferroni correction for multiple comparisons) were performed using the phia package (De Rosario-Martinez Reference De Rosario-Martinez2015). For space reasons, tables presenting model summaries and comparisons are given in Supplementary File S4.
In general, we would expect that variables that are particularly important in the implementation of the place and manner contrasts would be identified as such by both the classification and LMER models. In a preliminary analysis, we have attempted to determine the variables that are the most important. As a first step, we selected components that are directly related to the tongue activity, as these are crucial for coronal places: TTF, TTH, TB, and TD. Then we selected the components JA and JH, as these may facilitate lingual constrictions, and VH as crucial for the nasal manner. We further considered other components that correspond to actual articulators: LLP, ULP, LLH, ULH for the lips and LAF and LAH for the larynx. Our preliminary LMER analysis, however, revealed no involvement of the lip component in the realization of the place/manner contrasts (though it did for vowel contexts), and no consistent influence of LAF. Hence, we left all those out and retained LAH. This component was also considered useful given Esling et al. (Reference Esling, Moisik, Benner and Crevier-Buchman2019)’s predictions about the relation between tongue backing and larynx raising. As the remaining components (PHH, PHF, HYF, EPF, EPH) do not correspond directly to active articulators, we also decided to exclude them from the analysis (most of these components were actually not found to be relevant based on correlation analyses and a preliminary LMER analysis). HYF presented an exception, and hence we retained it. This gave us in total nine components: TTF, TTH, TB, TD, HYH, JA, JH, VH, and LAH, which were used in the subsequent statistical analyses.
3 Results
Results related to the tongue tip constriction geometry parameters are presented in Section 3.1, while those related to articulatory model components are presented in Section 3.2. Each of the sections begins with an informal overview of the results (or a subset of them), followed by results of statistical analyses – rpart classification and LMER models by place and manner. These two sections are followed by a summary of major findings in Section 3.3. The data used in the analyses presented here are provided as a spreadsheet in Supplementary File S5.
3.1 Tongue tip constriction
3.1.1 Overview
3.1.1.1 The /a/ context
We will begin with an overview of place- and manner-specific differences in the realization of tongue tip constrictions (see Section 2.5 and Appendix A1). Figure 3 presents constriction location plots for the eight coronal consonants in the context of the low central vowel /a/, separately by speaker.
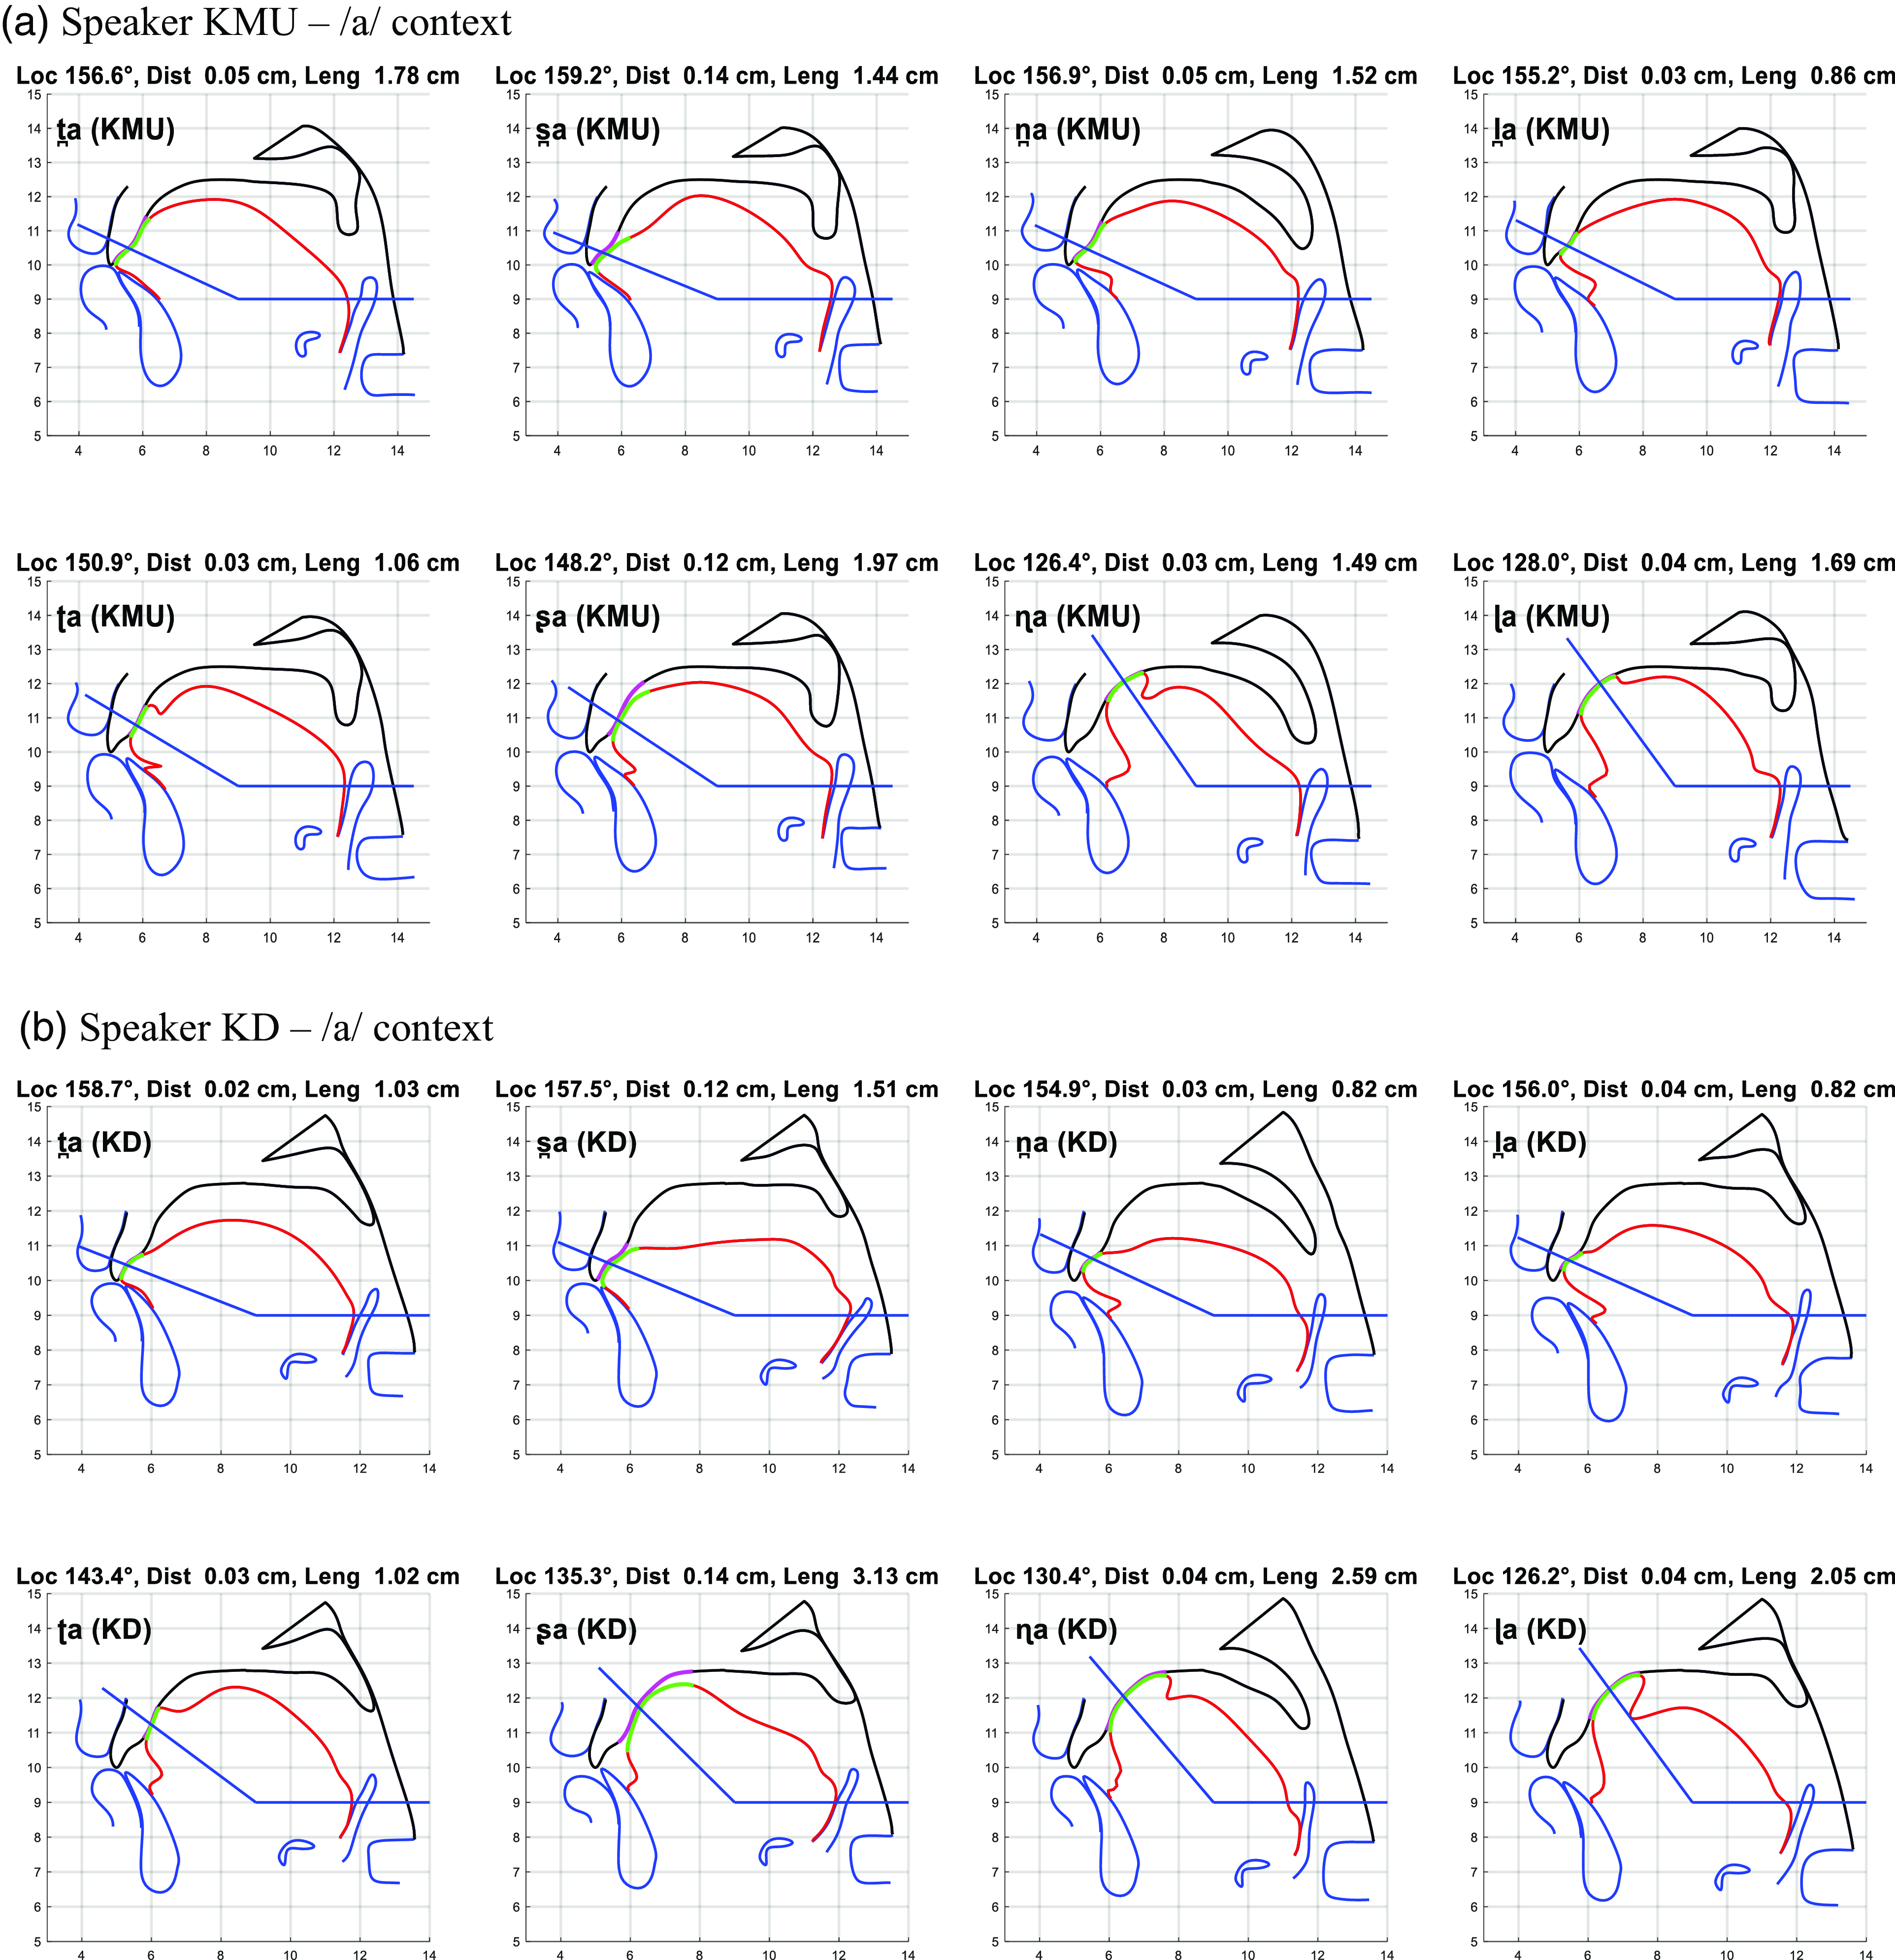
Figure 3. Constriction plots for the eight coronal consonants produced in the /a/ context by by speakers (a) KMU and (b) KD. The parts of tongue and hard palate represented by thicker lines correspond to the tongue constriction; the angle of the straight line that crosses the constriction in its middle constitutes a measure of the constriction location. The top line displays TTCL (Loc) in °, TTCD (Dist) in cm, and TTClength (Leng) in cm.
Considering KMU’s plots first in Figure 3a (cf. Supplementary File S3 for the set with all vowel contexts), we can see that her dentals were produced with the tongue tip and blade articulating against the upper teeth and the alveolar ridge (i.e. apico-laminal denti-alveolars). The constriction location angle ranged between 155.2° and 159.2° (first row of Figure 3a), that is being fairly anterior. The extent of the constriction region along the vocal tract varied somewhat, being the greatest for the stop (1.78 cm) and the smallest for the lateral (0.86 cm). The tongue shape for the dentals was uniformly convex, with the entire tongue being shifted more forward for the stop and slightly backwards for the lateral, compared to the fricative and the nasal. As expected, the fricative was produced with a larger constriction degree (TTCD) than its stop, nasal, and lateral counterparts (distance of 0.14 cm vs. 0.03–0.05 cm).
KMU’s retroflexes (the second row in Figure 3a) were overall more posterior than the dentals of the same manner, although only minimally so for the stops. The precise locations of these constrictions, and thus the angles, varied considerably. Those for the stop and the fricative were more anterior – alveolar/post-alveolar (150.9° and 148.2°). Those for the nasal and lateral were more posterior – prepalatal or palatal (126.4° and 128.0°). There was a lot of variation in the active articulator and its shape as well. The stop was produced with the tongue tip (apical), the fricative with the tongue blade (laminal), the nasal with the tongue underside (sublaminal), and the lateral – apparently – with a combination of the tip and the underside (apico-sublaminal). The extent of the contact region was the greatest for the fricative (1.97 cm) and the smallest for the stop (1.06 cm). The tongue shapes were overall similar for the stop, nasal, and lateral in showing a concavity between the blade and the tongue middle, resulting from the raising and retraction of the tip. The posterior portion of the tongue was also relatively flat and somewhat advanced (less so for the lateral). In contrast, the fricative lacked the characteristic tongue tip retraction (retroflexion) or even raising (apicality). The entire tongue for this consonant was strongly convex, resembling an alveolopalatal, showing a small sublingual cavity. The retroflex consonants also showed some variation in constriction length (TTClength), with values ranging from 0.86 cm for /l̪/ to 1.97 cm for /ʂ/. No clear place or manner patterns, however, were apparent for this variable. In terms of constriction degree (TTCD), on the other hand, the fricative was clearly different from the other consonants (distance of 0.12 cm vs. 0.03–0.04).
Turning to KD’s plots for /a/ (cf. Figure 3b, and Supplementary File S3 for the set with all vowel contexts), we can observe overall similar patterns. Dentals showed apico-laminal denti-alveolar constrictions characterized by relatively large angles (first row, 154.9° to 158.7°). Constrictions for retroflexes were more posterior – post-alveolar to prepalatal (second row, 126.2° to 143.4°). They also showed the same manner asymmetry as for KMU, with constrictions being more posterior for the nasal and the lateral. The latter two consonants were sublaminal retroflexes, while the oral stop appeared to be apical. The fricative was a strongly laminal alveolopalatal. In terms of constriction length differences, the fricative had the most extended constriction region among the dentals, followed by the stop (1.51 and 1.03 cm), while values for the sonorants were considerably lower (both 0.82 cm). For retroflexes, the stop showed the shortest constriction length (1.02 cm), while the fricative showed the longest one (3.13 cm), which is exactly the same pattern as for KMU. For both fricatives, the constriction showed a wider opening, as manifested in larger TTCD values compared to the other consonants (0.12–0.14 cm vs. 0.02–0.04 cm). Tongue shapes for the non-fricative dentals were relatively similar, being overall relatively convex (yet somewhat less for the nasal). The tongue shape for the fricative was fairly flat. The non-fricative retroflexes showed considerable convexity between the blade and the middle, resulting from the depression of the body and retraction of the tip. The latter was particularly salient for the nasal and the lateral. A result of this retraction was a large sublingual cavity. The posterior portion of the tongue was relatively flat and somewhat advanced (compared to the dentals of the same manner). As for KMU, the shape for KD’s /ʂ/ was very distinct, lacking any apicality or retroflexion, yet showing a small sublingual cavity.
It should be kept in mind when comparing these articulations that they were sustained over a period of several seconds, and therefore likely represent hyper-articulated versions of these sounds. While possibly more extreme (e.g. involving a more posterior constriction for retroflexes) than the corresponding sounds occurring in natural fluent speech, these articulations are plausibly representative of speakers’ intended target articulations, and therefore informative for our purposes.

Figure 4. Boxplots for TTCL (°), TTClength (cm), and TTCD (cm) for the eight coronal consonants across five vowel contexts by speaker; fric = fricative, nas = nasal, lat = lateral, dent =dental, ret = retroflex.
3.1.1.2 Across contexts
Our observations made for the /a/ context generally held for the other vowel contexts. As seen in Figure 4, TTCL values were consistently higher for dentals than retroflexes, this difference being overall greater among sonorants (nasals and laterals). Within retroflexes, TTCL values were higher for obstruents than sonorants. As observed in the /a/ context, TTClength did not consistently distinguish places or manners, apart from a few consonants and in a speaker-dependent way. A longer constriction was exhibited by KMU for the dental /t̪/ compared to the retroflex /ʈ/, while the opposite difference was evident in KD’s dental fricative, nasal, and lateral, compared to their retroflex counterparts. The latter differences reflect the finding that KD’s retroflex /ɳ/ and /ɭ/ were produced as sublaminal and /ʂ/ as laminal, unlike the mostly apical dental counterparts. No such articulator shape distinction, however, was observed for stops, both of which were essentially apical. For both speakers, the retroflex fricative, actually produced as an alveolopalatal, showed a wide range of variation in TTClength values. As expected, higher TTCD values clearly distinguished fricatives from all the other consonants.
Having examined differences in the tongue tip constriction informally, we turn to their quantitative analyses using classification and linear mixed effects models, separately by place and manner.
3.1.2 Analysis by Place
As mentioned in Section 2.6.4, we performed two kinds of statistical analyses – an rpart classification using the full set of variables (TTCL, TTClength, and TTCD) and LMER models separately for each variable. Each of the analyses was run on two sets (separately for each speaker) – the full set of consonants and the set of non-fricative consonants.
A summary of the results for Place is given in Table 2, including the relative importance of variables and cut-off values (see below) based on the rpart classification, and significant Place effects (and the corresponding differences) based on LMER model output (see Supplementary File S4 for details). Looking at the results for the full set of consonants in Table 2(a), we can see that all three variables contributed to the rpart classification of place contrasts for both speakers. However, the magnitude of these contributions, the relative importance of the variables, varied considerably.
Table 2 A summary of statistical results for Place: relative importance of constriction variables (rpart,
$\%$
, with cut-off thresholds) and significant effects of Place (LMER, with respective differences) for the speakers KMU and KD based on (a) the full consonant set and (b) without fricatives; ‘>’ means ‘greater than’; significant differences: *** = p < 0.001, ** p < 0.01, * < 0.05, n.s. = not significant, with the corresponding cells shaded; dent = dental, ret = retroflex
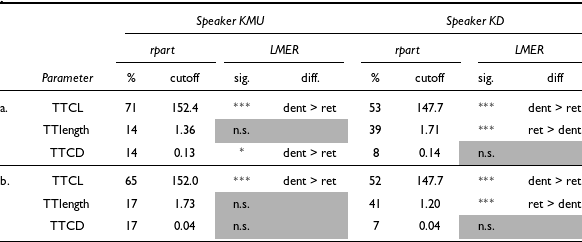
Starting with KMU, TTCL was by far the most important variable (71
$\%$
) for the speaker, followed at a considerable distance by TTClength and TTCD (both 14
$\%$
). The output of the analysis showed that retroflexes as a class were characterized for KMU by TTCL values below 152.4° (more posterior), TTClength values below 1.36 cm (a shorter contact), and TTCD values below 0.03 cm (a tighter constriction). Among these variables, only TTCL and TTCD were found to be significant by the LMER analysis in distinguishing retroflexes from dentals (dental > retroflex).
For KD, TTCL was also the most important variable (53
$\%$
), yet not so different in this respect from TTClength (39
$\%$
). The contribution of TTCD was relatively small (8
$\%$
). Retroflexes in this set tended to show TTCL values below 147.7° (more posterior), TTClength values above 1.71 cm (a longer contact), and TTCD values above 0.14 cm (a weaker constriction). Note that the direction of the latter two differences is the opposite from KMU. Based on the LMER analyses for KD, only TTCL and TTClength could significantly distinguish dentals and retroflexes (dental > retroflex and retroflex > dental, respectively).
Excluding fricatives from the analysis produced overall similar results for both speakers, as can be seen in Supplementary File S4, Table 3b. The only major difference was the lack of significant results for TTCD for KMU.
Overall, these results highlight the importance of TTCL in distinguishing place for both speakers: retroflexes with or without /ʂ/ were more posterior and dentals were more anterior. In addition, the length of the constriction also mattered for KD, whose retroflexes were characterized by greater values. The rpart classification of consonants using all three constriction parameters (see Supplementary File S4), with or without fricatives, was 100
$\%$
accurate for both speakers (in fact, 100
$\%$
accuracy in classification was achieved even based on TTCL data only, with TTClength and TTCD values excluded). This further confirms the relevance of the variables, and particularly TTCL, in distinguishing the place contrast for our speakers.
3.1.3 Analysis by Manner
Having established the role of constriction parameters for place contrasts, we now turn to examining their role for distinguishing manner differences.
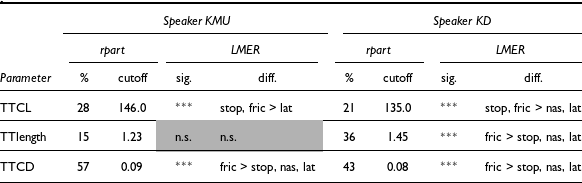
A summary of statistical results for Manner is shown in Table 3. For KMU, manner differences were primarily distinguished by TTCD (57
$\%$
), followed by TTCL (28
$\%$
), and then TTClength (15
$\%$
). TTCD values above 0.09 (a wider constriction) tended to distinguish fricatives from the other consonants, while TTCL above 146° (more posterior) distinguished laterals and nasals on the one hand, and stops on the other. As seen in Table 3, however, the method failed to correctly classify /ɳ/, which was mainly confused with laterals, and /l̪/, which tended to be confused with stops. LMER results (Table 3) confirmed the relevance of TTCD in distinguishing fricatives from the other consonants, while also pointing to the role of TTCL in distinguishing laterals from stops and fricatives.
For KD, all three variables played a substantial role in manner classification, with TTCD showing the largest percentage of importance (43
$\%$
), followed by TTClength (36
$\%$
), and then TTCL (21
$\%$
). TTCD values above 0.08 cm (a wider constriction) distinguished fricatives from the other consonants, while TTCL above 135° (a more anterior constriction) and/or TTClength above 1.0 cm (a longer constriction) distinguished stops from nasals. The confusion matrix presented in Supplementary File S4 showed that laterals failed to get classified correctly, being almost exclusively confused with nasals. LMER results were significant for all three variables, with TTCD and TTClength playing a role in distinguishing fricatives, while TTCL distinguished sonorants and obstruents. The poorer performance in the classification of Manner, compared to Place, is not surprising, as the analysis was limited to the properties of the tongue tip/blade constriction, with no information available about the tongue shape or non-lingual articulators such as the jaw and the velum.
Table 3 A summary of statistical results for Manner: relative importance of constriction variables (rpart,
$\%$
, with main cut-off thresholds) and significant effects of Manner (LMER) and pairwise differences (LMER) for the speakers KMU and KD; ‘>’ means ‘greater than’; significant differences: *** = p < 0.001, ** p < 0.01, * < 0.05, n.s. = not significant, with the corresponding cells shaded; fric = fricative, nas = nasal, lat = lateral
3.1.1.3 Summary
In sum, the results provide evidence for the place contrast being consistently distinguished by our speakers by the tongue tip constriction location (TTCL) variable. Retroflexes, both with and without /ʂ/, were produced as considerably more posterior than dentals. The speakers varied, however, in their use of the other two variables to signal place: KMU produced retroflexes with a longer sagittal constriction (TTClength) compared to dentals, while KD’s retroflexes showed somewhat weaker closures (TTCD) than dentals (albeit significantly only when fricatives were included). The latter two differences can therefore be considered as individual strategies in the realization of the place contrast, which otherwise heavily relies on the anterior/posterior constriction location differences.
The results also showed that TTCL was used to distinguish manner differences as well. Both speakers, thus, produced laterals (or sonorants in general for KMU) of both places as more posterior to stops and fricatives. As would be expected, both speakers made use of tongue tip constriction degree (TTCD) to differentiate fricatives from the other consonants. KMU went further in distinguishing fricatives from non-fricatives by producing the former with a longer sagittal constriction (TTClength), that is as more laminal. Some of these place and manner differences reflected consonant-specific realizations in terms of apicality, laminality, or sublaminality of their constrictions, as well as their individual variation.
While stop, nasal, and lateral retroflexes were produced with the expected gesture – retraction and raising of the tongue tip, the phonemically retroflex fricative was not. Rather, it showed for both speakers a constriction (and tongue shape) more typical of alveolopalatals, produced with a raised and fronted tongue body and lowered tongue tip. Given this observation, we further compared instances of /ʂ/ produced by KMU and KD to these speakers’ alveolopalatal /ɕ/ (which was also collected as part of this study; see footnote 2). The comparison, made by overlaying contours for /ʂ/ and /ɕ/ for the five individual vowel contexts and for their averages (see Supplementary File S6), revealed no clear differences in constriction degrees or tongue shapes of these two consonants, for both speakers. Notably, both /ʂ/ and /ɕ/ were produced by one of the speakers (KMU) with a small sublingual cavity. Our examination of the acoustic recordings revealed no spectral differences in sibilant frication; KMU, however, produced some tokens of /ʂ/ (but not /ɕ/) with post-aspiration, presumably attempting to distinguish the two phonemes (see Supplementary File S6). This suggests the retroflex-alveolopalatal contrast in fricatives is (near-)merged in our Kannada speakers, and the outcome of this merger is likely to be alveolopalatal. Recall that the lack of contrast for these consonants has been previously noted as an idiolectal or dialectal feature (Schiffman Reference Schiffman1983; Sridhar Reference Sridhar1990).
3.2 Articulatory model components
3.2.1 Overview
In this section, we will turn our attention to the articulatory model components. As for the constriction parameters, we begin with an overview of general differences (yet across vowel contexts), followed by statistical analyses (rpart classification and LMER models) of the data by Place and Manner. The nine parameters deemed the most important at the end of Section 2.6 (TTF, TTH, TB, TD, HYH, JA, JH, VH, and LAH; see Section 2.6.1 and Appendix A1 for details) were used. Figure 5 presents radar plots for these parameters, separately by speaker. The first four images for each speaker focus on the place contrast in pairs of manner categories – stops, fricatives, nasals, and laterals. The last two images compare across manners within dentals and retroflexes.
Beginning with KMU (Figure 5a), we see that all retroflexes were produced with a less fronted tongue tip (TTF) than their dental counterparts, and that all non-fricative retroflexes were produced with a lesser tongue fronting towards the hard palate (TB). The stop and fricative pairs were also distinguished by the jaw advancement (JA; more retracted for the retroflex). The place among the nasal and lateral pairs was additionally distinguished by the tongue back raising/lowering towards or from the velum (TD; less raised for retroflexes), and the hyoid bone height (HYH; lowered for retroflexes). Further, the lateral retroflex was produced with a lowered larynx (LAH), and a less raised tongue tip (TTH). Among the fricatives, the (phonemically) retroflex /ʂ/ was characterized by a higher tongue tip (TTH) than /s̪/, and a slightly more raised tongue (TD).
Manner differences were distinguished by a wide range of components, and most evidently by the non-lingual parameters of VH (a lower velum for the nasals), JA (a more advanced jaw for the fricatives), and LAH (a lower laryngeal articulator for /ʈ/ and /ɭ/). Lingual differences mainly included sibilants: /s̪/ showed a lower TTH than the other dentals, while /ʂ/ showed higher TTF, TTH, TB, and TD compared to the other retroflexes (consistent with the alveolopalatal realization of the latter sound).
Now looking at KD’s results (Figure 5b), we see, as well, that all retroflexes were produced with lower TTF values than dentals. Non-fricative retroflexes were also produced with lower TB values, while the fricative /ʂ/ exhibited the opposite (as would be expected of an alveolopalatal). TTH showed different patterns for obstruents and sonorants: values were higher for retroflex stops and fricatives compared to their dental counterparts; the opposite held for nasals and especially laterals. The lateral and nasal retroflexes were also characterized by a lowered laryngeal articulator LAH.
As for KMU, manner differences for KD involved a wide range of non-lingual and lingual components. The former components included VH (a lower velum for nasals), JH and JA (a lower and more retracted jaw for laterals and a higher and more advanced one for obstruents), as well as HYH and LAH (a higher hyoid and larynx for obstruents). Among the lingual components, sibilants showed the highest values for TTF; /s̪/ had the highest TD, while /ʂ/ had the highest TTH and TB. Of interest is a small but consistent difference between stops and nasals in TD (a greater tongue back raising for stops), and a considerably higher TTH value for /l̪/ than the other dentals. These differences reflect the lesser tongue back raising for nasals compared to other consonants, as well as apicality for laterals.
Overall, these preliminary observations suggest that place and manner distinctions were implemented by our speakers using a wide number of articulatory components. Some of these were shared by the two speakers, whereas others appeared to reflect individual strategies, the motivation for some of which may not be immediately apparent. In the next two sections, we will examine relative importance and significance in contrasts involving Place and Manner.

Figure 5. Overlaid radar displays of most of the analysed articulatory parameters for the dental-retroflex contrasts and manner contrasts by speakers (a) KMU and (b) KD. Each radius corresponds to one articulatory parameter, indicated by its label: instead of in the traditional vertical plots, the values of the parameter varies along the radius, from the minimum on the inner polygon (corresponding to the extreme green contours on the nomograms, Figure 2) to zero on the intermediate polygon, to the maximum on the outer polygon (corresponding to the extreme red contours in the nomograms). The different points corresponding to a given phone are connected to form a coloured polygon in order to ease the comparisons and to see at once the main differences.
3.2.2 Analysis by Place
Table 4 presents a summary of statistical results for the full set of consonants in (a) and the set with fricatives excluded in (b). Figure 6 illustrates differences between the two places for lingual components. Starting with the full set for speaker KMU (Table 4a), we can see that the place contrast was most crucially distinguished by two lingual variables – TTF (41
$\%$
) and, to a lesser degree, TB (27
$\%$
; with a notable exception of the fricatives; see Figure 7). Retroflexes were characterized by TTF values of below 0.15 (a less fronted tongue tip) and TB values below -0.35 (a less fronted tongue body). These differences can be clearly seen in Figure 6. Among other variables used in the classification was the lingual component TD (5
$\%$
) (but not TTH), and several non-lingual components – JA (10
$\%$
), HYH (12
$\%$
), and LAH (5
$\%$
). Out of all these, only TTF, TB, TD, and JA showed significant differences in the LMER analysis, and hence only these variables can be considered as characteristic for this place. For non-fricative retroflexes, the tongue was somewhat lowered (TD of less than -0.95), and the jaw was somewhat retracted (JA less than -0.85) for retroflexes compared to dentals. The classification of consonants by place was accurate at 88
$\%$
, being at the maximum (100
$\%$
) for non-fricative retroflexes /ʈ, ɳ, ɭ/ and the lowest (60
$\%$
) for the dental lateral /l̪/.
Table 4 A summary of statistical results for Place: relative importance of constriction variables (rpart,
$\%$
, with cut-off thresholds) and significant effects of Place (LMER, with respective differences) for the speakers KMU and KD, based on (a) the full dataset and (b) the set without fricatives; ‘>’ means ‘greater than’; significant differences: *** = p < 0.001, ** p < 0.01, * < 0.05, n.s. = not significant, with the corresponding cells shaded; dent =dental, ret = retroflex
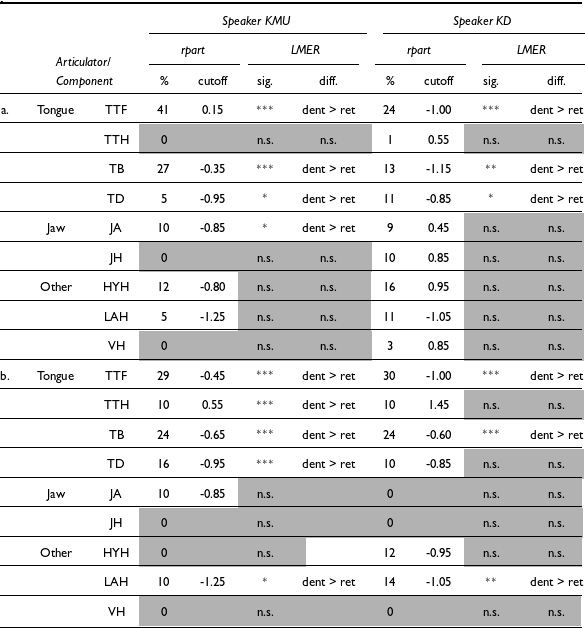

Figure 6. Boxplots for lingual parameters – TTF, TTH, TB, and TD – across five vowel contexts, separately by speaker; fric = fricative, nas = nasal, lat = lateral, dent =dental, ret = retroflex.
For speaker KD, we can see that all analysed components were used in the classification, at least to some extent. Among the top five most important components were TTF (24
$\%$
), HYH (16
$\%$
), TB (13
$\%$
), TD (11
$\%$
), and LAH (11
$\%$
). Out of these, however, only TTF, TB, and TD showed as significant in the LMER analysis. The analysis output showed that retroflexes were characterized by TTF values below -1.0 (a less fronted tongue tip), TB values below -1.15 (a more lowered tongue body), and TD values below -0.85 (a less raised tongue) (see Figure 6). The classification of consonants by place (see Supplementary File S4) was highly accurate, 95
$\%$
, with only /s̪/ showing confusions with the other place (60
$\%$
accuracy).
Turning now to the subset of consonants without fricatives, the results for KMU were largely similar to those for the full set. As in the previous analysis, TTF (29
$\%$
) and TB (24
$\%$
) were the two most important variables, and these were also identified as significant by the LMER analysis. Unlike in the previous analysis, TD became more important for the place classification (16
$\%$
vs. 5
$\%$
previously), and so did TTH and LAH (both increasing from 0
$\%$
to 10
$\%$
). These two variables also showed significant differences in the LMER analysis. Retroflexes were characterized by a lesser tongue tip raising towards the alveolar ridge (TTH of less than 0.55), and by a more lowered larynx (LAH of less than -1.25). The classification this time was highly accurate, 97
$\%$
, with only /ʈ/ giving a single confusion (80
$\%$
; see Supplementary File S4).
For KD, TTF (30
$\%$
) and TB (24
$\%$
) also remained the top two variables for the classification analysis. These two components were also identified by the LMER analysis as showing significant place differences. In addition, the analyses flagged LAH as a moderately important component (14
$\%$
) distinguishing place: retroflexes were produced with a more lowered larynx (LAH below -1.05) compared to dentals. The classification of consonants without fricatives yielded 100
$\%$
correct identification.
3.2.3 Analysis by Manner
Table 5 presents a summary of statistical results for Manner, while Figure 7 illustrates differences in manner for non-lingual components.
Table 5 A summary of statistical results for Manner: relative importance of constriction variables (rpart,
$\%$
, with cut-off thresholds) and significant effects of Manner (LMER) and pairwise differences (LMER) for the speakers KMY and KD; ‘>’ means ‘greater than’; significant differences: *** = p < 0.001, ** p < 0.01, * < 0.05, n.s. = not significant, with the corresponding cells shaded; fric = fricative, nas = nasal, lat = lateral
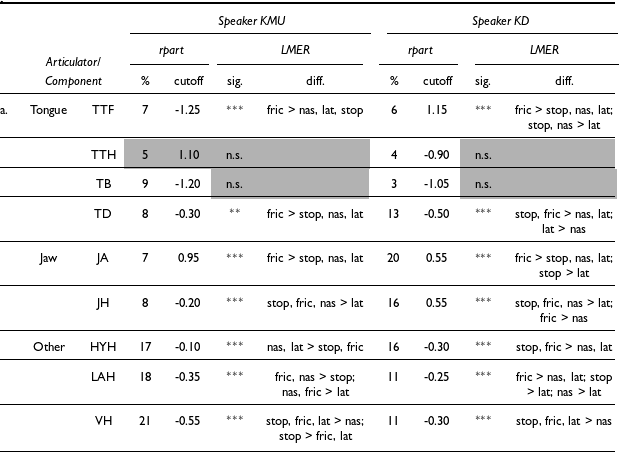

Figure 7. Boxplots for non-lingual components – JA, JH, HYH, LAH, and VH – across five vowel contexts, separately by speaker; fric = fricative, nas = nasal, lat = lateral, dent =dental, ret = retroflex.
For speaker KMU, all nine components were used in the classification analysis. Among them, VH (21
$\%$
), LAH (18
$\%$
), and HYH (17
$\%$
) were particularly important. VH values below -0.55 (a lowered velum) distinguished nasals from the other consonants, HYH values above -0.1 (a raised hyoid) distinguished laterals and nasals from obstruents, and LAH values below -0.35 (a lower larynx) distinguished stops from fricatives and nasals. These three variables were also shown to distinguish manner contrasts in the LMER analysis, although in a somewhat more fine-grained way. Significantly lower VH was observed not only for nasals, but also for fricatives and laterals compared to stops (see Figure 7). Lower LAH was observed not only for stops (compared to fricatives and nasals), but also for laterals (compared to the same two categories). Both laterals and nasals showed a higher HYH compared to stops. Other significant differences involved mainly fricatives (a greater tongue tip fronting (TTF), a more raised tongue (TD), and a more fronted jaw (JA), compared to the other manners). In addition, laterals were characterized by a lower jaw (JH). The classification accuracy of consonants by manner (see Supplementary File S4) was very high, 95
$\%$
, with only two errors involving the dentals /s̪/ and /l̪/ (both showing single confusions with stops).
As for KMU, all nine articulatory components were used in the manner classification for KD. The top three most important variables were JA (20
$\%$
), JH (16
$\%$
), and HYH (16
$\%$
). As seen in the LMER results summary, the jaw components distinguished laterals (a lower or more retracted jaw) and fricatives (a higher or more advanced jaw) – from the other two consonants. The hyoid position served to distinguish obstruents and sonorants (being higher for the former). Other notably relevant components in the classification included TD (13
$\%$
), LAH (11
$\%$
), and VH (11
$\%$
). The first one among these indicated that the tongue was higher (raised towards the velum) for obstruents and lower for sonorants, especially for laterals. The hyoid differences seem to be related to the larynx position, which was higher for obstruents than sonorants, and being the lowest for laterals. As expected, the velum was the lowest for the nasals. The relatively low importance of this variable in the classification analysis, however, can be attributed to a token of /ʈ/ (before /i/) inadvertently produced with a lowered velum (together with the small numbers of tokens used in the analysis). This is also evident in the confusion matrix presented in Supplementary File S4, where almost all nasals for KD were misclassified as laterals.
3.2.4 Summary
In sum, the results of our analysis of articulatory model components showed that both speakers consistently distinguished the place contrast across all manners by tongue tip fronting (TTF) and, to a lesser extent, by tongue fronting (TB) and tongue back raising (TD). Retroflexes as a whole (including /ʂ/), were produced with considerably lesser values for these three components. The components remained important once fricatives were excluded from the comparison, with the exception of TD for KMU. In the non-fricative set, both speakers also produced retroflexes with some larynx lowering (LAH). Additionally, KD distinguished non-fricative retroflexes from dentals by tongue tip height (TTH; lower for the former), and retroflex phonemes as a whole by jaw advancement (lesser for retroflexes). The finding of a lesser raising of the tongue towards the velum (lower TD) for retroflexes (as a class, and for non-fricatives by KMU) is partly unexpected. Recall that previous accounts have assumed retroflexes to show tongue ‘retraction’ (velarization or pharyngealization: Bhat Reference Bhat1974; Hamann Reference Hamann2003; Arsenault Reference Arsenault2008). This is clearly not the case in our data (at least based on the TD component), which is consistent with the previous ultrasound results for a larger group of Kannada speakers (Kochetov et al. Reference Kochetov, Sreedevi, Kasim and Manjula2014). Further, while our articulatory modelling did not incorporate the tongue root, no clear differences seem to exist between dentals and retroflexes in the relevant area (see e.g. Figure 3). On the other hand, some lowering of the larynx (based on LAH) was observed for retroflexes, which indicates that non-lingual articulators are also involved in the production of the contrast. Note also that we did not find any involvement of the lips in the articulation of retroflexes, contrary to previous findings of lip protrusion or rounding for retroflex fricatives in some languages (Ladefoged & Maddieson Reference Ladefoged and Maddieson1996; Flemming Reference Flemming2002; Hamann Reference Hamann2003; Lorenc et al. Reference Lorenc, Żygis and Mik2023). While the jaw was previously noted to distinguish retroflexes from other coronals (see Tabain Reference Tabain2012 on Arrernte), only the horizontal movement of this articulator was relevant in our data, and only for KMU’s full set. Hence, neither the tongue root nor the jaw position seem to clearly characterize Kannada retroflexes as produced by our speakers.
Table 6 A summary of predicted and observed phonetic characteristics for retroflex consonants, as opposed to their dental counterparts; obs. = observed
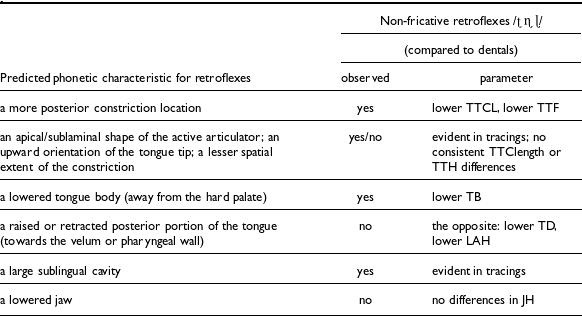
In contrast to place distinctions, both speakers employed jaw components to distinguish manner. Specifically, fricatives were produced with a greater jaw advancement (JA), while laterals were produced with a lower jaw height (JH) compared to the other consonants. Fricatives were also distinguished by both speakers by a greater tongue tip fronting (TTF), more tongue back raising (TD), a higher position of the larynx (LAH), relative to some of the other consonants (most consistently sonorants). Quite predictably, the speakers produced nasals with a lower velum. While both KMU and KD made use of the hyoid height (HYH) to distinguish manner, these differences were in the opposite directions – obstruents were produced with lower HYH values by KMU and with higher values by KD, relative to sonorants. The speakers’ results were also somewhat different in the relative importance assigned to various components. The more posterior components – HYH, LAH, and VH – were more important (based on the rpart classification) for KMU, compared to her lingual and jaw components. For KD, on the other hand, the jaw variables and HYH showed a relatively greater importance for manner contrasts. Overall, thus, the speakers showed considerable variation in distinguishing manner contrasts.
4 Discussion
The goal of this study was to provide a preliminary examination of a large set of articulatory variables distinguishing Kannada coronal place and manner contrasts. Our primary focus was on the dental-retroflex place. As reviewed in the Introduction, retroflexes were predicted to crucially differ from dentals in several articulatory characteristics. These predictions are summarized in Table 6, together with the key results of this study. Here we present only findings shared by the two speakers; we also exclude fricatives from the table, as the phonetically retroflex /ʂ/ was found to be consistently realized in our data as alveolopalatal.
Starting with the constriction location, the relative posteriority of retroflexes was clearly manifested in our data in the smaller angle of the tongue tip constriction location (TTCL) and reflected by the tongue tip retraction (TTF). However, it is worth noting that there was considerable cross-manner variation in our data: retroflex stops were produced at a less posterior place (postalveolar) compared to nasals and laterals (prepalatal or palatal). A similar difference was observed for dentals: the stops were produced at a more anterior location than nasals and laterals. These manner-specific differences in constrictions are consistent with Švarný & Zvelebil (Reference Švarný and Zvelebil1955)’s observations for other Dravidian languages. As noted earlier, the constrictions observed in this study are likely to be more extreme, hyper-articulated versions of respective sounds. Our conclusions about place differences should therefore be considered with caution.
In terms of the shape or orientation of the active articulator, the results for non-sibilants were rather inconclusive. This was because some of the dentals were produced as apical (/l̪/), rather than laminal, while some of the retroflexes were produced as sublaminal (/ɳ/ and /ɭ/), rather than apical. While apicals were characterized by shorter constrictions, both laminals and sublaminals exhibited relatively longer constrictions. Given this variation, the variables of TTClength and TTH could capture only some of the differences, and not necessarily in the expected direction.
The lowering of the tongue behind the constriction was consistently observed in our data for non-sibilant retroflexes (as manifested by the TB component). This suggests the tongue lowering to be a crucial characteristic of the consonant class (Hamann Reference Hamann2003; Arsenault Reference Arsenault2008).
Recall that both Hamann (Reference Hamann2003) and Arsenault (Reference Arsenault2008) predicted that the lowering of the tongue body/middle for retroflexes should be accompanied by ‘retraction’ – the raising of the posterior portion of the tongue towards the velum or backing it towards the pharyngeal wall (i.e. some degree of velarization or pharyngealization; cf. Bhat Reference Bhat1974; Gnanadesikan Reference Gnanadesikan and Conzalez1994). Our results do not support this view. In fact, the non-sibilant retroflexes were produced by our speakers with the opposite effect at least with respect to velarization – lowering of the tongue dorsum. While unexpected in the context of the above-mentioned generalizations, this result is consistent with previous findings from ultrasound investigations of Kannada retroflexes (Kochetov et al. Reference Kochetov, Sreedevi, Kasim and Manjula2014; Kochetov et al. Reference Kochetov, Tabain, Sreedevi and Beare2018), as well as from an X-ray study of retroflexes in Tamil (Švarný & Zvelebil Reference Švarný and Zvelebil1955). It seems thus that (at least some) Dravidian retroflexes are produced with a tongue lowering, and that this gesture possibly serves to stabilize the tongue, facilitating the characteristic flapping-out movement. It may well be, however, that retraction is characteristic of retroflexes in other Dravidian languages or other manners (e.g. Malayalam liquids; Scobbie et al. Reference Scobbie, Punnoose, Khattab, Spreafico and Vietti2013), or is dependent on other factors, such as lexical density (see Dutta et al. Reference Dutta, Redmon, Krishnaswamy, Calhoun, Escudero, Tabain and Warren2019 on coarticulation resistance in Malayalam coronal stops).
Recapping the results with Hamann (Reference Hamann2003)’s criteria for retroflexion, our results confirmed that our speakers’ non-fricative retroflexes showed apicality, posteriority, and sublingual cavity. The results however did not show evidence of retraction, suggesting that this property is optional, as earlier proposed by Bhat (Reference Bhat1974). The lack of evidence for retraction also questions most of the implicational relations proposed by Hamann (Reference Hamann2003) for retroflexes (p. 39), namely (b), (c), (d), and (e):
-
(a) posteriority → sublingual cavity
-
(b) apicality & posteriority → retraction, sublingual cavity
-
(c) posteriority & retraction → apicality, sublingual cavity
-
(d) sublingual cavity & retraction → apicality
-
(e) apicality & sublingual cavity → retraction
If any absolute implicational relations exist, based on our data they would have to be limited to combinations of apicality, posteriority, and sublingual cavity.
It should be mentioned that the full range of observations about the tongue shape and position could not be made using methods like EMA and ultrasound, given their either sparse spatial sampling or the lack of reflection of sound waves from complex surfaces. An important advantage of MRI as a method is that it allows us to observe the presence or absence of a sublingual cavity, one of the key characteristics of retroflex consonants (Hamann Reference Hamann2003). Our results showed that, indeed, the non-fricative retroflexes /ʈ ɳ ɭ/ were produced with such a cavity, which ranged in size from relatively small or moderate for the stop to moderate or large for the sonorants. The size of the cavity in these cases was dependent on the degree of the retraction of the tongue tip, and therefore predictable from either place or constriction shape features. It should furthermore be noted that the sibilant /ʂ/ was also produced with a moderate sublingual cavity, and that a small cavity was observed even for nasal and lateral dentals (see e.g. Figure 3). This suggests that the presence of a sublingual cavity is not unique to retroflexes, and that the relative size of the sublingual cavity (sufficient for lowering F3) might be a more appropriate generalization (cf. Keating Reference Keating, Paradis and Prunet1991).
Taken together, our results show that the non-sibilant retroflexes produced by our speakers were crucially distinguished from their dental counterparts by three main characteristics: (i) the retraction of the tongue tip making a posterior constriction, (ii) the lowering of the tongue behind the constriction resulting in the characteristic concave tongue shape, and (iii) the lack of the tongue body retraction. The other examined characteristics were either predictable from the gestures mentioned above, or were observed for only some of the dental-retroflex pairs. Note also that the first characteristic was shared by non-fricative retroflexes with /ʂ/ (which appears to have been at least partially merged by our speakers with /ɕ/), and thus seems to distinguish posterior coronals (retroflexes and alveolopalatals) from the anterior coronals (dentals). The characteristic (ii) may, therefore, be the one that distinguished prototypical retroflexes from both dentals and alveolopalatals.
Our finding of a near-merger of /ʂ/ and /ɕ/ is interesting, but not fully unexpected. As mentioned earlier, the lack of contrast for these consonants was previously noted as an idiolectal or dialectal feature. The result of this merger is [ɕ] according to Upadhyaya (Reference Upadhyaya1972; ‘in many spoken dialects’) and [ʂ] according to Sridhar (Reference Sridhar1990; ‘in informal speech’). Both possibilities are mentioned by Schiffman (Reference Schiffman1983, ‘except in very careful speech’), yet noted to depend on the dialect. The latter author also mentions the tendency for both posterior sibilants to merge with the anterior /s/, at least ‘in uneducated speech’. Apart from the articulatory complexity, the instability of the posterior fricatives in Kannada can be explained by their relatively low lexical frequency: both /ʂ/ and /ɕ/ occur almost exclusively in Sanskrit loans (Schiffman Reference Schiffman1983). Recall, however, that retroflex fricatives as a class tend to pattern differently from other retroflex consonants, showing considerable variability in tongue shapes and frequent untypical realizations (Flemming Reference Flemming2002; Lorenc et al. Reference Lorenc, Żygis and Mik2023; see Section 1.1.6). Further research, therefore, is needed to conclusively determine the status of retroflex fricatives in Kannada.
Although limited to data from two speakers, our findings for the dental-retroflex contrast are broadly consistent with EMA and ultrasound results obtained from ten Kannada speakers by Kochetov et al. (Reference Kochetov, Sreedevi, Kasim and Manjula2014) and Kochetov & Sreedevi (Reference Kochetov, Sreedevi, Fuchs, Grice, Hermes, Lancia and Mücke2014).Footnote 9 This can be seen in Figure 8, where sample ultrasound contours for a representative Kannada speaker are compared to MRI tracings from one of our speakers. It is evident in (a), for example, that the front portion of the tongue is similarly raised and retracted for the retroflexes compared to dentals in both ultrasound and MRI images. The back portions of the tongue, on the other hand, are relatively similar for the two places in both kinds of data (with a somewhat more front position for retroflexes in some cases). These place differences are also evident, yet somewhat modified depending on the vowel contexts in (b).

Figure 8. A comparison of sample average ultrasound tongue contours adapted from Kochetov et al. (Reference Kochetov, Tabain, Sreedevi and Beare2018) and Kochetov & Sreedevi (Reference Kochetov, Sreedevi, Fuchs, Grice, Hermes, Lancia and Mücke2014) and corresponding MRI tracings (KD) from the current study: the dental-retroflex contrast (a) by manner (/t̪/ vs. /ʈ/, /n̪/ vs. /ɳ/) in the /a/ context, and (b) by vowel context for stops.
Overall, this confirms that our results, while being limited to two speakers, are broadly in line with previous observations obtained using other methods. These comparisons also show a clear advantage of the MRI method in providing important information about some of the key properties of the retroflex consonants, namely the curling of the tongue tip, the lack of the tongue retraction, and the sublingual cavity. At the same time, these comparisons are indicative of some limitations of the static MRI, which tends to provide somewhat extreme, hyper-articulated versions of the sounds. Future research should aim to combine various articulatory methods to further investigate Kannada coronal contrasts using a larger sample of speakers.
5 Concluding remarks
As mentioned in the Introduction, the use of articulatory methodologies has been important for increasing phonetic documentation of languages, better understanding the cross-linguistic typology of sound patterns, and developing phonological theories. While much progress has been done, the bulk of existing articulatory work has examined a relatively small number of genetically related and geographically clustered languages. Questions remain as to whether previous empirical findings and theoretical generalizations reflect the variation observed in world languages. This study is part of a growing effort to provide extensive articulatory documentation of sound patterns of less studied – and typologically unusual – languages. Our examination of dental and retroflex consonants produced by two speakers of Kannada helped us explore articulatory details of the implementation of this phonemic contrast, considerably expanding on previous phonetic descriptions of the language. The results of our articulatory modelling allowed us to capture most of the observed variation using a small set of components. We found that the tongue tip fronting/backing and the tongue body raising/lowering components were the key parameters defining the contrast, while also supplemented by manner-specific and individual strategies involving lingual and non-lingual articulators.
Further, we observed contributions of various articulators and organs to the production of manner contrasts. Many of these observations would not have been possible using more mainstream methods such as EMA and ultrasound. The use of MRI is therefore fully appropriate for studying detailed place and manner differences in complex consonant inventories. Moreover, our study made important methodological enhancements, which can be further developed and extended to articulatory studies of other languages. Given some obvious limitations of this study, its findings and generalizations for Kannada and coronal contrasts should be further validated using real-time MRI data collected from a larger sample of speakers.
Acknowledgements
The authors thank John Esling for his help with the description of the laryngeal region, terminology and picture suggestion. They also thank N. Sreedevi for advice on the preparation of the word list, Hardik Doshi for assistance with recruiting the participants, Paul Arsenault for a discussion of phonological characterizations of coronals, Moses Yoo for his ‘spider_plot.m’ Matlab® script for radar displays, and Silvain Gerber for his advice on the implementation of LMER models. Further, the authors are extremely indebted to the two Kannada speakers, Kshama Muralidhar and Kavana Dayananda. They finally thank James Kirby, Marija Tabain, Marzena Żygis, and several reviewers for providing useful and pertinent advice on earlier versions of this work. The research was partly funded by an Insight Grant from Social Sciences and Humanities Research Council of Canada (#435-2015-2013) to Alexei Kochetov. The MRI facilities centre IRMaGe in Grenoble, France, was partly funded by the grant ‘Infrastructure d’avenir en Biologie Santé - ANR-11-INBS-0006’ from the French ANR (Agence Nationale de la Recherche).
Supplementary material
To view supplementary material for this article, please visit https://doi.org/10.1017/S0025100323000221
Supplementary Files
The submission includes the following Supplementary Files:
-
S1. Acoustic validation of MRI recordings
-
S2. MRI images overlaid with contours
-
S3. Tongue constriction location plots for the five vowel contexts
-
S4. Results of LMER models and rpart classification matrices
-
S5. Spreadsheet with articulatory parameter values used in the LME analyses
-
S6. Comparisons of retroflex and alveopalatals sibilants
Appendix
Table A1 Abbreviations for articulatory parameters
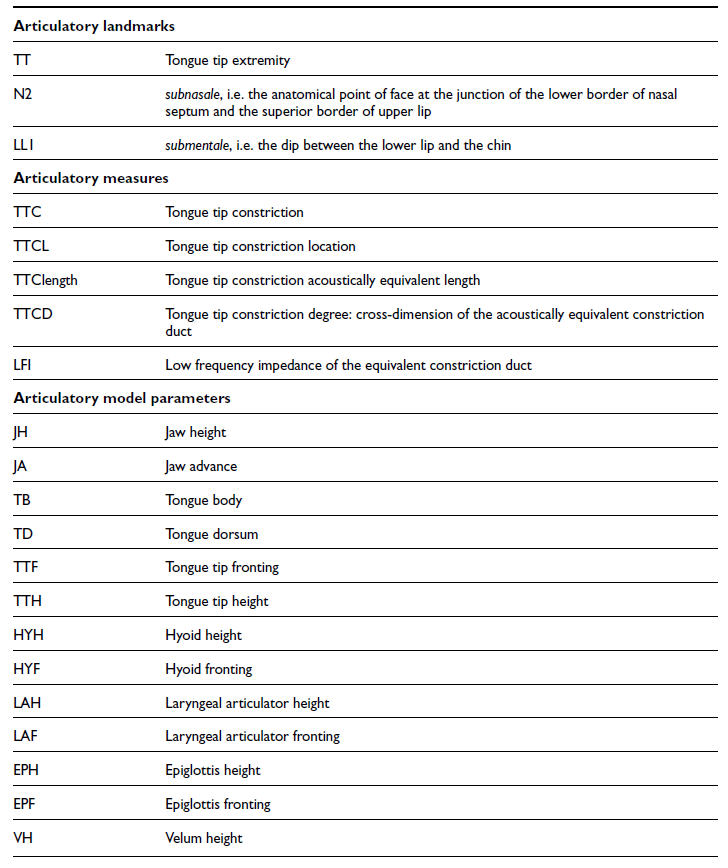


 Open access