


Agriculture today faces numerous challenges including climate change, decreasing acreage of arable land, fresh water supply concerns, and population growth (Benke and Tomkins, Reference Benke and Tomkins2017; Fedoroff, Reference Fedoroff2015). One potential solution to the issue of decreasing acreage of land suitable for growing crops is controlled environment agriculture (CEA). According to the 2017 Census of Agriculture, there was approximately 900 million square feet of greenhouse area in the United States producing specialty crops (United States Department of Agriculture, 2019). CEA allows for highly efficient production (e.g., reduced fossil fuel and chemical usage as well as greater immunity to pests and droughts), increased yields, and year-round production of plants and food in rural, suburban, and metropolitan areas (Benke and Tomkins, Reference Benke and Tomkins2017; Engler and Krarti, Reference Engler and Krarti2021; Goodman and Minner, Reference Goodman and Minner2019). CEA also has other advantages including temperature, humidity, and lighting control. However, like most agricultural ventures, CEA has its own unique set of externalities to consider when planning, investing, operating, and regulating. This paper focuses on the attitudes and regulatory preferences regarding externalities associated with supplemental lighting used in CEA.
Supplemental lighting allows CEA of ornamental and edible plants to potentially increase their profitability by shortening the growing cycle of their product (Both, Reference Both2004). Shortened growing cycles lead to more production each year, which can potentially lead to increased profits. Supplemental lighting also allows producers to keep their growing cycles on schedule during unexpected weather patterns. Additionally, supplemental lighting lets growers cultivate plants year-round regardless of location and species, providing unique production and marketing opportunities for enhanced profit. There are different types of supplemental lighting systems available to greenhouse growers including light-emitting diodes (LEDs) and high-pressure sodium (HPS) lighting systems. This paper focuses specifically on externalities associated with LED lighting systems, of which 10–20% of greenhouse square footage uses some form of supplemental lighting in the northern U.S. alone (Torres and Lopez, Reference Torres and Lopezn.d.).
The usefulness of LED lighting for use in CEA was first researched in the late 1980s and early 1990s (Morrow, Reference Morrow2008). LED lighting systems have grown in popularity in recent years possibly due to characteristics such as efficiency and low maintenance cost, which make them more cost-effective supplemental lighting solutions than HPS systems in certain production enterprises (Nelson and Bugbee, Reference Nelson and Bugbee2014). LEDs are energy efficient in two ways. First, LEDs are energy efficient in running the lights and using the diodes themselves. Second, LEDs do not produce as much heat resulting in lower energy inputs needed for temperature control of greenhouses (Mitchell et al., Reference Mitchell, Both, Bourget and Burr2012). Kowalczyk et al. (Reference Kowalczyk, Olewnicki, Mirgos and Gajc-Wolska2020) compared efficiency of LED and HPS supplemental assimilation lighting in greenhouse cucumber production and found LED lighting systems to be more energy efficient with higher production value and gross margins in 2015 and 2016. In the long run, LEDs allow for the reduction of production costs of vegetables compared to traditional lighting systems, such as HPS systems, due to these beneficial characteristics (Singh et al., Reference Singh, Basu, Meinhardt-Wollweber and Roth2015).
LEDs are versatile compared to other lighting systems and provide opportunities for highly specialized production. Due to their low heat output, LEDs can be placed closer to plants even at high light intensities (Olle and Viršile, Reference Olle and Viršile2013). LED systems also give the grower a unique level of control over plant morphology and reproductive cycles using different spectrums of light unavailable to other lighting systems (Massa et al., Reference Massa, Kim, Wheeler and Mitchell2008). Blue light has been shown to increase concentrations of nutritionally important primary and secondary metabolites in certain specialty vegetable crops (Kopsell et al., Reference Kopsell, Sams and Morrow2015). Choi, Moon, and Kang (Reference Choi, Moon and Kang2015) evaluated effects of different LED lighting colors in two different CEA facilities on strawberry yield and quality. Due to the variability, adaptability, and efficiency of LED lighting, greenhouse producers can incorporate sophisticated supplemental lighting programs suited to their production needs while also reducing long-term costs. As studies continue to surface exploring the exact effects of different lighting programs on edible plant growth (Li and Kubota, Reference Li and Kubota2009; Lin et al., Reference Lin, Huang, Huang, Hsu, Yang and Yang2013), it is likely that the industry will see increases in greenhouse producers adopting LED lighting systems to reduce costs, improve quality, and increase profits.
LED lighting in CEA presents a variety of possible negative externalities, especially when used during nighttime hours. Approximately 83% of the world’s population and 99% of the population of Europe and the United States already experience some level of light pollution (Falchi et al., Reference Falchi, Cinzano, Duriscoe, Kyba, Elvidge, Baugh, Portnoy, Rybnikova and Furgoni2016). Shiftwork causing exposure to artificial light outside normal daylight hours has been linked to an increased risk of cancer due to disruption of the circadian cycle of hormone production in humans (Hansen and Stevens, Reference Hansen and Stevens2012). Humans are not the only organisms affected by light pollution. Artificial lighting at night (ALAN) is a large source of concern for biological rhythms and reproductive health of bird populations (Dominoni, Quetting, and Partecke, Reference Dominoni, Quetting and Partecke2013; Dominoni, Reference Dominoni2015).
As noted by Campbell, Rabinowitz, and Campbell (Reference Campbell, Rabinowitz and Campbell2020), for many negative externalities impacting overall safety, air, water, and the environment, there are only a small percentage of people on the extremes of an issue, notably people really opposed to the externality and people that are extremely unconcerned. For instance, for hemp production, around 46% of respondents had some concern level associated with hemp production negatively impacting the environment with only 19% extremely concerned (Campbell, Rabinowitz, and Campbell, Reference Campbell, Rabinowitz and Campbell2020). The growing concern around light pollution is highlighted by other groups, such as lighting experts and lighting professionals (Schulte-Römer et al., Reference Schulte-Römer, Meier, Dannemann and Söding2019), and is similar to concerns for water pollution (Tosun, Schaub, and Fleig, Reference Tosun, Schaub and Fleig2020) and air pollution (Welsch, Reference Welsch2006).
These concerns have led to governmental entities stepping in the limit exposure to the external externality. In 2019, a resident of Peach County, Georgia filed a lawsuit against the Canadian vegetable company Pure Flavor due to ALAN from their large greenhouse located near county residents (Burse, Reference Burse2019). This Georgia lawsuit is not a lone incident as cities begin to regulate light pollution coming from greenhouses. As of April 1, 2021, Canada already has fines in place for producers who use supplemental lighting at night without blackout curtains (Greenhouse Canada, 2020). In order to limit light pollution, retrofitting greenhouses with blackout curtains can help but blackout curtains can be extremely costly. If consumers in the United States respond negatively to supplemental lighting, it may be beneficial for producers to incorporate blackout curtains into their start-up costs to avoid costly retrofitting in the future or avoid investing in enterprises requiring supplemental lighting near established residents.Footnote 1
This research evaluates consumer attitudes regarding LED lighting for CEA and whether it should be regulated. Unique to this study, survey respondents are subjected to an information treatment in order to understand how media coverage might impact attitudes toward greenhouse lighting. The results of this study suggest that older generations and individuals unaware of their location to the nearest greenhouse are more likely to want regulation of supplemental LED lighting when exposed to media images of light pollution from those sources. Individuals with higher initial perceptions of LED safety were less likely to want regulation after seeing the images of light pollution from LED supplemental lighting. Overall, the results of this study suggest that most individuals want more regulation after seeing pictures of LED light pollution, except for those individuals with strong initial anti-regulation preferences. The most popular candidate for regulation seems to be the state government, while the federal government is the least popular candidate.
Data and Methods
Survey
Data were collected through a nationally representative online survey conducted in January 2021. Respondents, 18 years and older, were sampled from the online database of Toluna, Inc. Toluna contacted qualifying respondents via email to invite them to participate in the survey. After accepting the invitation to participate, participants were directed to the survey. Toluna offers survey respondents points that may be redeemed for products or services through their platform. A total of 3,590 respondents completed the entire survey, which represents a 68% completion rate. For some of the questions (e.g., color of lighting, regulation perception, etc.), the number of observations reported is higher than 3,590 (e.g., color of lighting has 3,973 respondents included) as a respondent skipped a demographic question. With respect to the online survey, potential biases may exist due to the nature of online surveys. Selection bias may occur if participants are not selected randomly in terms of their opinions or preconceived notions regarding supplemental lighting in CEA. To combat selection bias, Toluna uses a random selection process with checks in place to ensure a representative sample of the United States is procured. To further mitigate selection bias, Toluna invites respondents to participate before they are made aware of the key topics and questions present in the survey. Another potential bias that could influence results is response bias. To combat response bias, concise language and a myriad of question types are provided. For example, some answers allow for the use of 0 to 100 scales, while other questions ask “regulate” and “do not regulate” for questions concerning respondents’ regulation preferences. Furthermore, question checks are included throughout the survey (i.e., choose answer “C”) to assess whether respondents are reading the questions.
Demographic questions were included in the survey to assess the respondent’s age, education, gender, household income, and other characteristics (Table 1). Additionally, questions concerning beliefs about the safety of LED lighting, initial regulation preferences, and the distance the respondent lives from a greenhouse were asked.Footnote 2 With respect to demographics, the sample is representative of several national demographic characteristics including race, age, and household income as well as regional dispersion of the sample. The median household income of the sample is $62,500 compared to the United States Census Bureau’s 2019 estimate of $62,843 (United States Census Bureau, 2021). The median age of our sample is 42, while the United States Census Bureau’s 2019 median age estimate is 38.3 (United States Census Bureau, 2020). The difference in medians can be explained by the targeting of the survey toward individuals 18 years or older. Respondents were classified into generations based on the year of birth. The “older” generation is made up of those born in 1964 or earlier; Gen X is composed of those born between 1965 and 1984; and the “younger” generation is made up of those born in 1985 or after. Around 30% of respondents are in the older generation and Gen X, while the remainder is in the younger generation. In our sample, race consisted of 82% Caucasian, 9% African American, and 9% other race, which is close to the census estimates of 76% white, 13% black or African American, and 11% other race (United States Census Bureau, 2021). For regions, Bureau of Economic Analysis definitions (Abadi, Reference Abadi2018) were used to classify respondents into a region. Regions were defined as Far West (14% of sample vs. 17% census estimate), Rocky Mountains (3% vs. 4%), Southwest (11% vs. 13%), Plains (5% vs. 7%), Great Lakes (15% vs. 14%), Mideast (19% vs. 15%), New England (5% vs. 5%), and Southeast (28% vs. 26%).
Table 1. Descriptive statistics of survey respondents’ demographics

a Median age from United States Census Bureau (2020); all other census estimates from United States Census Bureau (2021).
b States are divided into regions using the definitions of the Bureau of Economic Analysis (Abadi, Reference Abadi2018).
c Older—born in 1964 or earlier, Gen X—born between 1965 and 1984, Younger—born in 1985 or after.
The survey asked several questions regarding the respondents’ knowledge and opinions of supplemental lighting systems and LED lighting, such as “Have you ever heard of the following types of supplemental lighting systems used in greenhouses?” Participants marked yes or no for LED, HPS, and other. The survey also asked, “Do you know how the nearest greenhouse to you provides light to its crops?” Participants were given five choices including sunlight, LED lighting, HPS lighting, other, and “I do not know.” Respondents were asked about their concerns regarding the safety of LED lighting as well as different colors of LED lighting, and how they felt about operations using supplemental lighting in food production. Respondents were presented with “Do you think growing plants with LED lights is…” and selected a number from 0 (not safe) to 100 (extremely safe) for the following types of settings: “safe for plants?,” “safe for humans during production?,” “safe for humans when consuming produce grown using LED lights?,” “safe for humans planting plants grown using LED lights?,” and “safe for animals living around the greenhouse?” Participants selected a number from 0 (extremely unconcerned) to 100 (extremely concerned) for red, blue, white, yellow, orange, and other LED light colors to answer the question “LED lights come in different colors, how concerned would you be about living near a greenhouse producer that uses the following colors of lights?”
The focus of this paper is the effect of a treatment in the form of negative media stories about light pollution. The survey respondents were asked to look at four pictures of light pollution emitted by greenhouses. No additional information was provided. Figure 1 presents this treatment. These pictures came from popular press articles about LED light pollution created by greenhouses. To assess the treatment effect, respondents were asked about their preferences for LED regulation and what entities should be responsible for such regulation before and after the treatment.

Figure 1. Informational treatment showcasing various images portrayed in media outlets. Pictures from Georgieva (Reference Georgieva2018) and Ouriel (Reference Ouriel2019).
The following questions were asked in a series of questions before and after viewing the information treatment. Questions included: “How do you feel about greenhouse operations using supplemental lighting in their production?” on a scale of 0 (should never be allowed) to 100 (should always be allowed); “Should there be regulations on using supplemental lighting technologies for growing plants for food (e.g., tomatoes, cucumbers etc.) in greenhouses?” with available responses were “do not regulate,” “regulate less,” “regulate the same amount” “regulate more,” and “I do not know”; “Who should be responsible for regulating supplemental lighting technologies for growing plants for food (e.g., tomatoes, cucumbers, etc.) in greenhouses?” with response options being “city/municipal government,” “county government,” “state government,” and “federal government.”Footnote 3 These entities were included as they are the primary regulators of production practices in the greenhouse industry. For instance, county (Burse, Reference Burse2019) and federal (Greenhouse Canada, 2020) governments sued to limit supplemental lighting and its associated light pollution. However, as noted by Campbell et al. (Reference Campbell, Khachatryan and Rihn2017), the federal government is either trusted or not trusted as a source of environmental information. Given the perception associated with these governmental entities and their passing of regulations to prevent (Ouriel, Reference Ouriel2019) or sue to prevent supplemental light pollution, we included these entities.
Tobit Model
The central focus of this paper is to evaluate the impact of the information treatment effect on respondent’s attitudes concerning greenhouse operations using LED lighting in food production. To assess the treatment effect on the change in attitudes, a Tobit model is used. The dependent variable is the respondent’s attitudes toward regulation of greenhouse operations using supplemental lighting in their production. This answer is given on a scale of 0 (should never be allowed) to 100 (should always be allowed). This variable is censored at two extremes, 0 and 100. Ordinary least squares (OLS) estimation results in biased and inconsistent parameter estimates due to this censoring. The two-limit Tobit model developed by Rosett and Nelson (Reference Rosett and Nelson1975) is used to account for censoring of the data. The model can be represented as:
 $$y_i^* = \beta '{x_i} + {\varepsilon _i}\left( {i = 1, \ldots ,n} \right)$$
 $${y_i} = \left\{ {\matrix{ 0 \hfill & {if\;\hskip 1pt y_i^* \le 0} \hfill \cr {y_i^*} \hfill & {if\;0 \lt y_i^* \lt 100\;\left( {i = 1,...,n} \right)} \hfill \cr {100} \hfill & {if\;y_i^* \ge 100} \hfill \cr } } \right.$$
where y i * is a latent variable that is not observed for values below 0 and above 100, x is a matrix of explanatory variables, β is a vector of coefficients, and ϵ i is an independently and normally distributed error term with zero mean and variance σ 2. We can maximize the likelihood function in the following equation to obtain coefficient estimates as noted by Davidson and McKinnon (Reference Davidson and MacKinnon1993).
 $$\matrix{ {\sum\limits_{y_t^L \le y_t^* \le y_t^U} {\log } \left\{ {{1 \over \sigma }\emptyset \left[ {{1 \over \sigma }\left( {{y_t} - {x_t}\beta } \right)} \right]} \right\} + \sum\limits_{y_t^* \le y_t^L} {\log } \left\{ {\emptyset \left[ {{1 \over \sigma }\left( {y_t^L - {x_t}\beta } \right)} \right]} \right\}} \hfill \cr
{\quad + \sum\limits_{y_t^* \le y_t^L} {\log } \left\{ {\emptyset \left[ { - {1 \over \sigma }\left( {y_t^U - {x_t}\beta } \right)} \right]} \right\}} \hfill \cr } $$
$$\matrix{ {\sum\limits_{y_t^L \le y_t^* \le y_t^U} {\log } \left\{ {{1 \over \sigma }\emptyset \left[ {{1 \over \sigma }\left( {{y_t} - {x_t}\beta } \right)} \right]} \right\} + \sum\limits_{y_t^* \le y_t^L} {\log } \left\{ {\emptyset \left[ {{1 \over \sigma }\left( {y_t^L - {x_t}\beta } \right)} \right]} \right\}} \hfill \cr
{\quad + \sum\limits_{y_t^* \le y_t^L} {\log } \left\{ {\emptyset \left[ { - {1 \over \sigma }\left( {y_t^U - {x_t}\beta } \right)} \right]} \right\}} \hfill \cr } $$
However, the estimated coefficients (β) are not interpreted in the same manner as OLS estimates (the ceteris paribus effect of a one-unit change in our independent variable on the dependent variable) (Gould et al., Reference Gould1989). An extension of the McDonald and Moffitt decomposition for two-limit censoring to obtain the unconditional and conditional marginal effects and the corresponding probabilities of being uncensored (McDonald and Moffitt, Reference McDonald and Moffitt1980) is used. Unconditional marginal effects account for individuals with preferences outside of the bounds constructed by the survey. In our data, it is difficult to imagine a logical realization of preferences below 0 (should never be allowed) or above 100 (should always be allowed) to indicate the respondent’s preference regarding the use of LED lighting in food production. Therefore, conditional marginal effects from the two-limit Tobit model are reported.
To assess regulation preferences, a series of tables are presented to show how respondents’ preferences for regulation as well as regulating entities changed after the treatment effect. A table is presented showing the percent of respondents choosing every combination of initial and posttreatment preferences. A series of change tables are also presented that show changes in preferences for regulating entities based on respondents’ regulation preferences before and after treatment. These tables allow for a unique analysis of not only changes in total percent of respondents choosing each level of regulation before and after treatment but also how the posttreatment movement in regulation preferences relate to changes in preferences of regulating entities after treatment. Organizing the data in such a way gives us insights into the relationship between changes in an individual’s regulation preferences and their preferences for regulating entities.
Results and Discussion
General Lighting Results
LED lighting systems had been heard of by 66% of respondents (Table 2); however, 57% of survey participants did not know how the nearest greenhouse to them provided light to its crops. Overall, respondents felt that LED lighting systems were slightly safer than “somewhat safe.” The highest mean answer concerning safety of LEDs was for plants (68%), and lowest was for animals living near the greenhouse using LEDs (63%) (Table 3). Survey participants were not concerned about living near a greenhouse producer using any one color of light (Table 3). The highest mean level of concern was 53% for red LED lights. The lowest mean level of concern was 50% for white LED lights. Furthermore, respondents tended toward allowing the use of supplemental LED lighting for food production with an average response of 64 on a 100-point scale (Table 3). Of interest, white lamp LED lights with blue emissions have been shown to be more light polluting than other supplemental light types and colors (Falchi et al., Reference Falchi, Cinzano, Elvidge, Keith and Haim2011).
Table 2. Percent of respondents who had heard of supplemental lighting systems
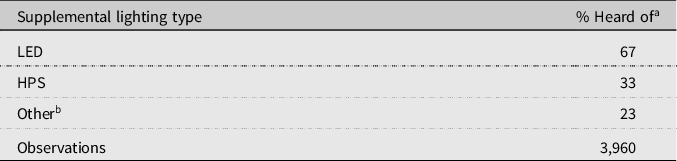
a Each of the percentages is significantly differentiated from each other using a λ2 test.
b “Other” was given as a final alternative that respondents may choose. It was not defined in the survey. Other lighting greenhouses may use fluorescent bulbs, incandescent bulbs, halide lamps, etc.
Table 3. Perceptions, concerns, and regulatory attitude regarding LED lights used in greenhouses
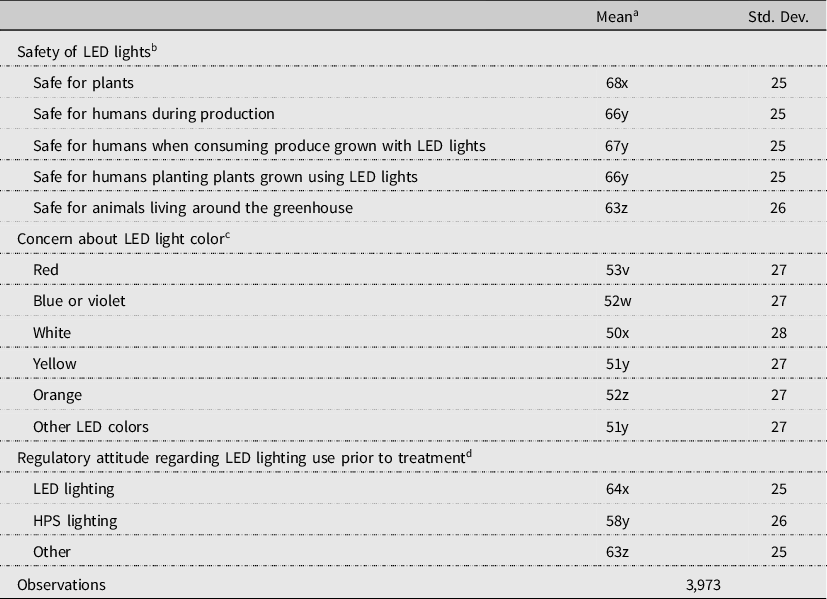
a A t-test was used to compare mean ratings within category (i.e. all “Safety of LED lights choices were compared against each other”). The same letter indicates no significant difference between two choice means at the 0.10 level, while different letters signify two choice means were statistically different from each other at the 0.10 level.
b A response of 0 indicates “not safe,” while a response of 100 indicates “extremely safe.”
c A response of 0 indicates “extremely unconcerned,” while a response of 100 indicates “extremely concerned.”
d An answer of 0 indicates “should never be allowed,” while an answer of 100 indicates “should always be allowed.”
Tobit Model Results
The conditional average marginal effects from the Tobit model are presented in Table 4.Footnote 4 The unconditional effects and probabilities add little insight into the focus of our study and are, therefore, not provided. Gen X and younger generations preferred less regulation after treatment relative to older generations. This could be due to the nature of younger generation’s more frequent exposure to LED lighting and light from technology in general. Male survey participants selected 4.64 points higher on the 0–100 scale on average compared to females. Having one or more kids in the households also results in preferences for less regulation. A $10,000 increase in household income yields an increase of 0.175 points on the 0–100 scale on average.
Table 4. Average conditional marginal effects of personal characteristics on posttreatment attitudes to LED regulation

Notes: ***p < 0.01, **p < 0.05, *p < 0.1. Standard errors are in parentheses.
a Base categories: Regions = Far West, Generation = Older than Gen X, Race = White, Political affiliation = Democrat, Education = Bachelor’s, Urbanicity = Metropolitan, Distance to nearest greenhouse = less than or 5 miles.
b The marginal effect for household income represents a change given a $10,000 increase in income.
Metropolitan participants were more likely to prefer less regulation. Perhaps this is related to their more frequent exposure to ALAN than their suburban and rural counterparts. Metropolitan respondents may not find the marginal, additional light pollution from greenhouse lighting problematic as they are already experiencing relatively high levels of ALAN. In contrast, suburban and rural respondents that may see very little ALAN appear to find greenhouse lighting less acceptable. Therefore, their attitude toward allowing greenhouse lighting is less favorable. This conjecture is consistent with the generational discussion earlier that more exposure leads to a preference for less regulation.
Interestingly, participants that did not know the distance from their primary residence to the nearest greenhouse were most likely to prefer more regulation after treatment than individuals that live 5 miles or closer to the nearest greenhouse. The increase in the desire for regulation from not knowing the distance to the nearest greenhouse might be explained by lack of awareness regarding agriculture or greenhouse technology or strong attitudes regarding light pollution (or both). Not surprisingly, individuals with higher perceptions of LED safety were less likely to prefer more regulation after treatment.
On average, the addition of one point on the 0–100 scale in the respondent’s pretreatment attitude toward regulation of LED lighting results in a 0.225 increase in their posttreatment attitude toward regulation of LED lighting. This suggests that the initial attitude to LED regulation plays a role in the posttreatment LED regulation attitude. However, the effect is not necessarily large compared to other factors. For example, perceptions of LED safety (also on a 0–100 scale) have a much larger effect of 0.393. Additionally, this provides evidence that initial regulation preferences may play a role in determining posttreatment regulation preferences in other questions.
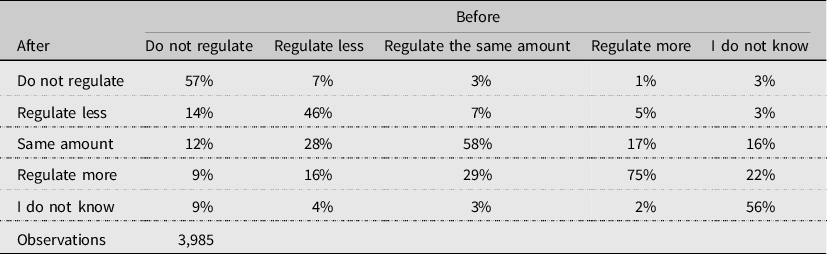
Pre and Posttreatment Regulation Preferences
Table 5 presents respondents’ regulation preferences before and after information treatment. Prior to treatment, 8% of respondents believed supplemental lighting technologies for food should not be regulated, while 21% of respondents selected “I do not know.” The most popular regulation preference prior to treatment was “regulate the same amount,” capturing 36% of respondents. After treatment, the most popular regulation preference switched to “regulate more.” After treatment, 36% of respondents chose “regulate more.” “Regulate the same amount” and “I do not know” lost a significant percentage of respondents compared to pretreatment (4% and 7% of respondents, respectively).
Table 5. Preferences for regulation of supplemental lighting in food production before and after information treatment

Statistical test using a proportional λ2 test where significance is defined as *0.1 or less, **0.05 or less, and ***0.01 or less.
Table 6 breaks down the changes in respondents’ regulatory preference amount based on their answers regarding regulation before and after treatment. In every regulation category except for “regulate less,” most respondents maintained their original answer after treatment. The percentage of individuals switching to “regulate more” outweighs the percentage of individuals switching to “do not regulate” and “regulate less” in every category except for individuals that initially preferred “do not regulate.” Similarly, “regulate more” is a more popular answer to switch to than “I do not know” among respondents not initially selecting “do not regulate” and “I do not know.” Twenty-eight percent of participants choosing “regulate less” prior to treatment chose “regulate the same amount” after treatment. Sixteen percent of participants choosing “regulate less” pretreatment chose “regulate more” after treatment. Twenty-nine percent of participants choosing “regulate the same amount” before treatment chose “regulate more” after treatment. Sixteen percent and 22% of individuals choosing “I do not know” prior to treatment chose “regulate the same amount” and “regulate more” after treatment, respectively.
Table 6. Percent of respondents by regulation preferences before and after treatment
Regulator Preferences
Table 7 shows the results for regulator preferences before and after the information treatment. Participants were allowed to select more than one regulator, so these percentages sum to more than 100%. The popularity of all four regulators (city/municipal, county, state, and federal) increased slightly, with state remaining the most popular candidate followed by county government. Most respondents (54%) believed that state government should be responsible for regulating supplemental lighting technologies for growing food. The county and federal governments were the only government entities to have a significant increase in the percent of total respondents selecting it as a potential regulator.
Table 7. Preferences for regulators of supplemental lighting in food production before and after information treatment

Note: Respondents were able to choose more than one entity.
Statistical test using a proportional λ2 test where significance is defined as *0.1 or less, **0.05 or less, and ***0.01 or less.
Tables 8–12 are the change tables discussed in the last paragraph of the methods section. Table 8 shows changes in regulator preferences for individuals who preferred no regulation prior to treatment.Footnote 5 Respondents that prefer no regulation prior to treatment are unlikely to prefer federal regulation after treatment, especially those that choose “I do not know” after treatment. The most popular posttreatment regulator in Table 8 is state government, except for individuals selecting “I do not know” after treatment. Individuals selecting “I do not know” after treatment tend to prefer city (38%) and county regulation (48%).
Table 8. Respondents that preferred no regulation before treatment

Table 9 shows changes in regulator preferences for individuals who preferred less regulation prior to treatment. Individuals changing regulation preference from “regulate less” prior to treatment to “regulate more” after treatment moved away from city regulation to state and federal regulation. Respondents changing their regulation preference to “I do not know” after treatment were less likely to prefer federal regulation after treatment and more likely to prefer county regulation posttreatment. Those that stayed at “regulate less” shifted slightly from state to county and federal regulation.
Table 9. Respondents that preferred less regulation before treatment
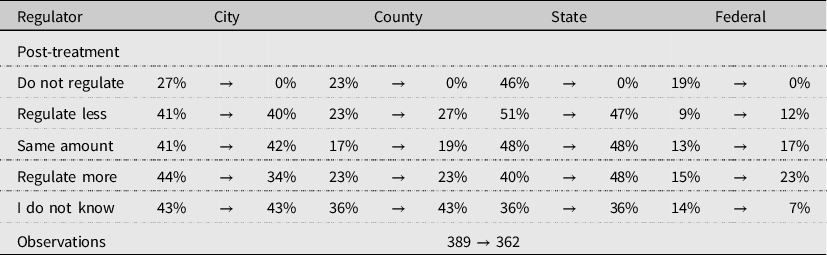
Table 10 shows changes in regulator preferences for individuals who preferred the same amount of regulation prior to treatment. Individuals changing their answer to “regulate less” posttreatment were less likely to choose city and more likely to choose state as a regulator than they were prior to treatment. Individuals that maintained their answer of “regulate the same amount” posttreatment were unlikely to change their answer regarding regulator preference. Overall, individuals that initially prefer “regulate the same amount” had little to no change in regulator preferences posttreatment, with changes being slight increases in selection of regulators across the table.
Table 10. Respondents that preferred same regulation before treatment

Table 11 shows changes in regulator preferences for individuals who preferred more regulation prior to treatment. Individuals changing their regulation preference to “regulate less” posttreatment tended to want more of every regulator except for state government. Individuals remaining with “regulate more” posttreatment were more likely to prefer each regulator after treatment. Individuals changing to “I do not know” posttreatment were more likely to want city and county regulation but less likely to want regulation from the federal government. County government saw increases across the board posttreatment.
Table 11. Respondents that preferred more regulation before treatment

Table 12 shows changes in regulator preferences for individuals who selected “I do not know” as their regulation preference prior to treatment. Individuals changing their answer to “regulate less” after treatment were less likely to prefer city regulation and more regulation from county and state governments. Individuals changing their regulation preference to “regulate the same amount” after treatment were more likely to want involvement from city and county government and less likely to want involvement from state government than prior to treatment. Individuals changing their answer to “regulate more” were more likely to prefer participation in regulation from both state and federal governments. Individuals that still had unknown regulation preferences saw a large increase in desire for county government regulation, with little changes in preferences for other regulators.
Table 12. Respondents with unknown regulation preference before treatment

There are also changes that all or most tables have in common. Individuals that want more regulation after treatment tend to want regulation by federal government more than individuals that choose “regulate less” after treatment. Individuals that choose “I do not know” before treatment seem to have inconsistent changes before and after treatment. This appears to provide some evidence that regulation attitudes and regulator preferences being separate issues. Individuals that choose “I do not know” also seem to have some of the most extreme changes across the tables, most of them being similar in magnitude. State is always the most popular regulator among individual’s choosing “regulate more” after treatment. Interestingly, state is also the most popular regulator among individuals choosing “regulate less” after treatment. This provides more evidence that strength of attitude toward regulation and regulator preference may be independent of each other.
Conclusions
Supplemental lighting systems will continue to grow in popularity among producers in the greenhouse and CEA industries as a strong solution to increase profit and production levels. LED systems are especially likely to be adopted at increasing rates in the future because of the energy efficiency and low maintenance costs, which coincide with global efforts to reduce energy usage and, therefore, carbon emissions (Khanh et al., Reference Khanh, Bodrogi, Vihn and Winkler2015). Keeping this in mind, it is important to understand how consumer preferences and desires for regulation change when they (or their property) are exposed to the light from LED systems directly or through the media. In addition, it is important to understand which individual characteristics have significant effects on preferences for regulation. The authors hope conclusions drawn regarding which factors most heavily influence changes in consumer preferences after treatment can be helpful to producers and policy makers.
There are multiple significant factors that influence citizens’ change in preferences for regulation of LED systems in greenhouses after seeing images of light pollution from such sources. Our results show that urban areas and younger generations are less likely to want regulation after seeing light pollution caused by supplemental lighting systems. Individuals who are unaware of their primary residence’s distance to the nearest greenhouse were much more likely to be opposed to lighting systems after treatment compared to those that live 5 miles or closer to the nearest greenhouse. In the case of this study, individuals unaware of the distance from their primary residence to the nearest greenhouse comprised 46% of our sample. If the goal of investors and food producers is to minimize potential conflict from the use of supplemental LED lighting in greenhouses, it may be beneficial to avoid implementation of systems in the following areas: suburban or rural areas, areas with relatively high percentages of older individuals (45+), and areas with little agriculture or ALAN already established, assuming the correlation between lack of awareness of distance to nearest greenhouses and the number of agricultural enterprises already established in the area. In addition, the higher the perceptions of safety of supplemental LED systems, the less likely citizens are to prefer more regulation posttreatment. It may be beneficial for producers and policy makers in key areas where greenhouse production is a significant source of cash flow and food to make efforts to educate consumers about the safety of LED lights and their benefits.
Initial attitudes and preferences play a role in setting regulatory preference after receiving an information treatment. However, the impact may be less significant than other factors, such as perceptions of LED light safety. Future research can explore the nature of different initial preferences on posttreatment outcomes for preferences of regulation of LED supplemental lighting systems beyond the aggregate effect. Such an understanding would allow for better decision and policy making based on how citizens’ current preferences for regulation of LED lighting.
There are limitations to this study. While the sample is representative of the United States and may be useful in generalizing consumers living in areas with demographics like our sample, it may not be representative or useful in generalizing areas with demographic characteristics significantly different than those of our sample or the United States. In addition, while the media image treatment provides significant insight as to how citizens will react to ALAN, true reactions, and changes in preferences for LED lighting regulation may be less or more extreme when in real-world scenarios. It is possible that true changes in preferences for regulations after exposure of citizens to light pollution are understated in this study. Additionally, we did not examine specific regulations (e.g., requiring blackout curtains). Future research should examine resident attitudes to specific regulations. For example, while some residents may prefer more regulation after seeing the information treatment, they may not prefer a specific proposal of more regulation. Policy makers and producers should take these limitations into account when making decisions using this study.
Data availability
The data used within this article are available from the author(s) upon request.
Author contribution
Conceptualization: Campbell, Secor; Methodology: Campbell, Secor; Formal analysis: Daniel, Campbell, Secor; Data curation: Campbell; Writing—original draft: Daniel; Writing—review and editing, Daniel, Campbell, Secor; Supervision: Campbell, Secor; Funding acquisition: Campbell.
Competing interests
None.


 Open access