


Plasma vitamin C concentration plateaus at higher levels of FV intake( Reference Jenab, Slimani, Bictash, Ferrari and Bingham 1 ), therefore spot urinary vitamin C may be a better FV intake biomarker. Potassium (K) is found widely in FV and excreted in urine( Reference Bingham 2 ). Thus, using data from a randomised FV study, we explored the use of spot urinary vitamin C and K as potential novel biomarkers of FV intake.
Participants were aged 40–65 years and hypertensive (blood pressure of 140–179/90–109 mmHg). Following a one portion FV/day four-week run-in-period, participants were randomised to consume 1, 3 or 6 portions FV/day for eight-weeks. Fasting plasma, spot and 24-hour urine samples were collected pre- and post-intervention. Plasma vitamin C was measured using a fluorimetric method on an automated Cobas Fara centrifugal analyser. Urinary vitamin C was measured on a BMG FLUOstar Optima plate reader. Urinary K was measured on the ion selective electrode module of a Cobas analyser.
A total of 117 subjects completed the 12-week study. Across the intervention groups plasma vitamin C increased, but plateaued between 3 and 6 portions/d. In contrast, spot and 24-hour urinary vitamin C increased as FV intake increased. No statistically significant differences were found between the three groups in spot and 24-hour urinary K excretion.
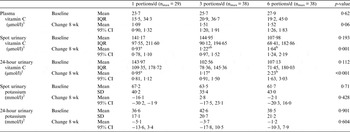
1Variables were logarithmically transformed. All baseline values are geometric mean (IQR), and all change values are geometric mean (95% CIs) of the ratio of the week 8 to baseline value. 2All baseline values are mean (SD), and all changes mean (95% CI). Changes were calculated as week 8 – baseline; changes were compared between groups using one way analysis of variance with a test for linear trend. Superscripted letters indicate homogeneous subsets.
Urinary vitamin C, but not urinary K excretion, may be a potential biomarker of FV intake.
