


Introduction
While traditionally mental health care focused on the reduction and/or elimination of distressing symptomatology (Slade et al., Reference Slade, Amering, Farkas, Hamilton, O'Hagan, Panther, Perkins, Shepherd, Tse and Whitley2014; van Os et al., Reference van Os, Guloksuz, Vijn, Hafkenscheid and Delespaul2019), more recently the recovery movement has shifted focus to person-centred holistic care, acknowledging the importance of participation in society (Davidson, Reference Davidson2016). As such, in conjunction with the treatment of symptoms (Le Boutillier et al., Reference Le Boutillier, Leamy, Bird, Davidson, Williams and Slade2011; Slade et al., Reference Slade, Amering, Farkas, Hamilton, O'Hagan, Panther, Perkins, Shepherd, Tse and Whitley2014), there has been more consideration of education and employment, finances, housing, physical health, community participation and quality of life (van Os et al., Reference van Os, Guloksuz, Vijn, Hafkenscheid and Delespaul2019); areas highly valued by people with mental ill-health and their families (Connell et al., Reference Connell, O'Cathain and Brazier2014; Robotham et al., Reference Robotham, Wykes, Rose, Doughty, Strange, Neale and Hotopf2016). Many of these domains are characteristic of social inclusion (Filia et al., Reference Filia, Jackson, Cotton, Gardner and Killackey2018), a relatively new concept in the mental health field, with a focus on the degree to which a person participates in their communities (Productivity Commission, 2019). Due to the inter-connected nature of these domains, difficulties in one domain can impact other domains and reduce overall social inclusion. In addition, a negative cycle can ensue between social exclusion and poor mental health that, once started, can be difficult to break (Filia et al., Reference Filia, Menssink, Gao, Rickwood, Hamilton, Hetrick, Parker, Herrman, Hickie, Sharmin, McGorry and Cotton2021). However, relationships between these domains, and the impact and direction of the relationship with mental health remain underexplored.
Research on social inclusion in those impacted by mental ill-health has been hampered by a lack of definitional consensus, understanding of its components, and how to best measure the construct (Morgan et al., Reference Morgan, Burns, Fitzpatrick, Pinfold and Priebe2007; Huxley et al., Reference Huxley, Evans, Madge, Webber, Burchardt, McDaid and Knapp2012; Filia et al., Reference Filia, Jackson, Cotton, Gardner and Killackey2018). While a number of measures of social inclusion are available (Stickley and Shaw, Reference Stickley and Shaw2006; Lloyd et al., Reference Lloyd, Waghorn, Best and Gemmell2008; Dorer et al., Reference Dorer, Harries and Marston2009; Secker et al., Reference Secker, Hacking, Kent, Shenton and Spandler2009; Marino-Francis and Worrall-Davies, Reference Marino-Francis and Worrall-Davies2010; Huxley et al., Reference Huxley, Evans, Madge, Webber, Burchardt, McDaid and Knapp2012; Mezey et al., Reference Mezey, White, Thachil, Berg, Kallumparam, Nasiruddin, Wright and Killaspy2013), they have yet to undergo either a complete psychometric evaluation, and/or have restricted use for people with mental ill-health (Coombs et al., Reference Coombs, Nicholas and Pirkis2013; Cordier et al., Reference Cordier, Milbourn, Martin, Buchanan, Chung and Speyer2017; O'Donnell et al., Reference O'Donnell, O'Donovan and Elmusharaf2018). Our team has been working to address these issues, developing the Filia Social Inclusion Measure (F-SIM), with items based on a thematic analysis of the literature (Filia et al., Reference Filia, Jackson, Cotton, Gardner and Killackey2018) and a consensus study of those impacted by mental ill-health (Filia et al., Reference Filia, Jackson, Cotton and Killackey2019a). In its original long-form, the F-SIM has demonstrated validity in discriminating the impacts of mental ill-health on social inclusion of consumers and caregivers (Filia et al., Reference Filia, Jackson, Cotton and Killackey2019b), and the preliminary characteristics of the measure have been tested in clinical and community-based youth samples (Gardner et al., Reference Gardner, Cotton, O'Donoghue, Killackey, Norton and Filia2019; Gardner et al., Reference Gardner, Cotton, O'Donoghue, Killackey, Norton and Filia2020). Refinement of this measure was required to ensure brevity and practicality of use in clinical and research settings. Thus, the aims of this work were to (i) use item reduction techniques to produce a more concise version of the measure; and (ii) test the psychometric properties of the reduced measure, including dimensionality, internal consistency, test–retest reliability, the ability to discriminate between groups, and construct validity.
Methods
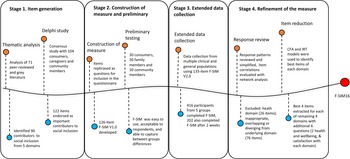
The F-SIM was developed iteratively over several stages briefly outlined here (see Fig. 1 and for more details, Filia et al., Reference Filia, Jackson, Cotton and Killackey2019b; Gardner et al., Reference Gardner, Cotton, O'Donoghue, Killackey, Norton and Filia2019).

Fig. 1. Process of Development of F-SIM16 from Stage 1 (Item Generation) to Stage 4 (Refinement and Validation).
Note: The first iteration of the measure developed (F-SIM V1.0) in Stage 2 comprised 126 items, with a reference period of the past month. Most items were measured on a dichotomous scale (Yes/No), or Likert scales. Nine additional items were included in (F-SIM V2.0) at Stage 3 for clarity. Data collected from Stage 2 and 3 were harmonised and pooled together in Stage 4 for further psychometric evaluation.
Preliminary work
Stage 1. Item generation
An evidence-based definition of social inclusion was established over two studies. First, a thematic analysis of academic peer-reviewed and grey literature to identify conceptualisations of contributors of social inclusion (Filia et al., Reference Filia, Jackson, Cotton, Gardner and Killackey2018). Second, a consensus study regarding the relative importance of contributors to social inclusion to those with a lived experience of mental ill-health, and the general community (Filia et al., Reference Filia, Jackson, Cotton and Killackey2019a).
Stage 2. Construction of measure and preliminary testing
Contributors identified in the thematic analysis, and agreed upon as important in the consensus study, were rephrased into question form to allow self-report administration. We grouped contributors according to the similarity of features into five overarching domains: (i) Housing and neighbourhood (HN); (ii) Social relationships, Participation and limitations (SOC); (iii) Employment and education (EE); (iv) Finances (FIN) and; (v) Health and wellbeing (HW). Preliminary psychometric evaluation of the face and discriminant validity of the 126-item version (F-SIM V1.0) in 90 participants suggested it was easy to use, highly acceptable to respondents, and able to discriminate between groups in terms of social inclusion (Filia et al., Reference Filia, Jackson, Cotton and Killackey2019b).
Stage 3. Extended data collection
To conduct further validation, we collected data from participants in five groups (N = 416): (i) young people (18–25 years) with a serious mental illness (SMI; psychosis); (ii) same-aged young people with an SMI (not psychosis); (iii) same-aged young people from the general community; (iv) older people (26 years+) with an SMI; and (v) same-aged older people from the general community. The methodology has been detailed previously (Gardner et al., Reference Gardner, Cotton, O'Donoghue, Killackey, Norton and Filia2019). In brief, participants completed the F-SIM Version 2.0 (a 135-item version, additional questions included for clarity), alongside other measures including an existing, albeit brief social inclusion measure (the Social Inclusion Scale, SIS; Secker et al., Reference Secker, Hacking, Kent, Shenton and Spandler2009), and the UCLA Loneliness Scale (UCLA-LS; Russell, Reference Russell1996). A subset of participants (n = 202) completed the F-SIM again at a 2-week follow-up.
Current study
Stage 4. Refinement of the measure
Participants and data
Data from Stages 2 (N = 90) and 3 (N = 416) were pooled and analysed in Stage 4 (N = 506). Relevant measures analysed here included the F-SIM, the UCLA-LS and the SIS. Higher scores on the UCLA-LS and SIS indicate greater subjective loneliness and isolation, and degrees of social inclusion respectively.
Item evaluation and reduction
All analyses were conducted using R version 4.0.2 (2020-06-22). Items were refined and recoded according to their distributions (e.g. item response categories with low prevalence were combined). Items were excluded if they had a high degree of overlap (almost identical response patterns), were superseded by other broad or essential questions, or were age-specific.
In the second step, network psychometric analyses were used to understand the interplay between items, and their underlying domains (Borsboom and Cramer, Reference Borsboom and Cramer2013). We used multidimensional scaling (MDS) network analysis (Jones et al., Reference Jones, Mair and McNally2018) of the pairwise tetrachoric correlation coefficients, γ tc, with the benefit that the distance between any pair of nodes (variables) is directly interpretable as the strength of association. MDS network analysis is additionally helpful for understanding complex associations in high-dimensional data, where other techniques such as factor analysis, can be difficult to interpret (Borsboom and Cramer, Reference Borsboom and Cramer2013; Jones et al., Reference Jones, Mair and McNally2018). Using MDS networks we identified: (i) whether items reflected their latent domain (distance of the location from other items in the same domain); and (ii) items with a higher level of overlap.
Third, single factor confirmatory factor analysis (CFA) and Item response theory (IRT) 2PL models were used to identify the best items within each domain for inclusion in the final measure. Items selected included those more reflective of the latent domain(s) of interest (according to CFA and IRT results), and of more relevance to the theoretical framework.
Psychometric evaluation of the revised measure
Pairwise associations between items within each domain were evaluated using tetrachoric correlation coefficients, r tc. Item-to-total correlations within each domain were estimated using biserial correlation coefficients, r bs. Correlations were estimated using pairwise complete observations. Internal reliability was evaluated using Cronbach's alpha, α, based on r tc. MDS network modelling using γ tcwas then carried out to obtain an overview of all items. Three CFA models were used to evaluate whether the measure was unidimensional, multidimensional, or best represented by a second-order latent factor. Overall model fit was examined using chi-square (χ 2) goodness-of-fit statistics, root mean square error of approximation (RMSEA: <0.08 acceptable; 0.05 excellent), Tucker–Lewis index (TLI: >0.90 acceptable; >0.95 excellent) and comparative fit index (CFI: >0.90 acceptable; >0.95 excellent) (Hooper et al., Reference Hooper, Coughlan and Mullen2008).
We then examined the capacity of the revised measure to distinguish between groups. First, we visually examined the distributions of domain scores (0–100) across the five groups. Second, we conducted a range of comparisons both across and within clinical and community groups using independent samples t-tests.
Test-retest reliability was evaluated using the 2-week follow-up data. Pearson product-moment correlations (r) were (i) evaluated between baseline and follow-up total scores; and (ii) used to compare the reduced version of the F-SIM with the UCLA-LS and the SIS.
Results
Sample characteristics
The cohort comprised 506 participants from the five different groups : (i) young people (18–25 years) with a SMI (psychosis; n = 149), (ii) young people (18–25 years) with a SMI (not psychosis; n = 26), (iii) young people (aged 18–25 years) from the general community (n = 163), (iv) older people (26 years+) with a SMI (n = 64); and (v) older people (26 years+) from the general community (n = 104; see Table 1).
Table 1. Demographic characteristics of the total cohort and five population groups
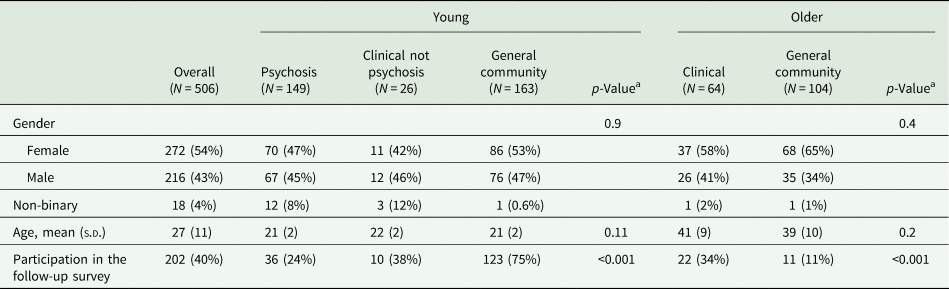
a Pearson's Chi-squared for a categorical variable (excluding the non-binary group due to small cell count); Independent sample t-test or ANOVA test for continuous variable.
Item evaluation and reduction
Item refinement
Distributions of Likert-scaled items (excluding satisfaction items) were either very skewed or bimodal, suggesting the underlying latent factor underpinning these questions was more likely categorical than continuous, or that participants were likely to respond to questions with a binary mindset. Hence, responses were converted to a binary system (Yes/No) allowing ease of comparison with other items, and simplifying response selection for respondents. Examples of binary conversions include Likert responses such as ‘1-Not at all’, ‘2-A little bit’, ‘3-Very much so’ being converted to 1 = No, 2&3 = Yes; or ‘1-Definitely limited’, ‘2-Limited a bit’, ‘3-Not at all’ being converted to 1&2 = Yes, 3 = No.
Forty-five items were excluded after item responses were evaluated for all questions, leaving 90-items remaining.
Item domain mapping
Fifty-seven items were excluded in this stage. Items were considered within the five domains they were initially grouped. Associations between items were mapped using MDS network analysis and data-supported four of the five domains. The remaining domain (Health and Wellbeing), was excluded from the revised measure in its entirety (26 items). MDS analysis indicated that these items did not correlate closely with one another as a cluster. Further, it was determined that health items should be measured independently of social inclusion to account for different health conditions, and allow for a clearer assessment of the relationship between both.
Twenty-five items diverging from their associated latent domain were excluded. For example, the item ‘Of the household members over the age of 18, are all currently employed or attending formal education?’ was found unrelated to the underlying HN domain. Finally, six items had a high degree of overlap with core items of the individual domain and were thus excluded. Thirty-three items remained at this point.
Further item reduction
CFA and IRT models of individual domains supported within-domain unidimensionality for the remaining 33 items. Four items from each domain were selected on the basis of higher factor loadings and lower residuals in the CFA model, and higher discriminant ability and ability to maximise item information in the IRT model. Where items had similar psychometric properties, those that better reflected the theoretical framework of social inclusion were chosen.
F-SIM16 measure
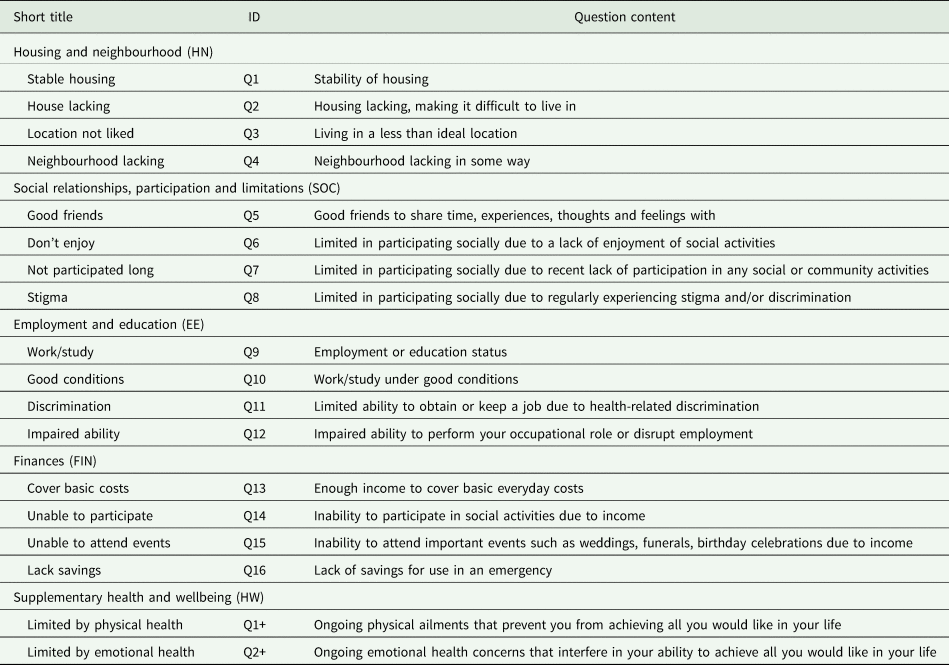
The final version of the measure comprised 16 core items, herein referred to as the F-SIM16. Table 2 contains an overview of items and associated short labels, with the full measure available upon request. An additional six items (not included in final scoring) were included as supplementary questions: two questions related to health and wellbeing (Do you feel your emotional/physical health interferes in your ability to achieve all you would like each day?), and four items related to satisfaction (not collected in the current study) with each of the domains. The supplementary questions provide an overview of the impact of health issues on functioning and satisfaction with domains of social inclusion, and will be validated in future studies.
Table 2. Questions from the 16 item version of the F-SIM
Psychometric evaluation of the F-SIM16
Inter-item correlations
Pairwise r tc between individual items within domains, item-to-total biserial correlations (r bs) and Cronbach's alpha within each domain are provided in Table 3. Inter-item correlations within each domain ranged from medium to strong. Item-to-total biserial correlations (r bs) ranged between 0.75 (HN and Stable housing) and 0.89 (FIN and Unable participate). Each domain showed strong internal consistency (α > 0.85) and the internal consistency for the 16 items was excellent (α = 0.92). Individual item correlations (provided in online Fig. S1 in Supplementary Material) were visualised using network analysis (see online Supplementary Fig. S2). Most items were closely related to items within their overarching domains. The Discrimination and Impaired ability items in the EE domain had moderate correlations with items in the SOC domain.
Table 3. Inter-item tetrachoric correlations (r tc), item-to-total polyserial correlations (r bs) and Cronbach's alphas (α) for each social inclusion domain
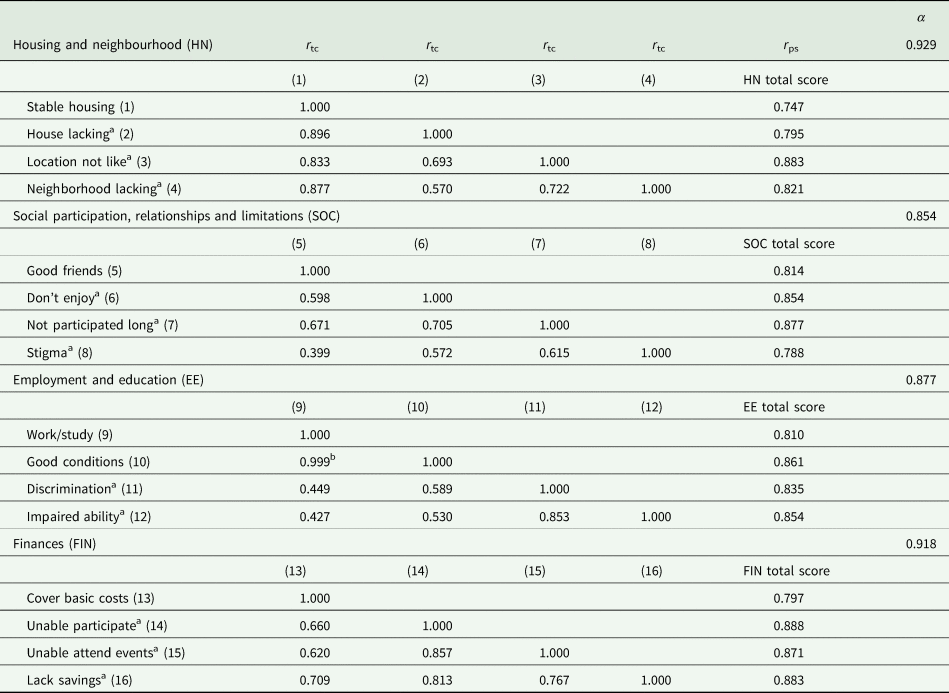
r pc, tetrachoric correlation coefficient; r ps, polyserial correlation coefficient; α, Cronbach's alpha.
a Reverse scored.
b High correlation here is related to these being nested questions, a high proportion of participants working suggested that they were working in a good condition.
Overall instrument evaluation
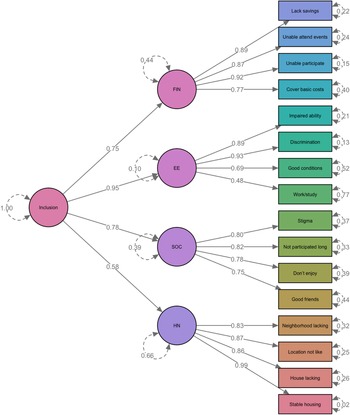
Model fit indicators for the three CFA models are provided in online Supplementary Table S1. Both the four-factor and second-order models had an excellent fit with the data (RMSEA < 0.05; CFI/TLI > 0.95). With fewer parameters, the second-order model was preferred. Factor loadings and residual variances estimated for the second-order CFA are displayed in Fig. 2. The second-order model supports the calculation of domain scores, in addition to the total score.
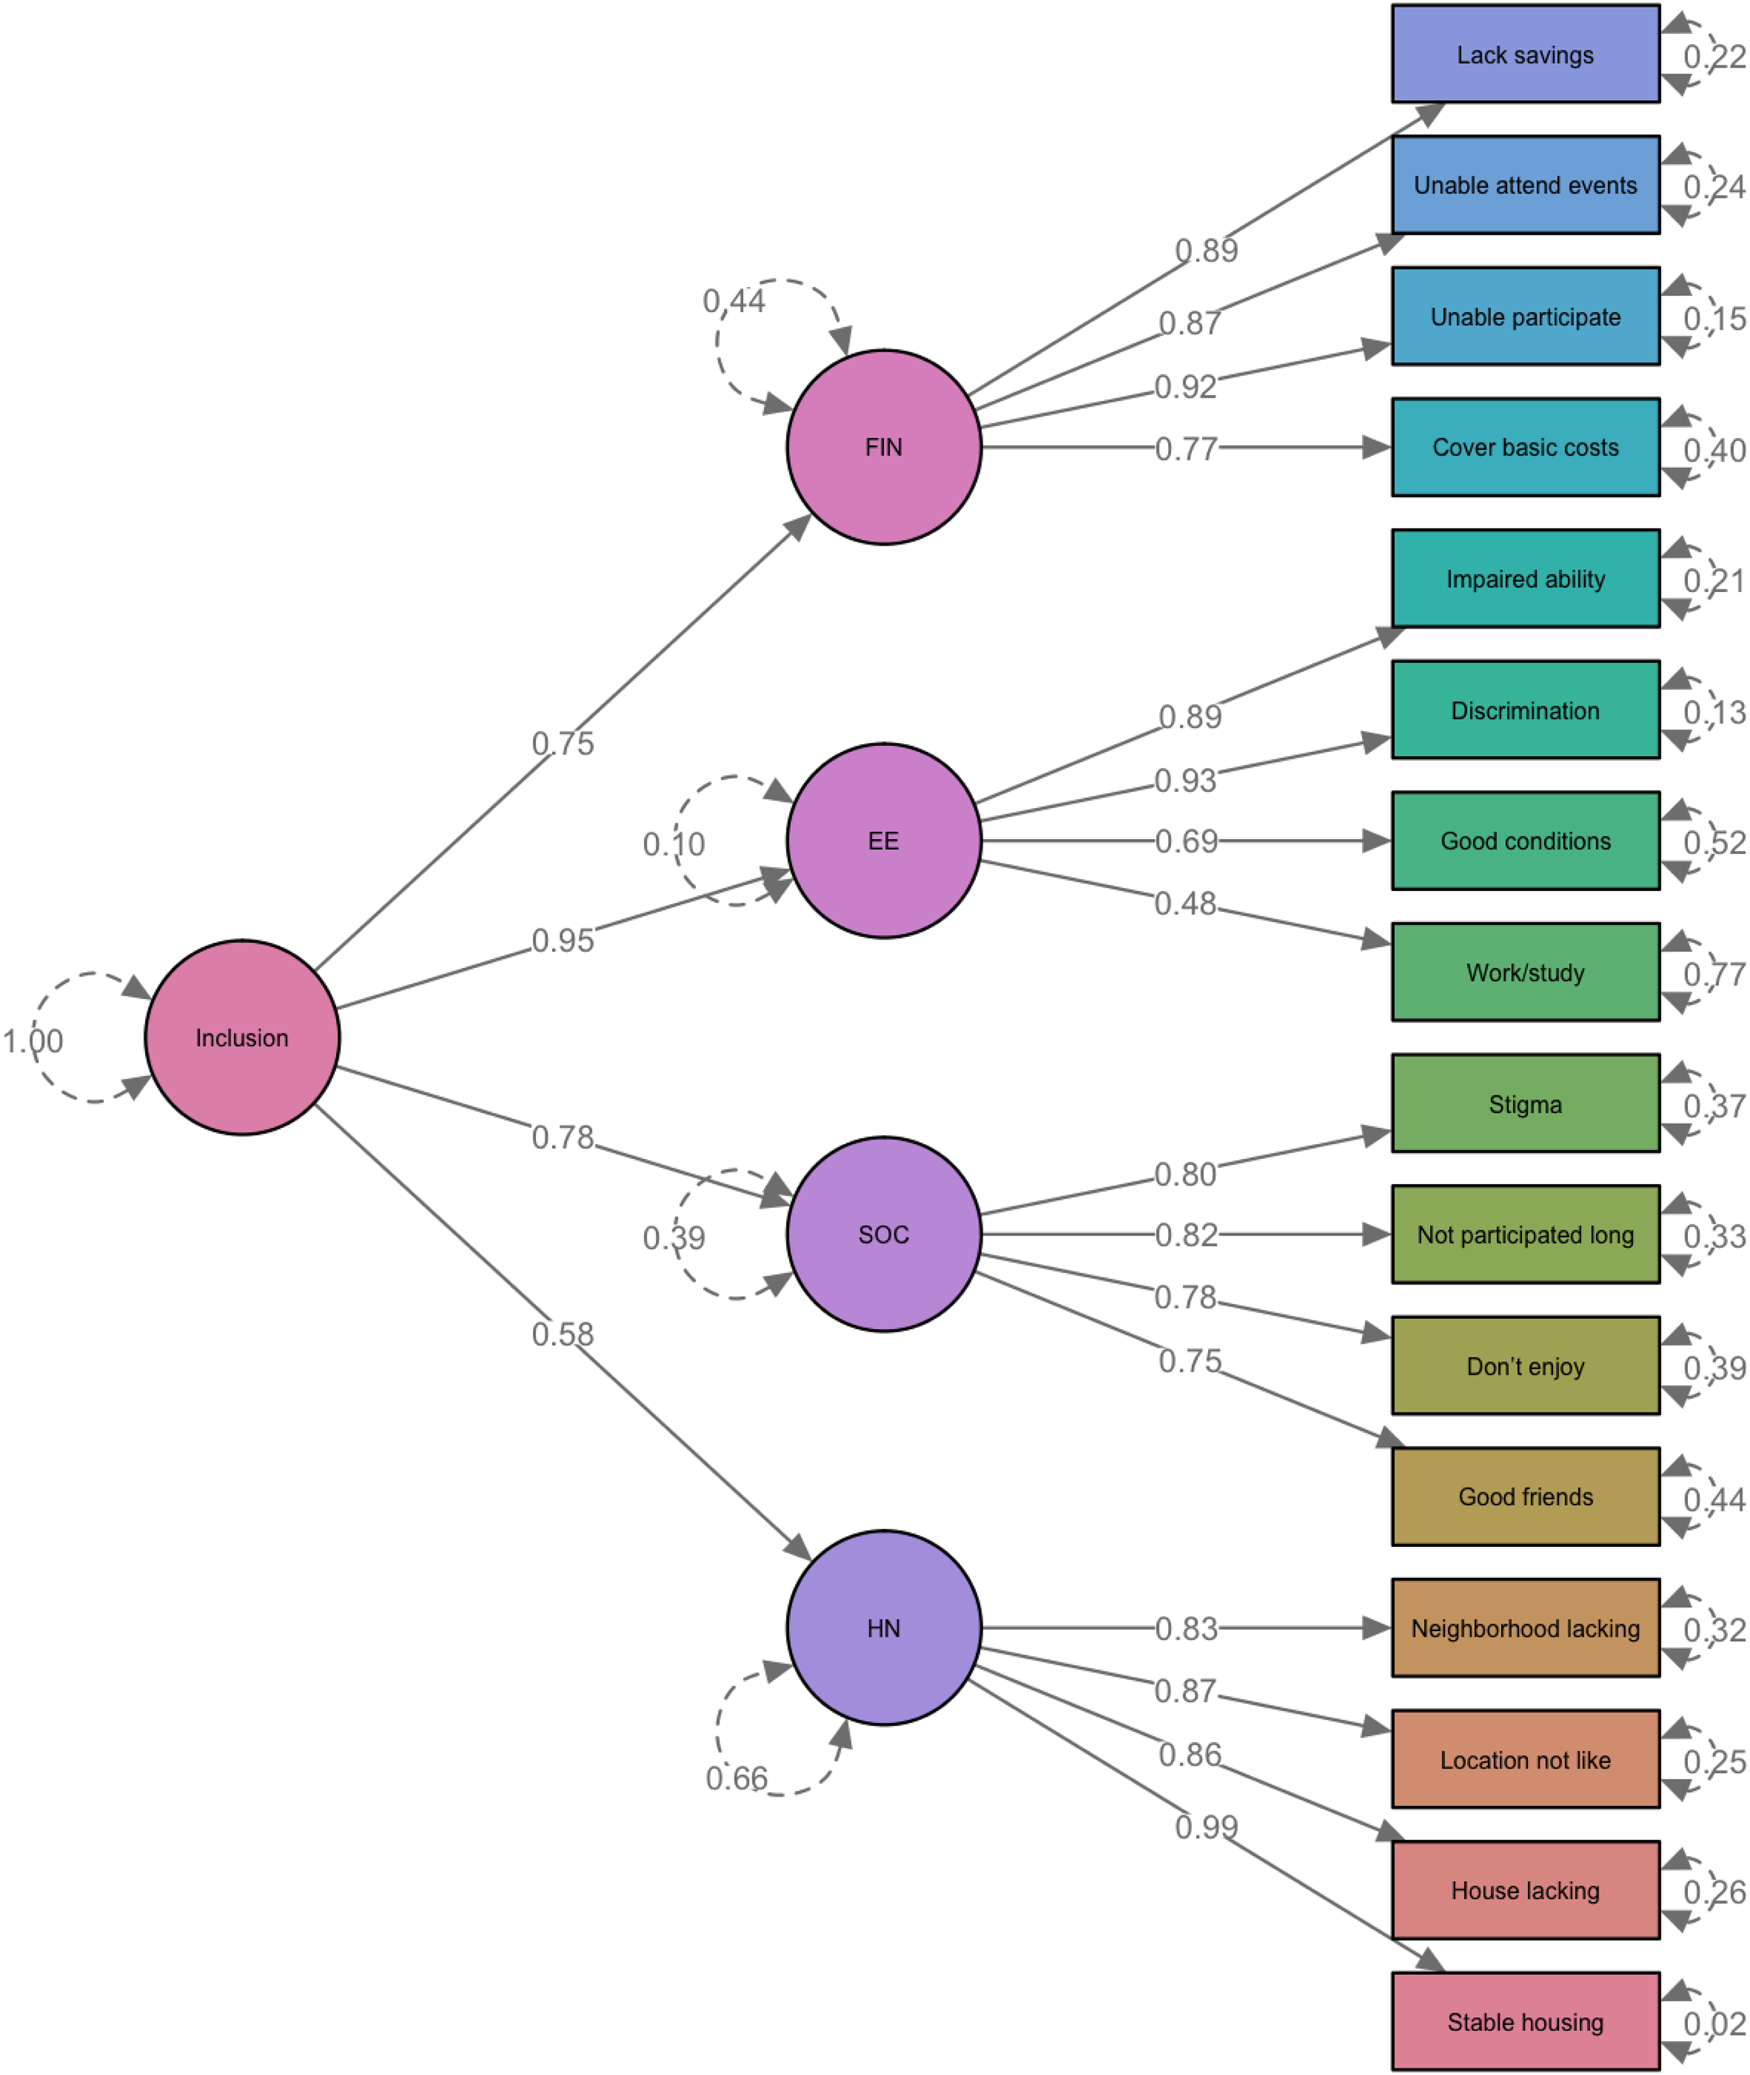
Fig. 2. Factor Loading and Residual Variance Estimated from the Second-order CFA Model. *Reverse scored items. CFA model was based on 488 records with complete data.
Group differences
Distributions of the F-SIM16 domain and total scores, as well as individual item responses by groups, are provided in online Supplementary Table S2 and Fig. S3. Young people with psychosis or other mental ill-health reported the lowest level of social inclusion in all domains, particularly in the SOC and FIN domains. Although a proportion of older participants from the clinical population reported a lower level of social inclusion, the subgroup experienced a similar level of inclusiveness compared with the general community (reflected by the bimodal distribution in SOC and FIN domain). Pairwise comparisons of the domain and total scores, as shown in online Supplementary Table S3, suggested that clinical subgroups consistently reported lower levels of social inclusion compared to community counterparts across all domains. Participants from the general community groups were more comparable in all domains irrespective of age, except for lower scores in the SOC domain among young people.
Test-retest reliability
The correlation coefficient (r) between baseline and follow-up scores of individual domains varied between 0.68 (HN) and 0.83 (EE and FIN; SOC 0.73). The F-SIM16 total score had a correlation (γ) of 0.90 between baseline and follow-up, indicative of high test-retest reliability.
Correlation with similar constructs
Both the SIS and UCLA Loneliness Scale had strong correlations with the F-SIM16 total score (r > 0.60) (online Supplementary Table S4). As expected, the SIS and UCLA-LS had low correlations with some of the F-SIM16 domains including FIN, EE and HN.
Discussion
Social inclusion is an important concept in mental health, particularly with an increasing focus on consumer-driven outcomes and recovery. To facilitate continued and meaningful progress, novel outcome measures are required. Here we reported on a novel measure of social inclusion, the F-SIM, detailing refinement to a 16-item form (the F-SIM16), using traditional and contemporary psychometric techniques.
The F-SIM16
The F-SIM16 is a brief, easy to use, self-report measure with sound psychometric properties validated in populations of younger and older people with mental ill-health and same-aged community peers. Items were selected using a combination of data and theory-driven approaches. As intentionally designed, items remain a combination of subjective and objective characteristics of social inclusion within each domain.
Psychometric analyses supported the four core domains of social inclusion, as identified in our earlier work (Filia et al., Reference Filia, Jackson, Cotton, Gardner and Killackey2018) and endorsed by considerable stakeholder engagement (Filia et al., Reference Filia, Jackson, Cotton and Killackey2019a, Reference Filia, Jackson, Cotton and Killackey2019b). We observed high-level internal consistency within domains and an excellent second-order factor model fit, which supported the theoretical underpinnings of this multifarious concept. The cohesive network association also demonstrated multidimensionality, and highlighted interconnected elements.
The measure was found to have good discriminant ability, demonstrating differences in the domain and total scores across different populations, potentially reflective of the particular challenges these groups face as a result of age and/or experience of mental ill-health. This was particularly evident in findings that clinical groups (irrespective of age) reported poorer social inclusion than same-aged general community peers. Young clinical groups also reported lower levels of social inclusion overall compared with the older clinical group. This could indicate that over time older people with mental ill-health find ways of adapting to their circumstances, perhaps having secured stable accommodation, receiving and finding ways to manage finances, and connecting socially in ways that are meaningful to them.
The F-SIM16 demonstrated temporal robustness, making it an excellent tool for evaluating the impact of interventions.
Other measures of social inclusion
As the F-SIM16 was developed in response to an identified need for appropriate measures of social inclusion, so too were other measures, including the SIS (Stickley and Shaw, Reference Stickley and Shaw2006; Lloyd et al., Reference Lloyd, Waghorn, Best and Gemmell2008; Dorer et al., Reference Dorer, Harries and Marston2009; Secker et al., Reference Secker, Hacking, Kent, Shenton and Spandler2009; Marino-Francis and Worrall-Davies, Reference Marino-Francis and Worrall-Davies2010; Huxley et al., Reference Huxley, Evans, Madge, Webber, Burchardt, McDaid and Knapp2012; Mezey et al., Reference Mezey, White, Thachil, Berg, Kallumparam, Nasiruddin, Wright and Killaspy2013). As per the F-SIM16, the development and evaluation of some of these measures have progressed (Huxley et al., Reference Huxley, Chan, Chiu, Ma, Gaze and Evans2015; Wilson and Secker, Reference Wilson and Secker2015; Mezey et al., Reference Mezey, White, Harrison, Bousfield, Lloyd-Evans, Payne and Killaspy2020), yet none have reported a complete psychometric evaluation to date. Additional limitations include poor generalisability as a result of having been developed for use in specific settings (Stickley and Shaw, Reference Stickley and Shaw2006; Dorer et al., Reference Dorer, Harries and Marston2009; Secker et al., Reference Secker, Hacking, Kent, Shenton and Spandler2009; Marino-Francis and Worrall-Davies, Reference Marino-Francis and Worrall-Davies2010) and imbalances in the inclusion of objective/subjective elements (either a greater focus on subjective measures [Stickley and Shaw, Reference Stickley and Shaw2006; Lloyd et al., Reference Lloyd, Waghorn, Best and Gemmell2008; Secker et al., Reference Secker, Hacking, Kent, Shenton and Spandler2009; Marino-Francis and Worrall-Davies, Reference Marino-Francis and Worrall-Davies2010), or an entire focus on objective measures (Dorer et al., Reference Dorer, Harries and Marston2009)]. Stakeholder engagement also varied considerably, from comprehensive consultation on all stages of measure development (Stickley and Shaw, Reference Stickley and Shaw2006), to engagement post-measure construction (Marino-Francis and Worrall-Davies, Reference Marino-Francis and Worrall-Davies2010; Mezey et al., Reference Mezey, White, Thachil, Berg, Kallumparam, Nasiruddin, Wright and Killaspy2013). Comparatively, the F-SIM16 possesses a solid theoretical foundation, significant stakeholder engagement during development and testing, generalisability across different groups, and a balance of subjective and objective components of social inclusion across multiple domains. Comparing the F-SIM to other measures indicated that it was the superior tool for measuring social inclusion as a multidimensional construct, with the UCLA-LS and SIS both appearing to measure one domain more generally (SOC).
Limitations
The main limitation of the current research relates to the psychometric evaluation utilising data collected from the original version of the F-SIM. Future studies are needed to further evaluate the psychometric properties of the F-SIM16, and assess the utility of the additional variables (health and wellbeing, and satisfaction with domains). A further limitation is that test-retest validity included a small sample of participants, in part due to low retention of participants. As a result, longitudinal patterns and responses to change are largely unknown. Additional research to address the above is needed.
Strengths and implications
Refining the F-SIM to the F-SIM16, provides a very useful tool with broad clinical and research utility. The F-SIM16 has the potential to contribute significantly to the broader understanding of social inclusion in mental ill-health, and to increase understanding of the dynamics between mental health and social inclusion. The brief, self-report nature enables the collection of wide-scale data via online approaches, ensuring accessibility and completion of the survey by those potentially most excluded, thus reducing bias in assessments, and at a low-cost.
The properties of the F-SIM16 enable the collection of sound empirical data, including data for at-risk, consumer groups and normative data. This implication is by far the most valuable, providing information on the distribution of scores across population groups, and identifying strengths and areas impacted in specific domains. Further, the inclusion of the additional questions related to individual's satisfaction with each domain will ensure we maintain an understanding of how personally satisfied individuals are with their unique circumstances.
The F-SIM16 will aid in determining the effectiveness of programs and interventions designed to improve social inclusion. It will allow for pre- and post-measurement, and the identification of those aspects of social inclusion most receptive to change. This will foster the development of more informed and relevant interventions. The ability to provide data about the extent of social inclusion in various populations (geographical, diagnostic, with respect to age, gender etc.) can inform policy development and service reform to improve both social inclusion, and the health and wellbeing of people with mental illness.
From a clinical perspective, this tool will assist in tailoring treatment plans, and determining the need for collaborative approaches to treatment. Completing a measure of social inclusion at the outset of treatment allows for the charting of progress across time and facilitates more holistic outcome measurement. Completion at routine time points, as well as at times of illness exacerbation, may assist in determining individual risk factors and the relationship between symptomatology and social inclusion, to aid in treatment and maintaining wellbeing.
Together these strengths demonstrate the significant contribution of the F-SIM16 to the field of mental health, with the potential for considerable impact by providing a more rigorously developed, comprehensive measure of social inclusion than previously available. Implementation of the F-SIM16 in research or clinical evaluations to determine treatment, service gaps and needs, and to target facilitators of social inclusion, has significant potential to improve the lives of people with SMI.
Supplementary material
The supplementary material for this article can be found at https://doi.org/10.1017/S2045796021000755
Data
The data that support the findings of this study are available upon reasonable request from the corresponding author (KF) and subject to ethical approval/restrictions.
Financial support
This work was supported by The University of Melbourne internal grants scheme - ECR Project Grant and Melbourne Research Fellowship (KF).
Conflict of interest
None.
Ethical standards
The authors assert that all procedures contributing to this work comply with the ethical standards of the relevant national and institutional committees on human experimentation and with the Helsinki Declaration of 1975, as revised in 2008. All procedures were approved by Melbourne Health Human Research and Ethics Committee HREC (2010.105; 2016.311, HREC/16/MH/325).


 Open access