


Childhood obesity is a significant public health issue: the WHO describes childhood obesity as one of the most serious public health concerns of the 21st century(1). Children with obesity are more likely to experience a range of adverse psychological and psychiatric problems, including poor school performance and social functioning(2). Raised BMI is a major risk factor for diseases in adulthood such as CVD, musculoskeletal disorders, type 2 diabetes(3) and some cancers(4).
Obesity places a considerable financial burden on the National Health Service and wider society. It is estimated that in the UK, the NHS spent £6·1 billion on overweight and obesity-related ill-health in 2014/2015, and costs to society are estimated at £27 billion(5).
Wales has higher levels of childhood obesity than all regions of England and similarly developed countries in Europe(6). The prevalence of obesity in children aged 4–5 years in Wales is 12·4 % (2016/2017) and remains on the increase(7), whereas in England and many other developed countries, childhood obesity has plateaued(Reference Wabitsch, Moss and Kromeyer-Hauschild8). There is an urgent public health need to address the increasing rates of childhood obesity in Wales, and therefore, there is a need to understand the risk factors associated with childhood obesity in Wales, UK.
The Marmot review (2010) demonstrated that social deprivation has an important influence on the levels of obesity, with children in lower socio-economic groups more likely to have obesity in the UK(Reference Marmot, Allen and Goldblatt9). Public health initiatives aim to reduce the inequalities in health and well-being. It was therefore considered important to assess any risk factors for childhood obesity after accounting for deprivation.
The risk factors for adult obesity were mapped in the Foresight Report 2007 where the complexity of obesity is outlined(Reference Butland, Jebb and Kopelman10). The thematic clusters described in the Foresight Report are relevant for adults and include food production, food consumption, biology, individual psychology, individual activity, the activity environment and societal influences. A full analysis of all of the risk factors for childhood obesity has not yet been conducted, and the current study adds to the evidence in this area.
Whilst there is good information on the individual risk factors for obesity in children(1), there is a need to understand the population-level risk factors for obesity in children. There are multiple reasons why it is essential to consider population-level risk factors rather than solely focusing on individual-level risk factors. For example, individual-level interventions to prevent and treat obesity are generally based on behaviour change which is often difficult to implement and sustain at scale(Reference Indig, Lee and Grunseit11). In contrast, the strength of population-level interventions is that population health benefits can result from small individual effects if a large number of individuals are exposed to the intervention(Reference Swinburn and Egger12). Population-level interventions have the potential to reduce inequalities, whereas individual-level interventions, if taken up selectively, can exacerbate health inequalities. For example, encouraging people to quit smoking can lead to increased inequalities as the least deprived groups quit smoking faster, whereas population-level initiatives, for example, banning smoking in public places influence the social norms across society(Reference Ritchie, Amos and Martin13). Population-level interventions have been shown to deliver substantial health benefits: the reduction in salt in processed foods in the UK is estimated to have led to 6000 fewer deaths from CVD(14) saving the UK economy approximately £1·5 billion per annum. The ‘Sugar Tax’ introduced in the UK in 2018 will test population-level interventions in the field of obesity.
The objective of the current study was therefore to examine associations between childhood obesity and a range of population-level risk factors to identify priorities for action. The results of the study will be shared with the Welsh Government who is producing an obesity strategy for Wales; the results will therefore inform policy. The novelty of the current study is the use of a large national data set (n 129 893), where each individual was matched to a wide range of population-level risk factors.
Methods
Outcome measure
The Wales Childhood Measurement Programme (CMP) measures the height and weight of children starting school in the reception class. All children attending a reception class in any school in Wales, including maintained and independent schools, are eligible for inclusion. Reception class is taken to be the cohort of children who have their 5th birthday within the school year between 1 September and 31 August. Arrangements for measuring of children in all relevant schools are managed by a relevant healthcare professional, in most cases will be the school nurse team lead. Children are measured between 1 September and 31 July of the year they are in reception class. All parents are offered the opportunity to withdraw their child from the programme in advance of measurement; this is done through provision of written material. Children are not included in the CMP weighing and measuring exercise if the parent withdraws them from the programme or if the child is unwilling or unable to participate. Uptake rates for the CMP are high, mean 90·7 % of the eligible population of reception age children in Wales(7). The outcome measure was obesity: children were either classified as ‘obese’ or ‘not obese’ (including normal weight and underweight). Obesity was classified using greater than or equal to the 95th centile for age and sex (based on 1990 childhood growth charts)(7). Full details of how the CMP data are collected and processed are published elsewhere(7). The current study used anonymised data from children measured between April 2012 and March 2017 in the CMP and matched it with a range of other data sets.
Identification of population-level risk factors to include in the cross-sectional analyses
A review of the literature in developed countries since 2007 was undertaken to identify potential population-level risk factors for childhood obesity to include in the study and to assess the types of data used to explore these variables. The population-level risk factors identified in the literature included a healthy childcare setting; the local area food environment; access to open space and play areas; the level of walkability of local streets and levels of traffic; a sense of community, levels of community safety and crime; land use and rurality; food promotion; the knowledge and skills of healthcare professionals. A wide range of publically available data sources were searched to identify direct or proxy measures of these risk factors. In addition, public organisations were asked for data where there was none was available routinely. The final list of variables included in the analyses is listed in Table 1, together with the organisations responsible for producing the data.
Table 1 Variables included in the analyses

Note: Mid-year estimates of population sourced from Office of National Statistics were used to calculate all per head of population figures.
Population-level risk factors included in the cross-sectional analyses
Healthy childcare setting
Public Health Wales supplied the percentage of schools accredited as part of the Healthy Pre-schools Scheme by local government area per annum as a direct measure of healthy childcare setting, that is, those childcare setting committed to providing healthy foods such as fresh fruit and vegetables and dedicated time for physical activities.
Food environment
The food environment has been measured using various methodologies in the literature. The measure most consistently used is the density of fast food outlets per 100 000 population. This was therefore calculated for each local government area in Wales using Food Standards Agency ratings, which are mandatory for food outlets in Wales. Data were downloaded from the Food Standards Agency website in September 2018 (http://ratings.food.gov.uk/). Full methodology is published here (http://www.wales.nhs.uk/sitesplus/888/page/87207). Once the number of outlets had been counted, this total was divided by the latest mid-year estimates of population for each local government area as produced by the Office of National Statistics (2017 data). A figure per 100 000 population was produced for each local government area in Wales and matched to the child’s residence.
Access to open space and play areas
Ordnance Survey supplied the percentage of land designated as accessible open space for each local government area in Wales, and the percentage of land designated as play space for each local government area in Wales and these were both matched to the child’s residence.
Level of walkability of local streets and levels of traffic
No direct measure of walkability is available for Wales. A proxy measure was therefore used. The percentage of schools that were accredited with the Sustrans (the sustainable transport charity) ‘Schools Mark’ was therefore used as a proxy measure of walkability. The Sustrans School Mark is awarded to a school that has worked to bring about some organisational, cultural and behavioural changes which help the school community choose to travel in more active and sustainable ways. Furthermore, air pollution data by local government area were used as a proxy measure of the levels of traffic this is routinely collected and reported by the Welsh Government.
Sense of community, levels of community safety, road safety and crime
The National Survey for Wales (commissioned by the Welsh Government) included two measures of social cohesion. These asked about perceptions of a sense of belonging to the community and if people treat each other with respect in the neighbourhood. Data were missing for 2015; this was estimated using the mean of 2014 and 2016. In addition, the number of people killed or seriously injured in road collisions each year was calculated by head of population from the UK Government’s Department of Transport road safety data ‘STAT19’ as a measure of road safety. Furthermore, the crime per head of population was calculated from Community Safety Partnerships data on total crime which in Wales are coterminous with each local government area. This was divided by the mid-year estimates of population sourced from Office of National Statistics to calculate crime per head of population for each local government area. This was then matched to each child by residence.
Land use and rurality of the neighbourhood
The rural or urban classification of each child’s residence was available in the CMP from the postcode. No further matching was necessary, and details of how this is calculated are published in the Wales CMP documentation(7).
Data matching
All population-level data were matched to each child in the CMP by the local government area of residence of the child (n 22). Where variables were also available over time, the data were matched to each child in the CMP by both the year of examination and the local government area of residence.
Missing data
The CMP data set only included children with data on height and weight recorded; therefore, there was no missing data to exclude from this source. The only population-level risk that had missing data was the National Survey for Wales measures of social cohesion, where data were not collected in 2015 this was therefore estimated using the mean of 2014 and 2016.
Potential confounding
Deprivation is known to be associated with obesity(7). Our objective was therefore to test for population-level factors associated with childhood obesity after deprivation was accounted for. The CMP data set included complete data for each child on the Welsh Index of Multiple Deprivation (WIMD, 2014) quintile, based on postcode. The WIMD is the Welsh Government’s official measure of relative deprivation for small areas in Wales and uses data from the following domains to inform the index: income, employment, health, education, access to services, community safety, physical environment and housing. Full details of the development of the WIMD and contributing data are published by the Welsh Government available at https://gov.wales/welsh-index-multiple-deprivation.
The Welsh Health Survey data for 4- and 5-year-olds from 2007 to 2015 were obtained under a formal data access agreement from the Welsh Government to explore other confounding factors such as diet and physical activity(Reference Wijtzes, Bouthoorn and Jansen15,Reference Nagel, Wabitsch and Galm16) . Data on fruit and vegetable consumption by local government area were generated to produce an overall percentage of children in each local government area who were eating both fruit and vegetables daily. This was derived from combining children whose parents reported that the children ate fruit daily and children who ate vegetables daily. Unfortunately, due to the way the questions are worded in the Welsh Health Survey, it is not possible to ascertain if children ate five pieces of fruit and vegetables each day (the UK Government guideline(17)). The Welsh Health Survey questionnaire and data summaries are available at https://gov.wales/welsh-health-survey.
An aggregated score for the percentage of children who were active for more than an hour daily (UK Government guideline(18)) was also calculated by local government area from the Welsh Health Survey data. This physical activity measure could include any form of activity that left the child feeling warm or at least slightly out of breath. This would include activities such as sport, cycling, running or brisk walking.
Since both breast-feeding and low birth weight have been associated with obesity(Reference Ortega-García, Kloosterman and Alvarez19,Reference Rayfield and Plugge20) , we accounted for this in our analysis by including them as confounding factors. These variables were matched to each child in the CMP by local government area of residence and the time period 5 years prior to the time of measurement to better match the time these children were born. The data for both breast-feeding rates and low birth weight were obtained from the National Community Child Health Database held by NHS Wales Informatics Service.
Analyses
Bivariate analysis was undertaken to compare children with obesity and non-obese groups and identify which variables to take forward to the multivariable logistic regression. Variables were only taken forward to a multivariable logistic regression if P < 0·10 in the bivariable logistic regression. This cut-off is more liberal than the conventional test for significance, since its purpose is to identify potential predictor variables rather than to test a hypothesis(Reference Ranganathan, Pramesh and Aggarwal21). Those that met this criteria were included in a multivariable logistic regression, this included the following variables: sex, deprivation quintile, rurality, land designated as accessible open space, fast food density, sense of belonging to the community, low birth weight, breastfed at birth, combined fruit and vegetable consumption, physically active for more than an hour a day. A Bonferroni correction was applied as multiple variables were considered in the model: the P value considered to indicate statistical significance in the current study after the Bonferroni correction was applied was calculated as 0·005(Reference Bruce, Pope and Stannistrret22). Following the multivariable analysis, a test of interaction with deprivation was applied, and the a priori value of 0·05 was used for the test of interaction. All analyses were undertaken in STATA 14.2(23).
Results
Descriptive statistics
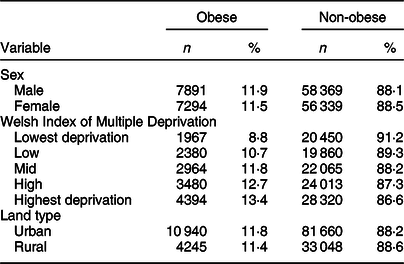
The study sample contained n 129 893 children aged 4–5 years. The mean age of the children was 5·0 years with a sd of 0·4 years. 15 185 (11·7 %) of the total children were classified as having obesity, including 7 891 (52·0 %) boys. The most deprived areas had a higher percentage of children with obesity, see Table 2. More than half (57·9 %, n 7874) of all children with obesity lived in the two most deprived quintiles. The majority of the children lived in an urban area (n 92 600, 71·3 %); of whom, 11·8 % (10 940) were classified as obese (P = 0·029).
Table 2 Childhood measurement programme data in relation to obesity classification
Bivariate analysis
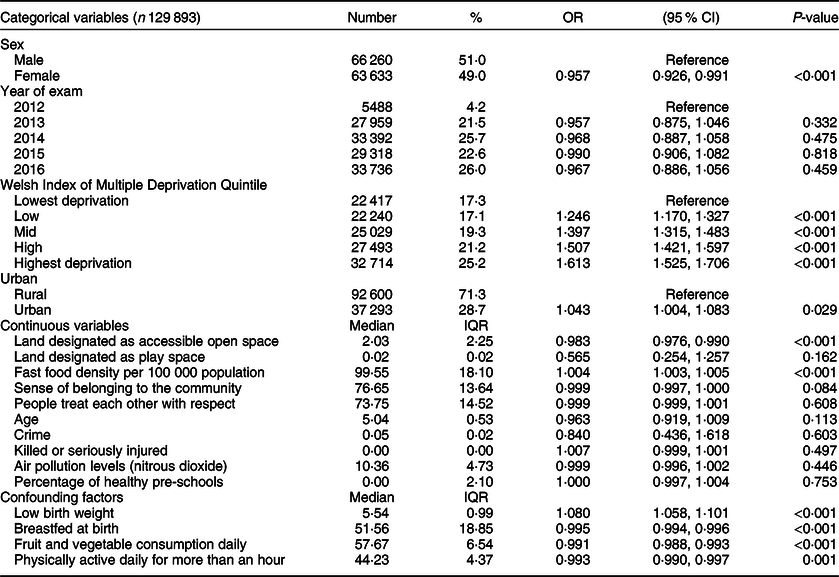
Each potential risk factor was considered in turn. The results of the bivariate analyses are presented in Table 3. Sex and WIMD category were highly associated with obesity in the bivariate analysis, see Table 3. The variables taken forward to the multivariable logistic regression based on the pre-agreed criteria were sex, WIMD, urban or rural residence, feeling a sense of belonging to the community, low birth weight, breast-feeding at birth, being physically active for more than an hour every day, consuming both fruit and vegetables daily, fast food density and percentage of land classified as accessible open space.
Table 3 OR, 95 % CIs and P-values for bivariate analysis for childhood obesity and potential risk factors
Multivariable analysis
The results of the multivariable logistic regression are presented in Table 4. The modifiable population-level risk factors that had associations that were statistically significant after accounting for deprivation following the application of the Bonferroni correction were percentage of land that is classed as accessible open space OR 0·981 (95 % CI 0·973, 0·989, P < 0·001) and density of fast food outlets per 100 000 population OR 1·002 (95 % CI 1·001, 1·004, P = 0·001). There was no interaction with WIMD (2014).
Table 4 Adjusted OR, 95 % CIs and P-values for multi-variate analysis for childhood obesity with population-level risk factors

Adjusted for low birth weight, breast-feeding at birth, fruit and vegetable consumption and physical activity.
* Indicates statistically significant after Bonferroni correction.
Discussion
This large national cross-sectional study found associations between childhood obesity and both open space and fast food density after accounting for deprivation. The associations were as follows: with every one percentage increase in accessible open space, there were 2 % lower levels of childhood obesity. For fast food, the association indicates that for each ten additional fast food outlets (per 100 000 population), there was a 2 % higher level of childhood obesity observed in Wales, UK. Since this is a cross-sectional study, it cannot determine causation. Whilst these are small associations, they are still of public health importance when addressing childhood obesity at the population level. The results indicate that policies which have an impact on environmental factors are an important element of tackling childhood obesity.
The main difficulty encountered in the current study was the lack of data available over time: specifically fast food density and access to open space. Data were only available for 2018, and much of the other data had been collected prior to this, this is the major limitation of the study. Ideally, annual data on fast food outlet density and access to open space would have been matched to the year of child measurement, but this is not available.
There is a dearth of papers that consider population-level risk factors for childhood obesity(Reference Lakes and Burkart24), especially with such a large dataset with such a robust number of variables, and as such our research adds to the evidence base. This gap in the literature exists despite the 2006 recommendation from Ewing et al., to avoid endogeneity, there should be a focus on examining environmental-level risk factors for children and adolescents as children cannot self-select their residence(Reference Ewing, Brownson and Berrigan25). Endogeneity describes how neighbourhood selection can lead to bias in the estimate of associations between the built environment and obesity using observational data, as adults self-select, to varying degrees, where they live or are differentially constrained in their residential choices(Reference Handy, Cao and Mokhtarian26).
The majority of the studies identified in our search of the literature were themselves literature reviews. Some only considered one risk factor: a healthy childcare setting(Reference Swyden, Sisson and Lora27,Reference Sisson, Krampe and Anundson28) or the food environment(Reference Osei-Assibey, Dick and Macdiarmid29). Literature reviews that considered multiple factors included the local food environment and open space and support our findings that both open space and the local food environment are important risk factors for childhood obesity(Reference Hruby and Hu30–Reference Procter33). Only one review included a meta-analysis of data, this considered the difference between urban and rural residence on childhood obesity and concluded that rural children had a greater odds of obesity in the USA(Reference Johnson and Johnson34). This is in contrast to our study where rurality was not identified as an independent risk factor for childhood obesity.
The cross-sectional studies identified were mainly from North America(Reference Yang, Jiang and Xu35–Reference Tu, Mâsse and Lear37). These studies undertook multivariable analyses and adjusted for a comprehensive number of potential confounders and in common with our results found an association between childhood obesity and levels of open space. The number of participants in the cross-sectional studies ranged from n 400 to 41 283; thus, none were on the scale of our study and as such had wide CIs. However, the largest cross-sectional study by Yang et al., 2018(Reference Yang, Jiang and Xu35) reported a significant association between distance to the park and levels of obesity in children OR 1·01 95 % CI 1·00, 1·01 (P < 0·05).
The steady increase in risk of obesity by increasing level of deprivation in children that our study revealed (OR ranging from 1·224 to 1·579) is consistent with studies undertaken in other high-income countries and confers credibility to the results of the current study(Reference Butland, Jebb and Kopelman10,Reference Kinra, Nelder and Lewendon38) .
Other studies that have looked at population variables such as green space or fast food density have mixed findings, and where associations are identified they are of a similar scale to the current study. Lachowycz and Jones(Reference Lachowycz and Jones39) conducted a systematic review of green space and its health impacts, but found only five studies relating to children, of those using objective weight status two showed a positive relationship between obesity and greenspace, two were equivocal and one showed no relationship. Individual-level studies which have assessed fast food outlets in relation to overweight or obesity in children have had mixed results, with negative results reported by Burdette and Whitaker in 2004(Reference Burdette and Whitaker40) and Sturm and Datar in 2005(Reference Sturm and Datar41). This is in contrast to Fraser and Edwards(Reference Fraser and Edwards42) who reported a significant positive correlation between obesity and fast food density of a similar scale to the current study (OR 1·01 95 % CI 1·002, 1·02). The Fraser and Edwards(Reference Fraser and Edwards42) study was another large cross-sectional study undertaken in the UK using data collected from 37 173 children, which concluded that health professionals should educate those taking planning decisions on the impact of fast food outlets on child health.
Our study has three major strengths: first and foremost, the large size and completeness of the national dataset (n 129 894, with uptake of 84·3–94·1 % over the 5 year period), this is evident in the narrow CI, indicating high precision in the results. Second, the height and weight of each child were measured by trained staff using calibrated equipment and standardised protocols, not self-report, reducing measurement bias. The third major strength is the analysis: the consideration of a number of confounding factors reduced the residual confounding and using multiple logistic regression meant that factors that may influence the results, such as socioeconomic group, could be taken into account at the analysis stage(Reference Bruce, Pope and Stannistrret22).
The main limitations of our study are the cross-sectional design and temporality of measurement. This means associations could be identified, but that further research is required to determine causation. A further limitation is the lack of data available on some of the risk factors identified in the literature as potentially having an impact on childhood obesity. Walkability is an example of this: there was minimal existing data. Furthermore, there were no routine data were available on television viewing by local government area which is the most commonly used proxy measure of food promotion, or data to measure any differential in the knowledge and skills of healthcare professionals in managing obesity in children across Wales. The temporal relationship between the variables was addressed as far as possible by using data pertinent to the data collection period, but some of the population-level measures were not available over time, including accessible open space and density of fast food outlets.
The ethnicity variable in the CMP had n 15 698 (12·1 %) with no ethnicity coded, and it was excluded from the analysis based on an a priori parameter of excluding data where more than 10 % was missing to improve data quality. In Wales, approximately 5 % of the population say they are from a non-white background(43), this ranges from 0·8 % in the Isle of Anglesey to 18·4 % in Cardiff which could influence the results. However, we also know that the validity of BMI is limited in children of South Asian and Black African origins(Reference Hudda, Nightingale and Donin44,45) and that including ethnicity without making adjustments may have biased the results.
There is agreement in the literature that the methodology affects the results and that standardisation of measurement is therefore required. As with any emerging field, there is no agreed methodology for determining access to fast food or open space: measures include distance to home, distance to school, number in a radius from home or school, density and ratio of fast food outlets to supermarkets(Reference Johnson and Johnson34,Reference Yang, Jiang and Xu35,Reference Kepper, Tseng and Volaufova46,Reference Miller, Joyce and Carter47) . This hinders comparability and meta-analysis. It may be valuable to develop a validated methodology for measurement of these risk factors.
Data on known confounding factors including physical activity and fruit and vegetable consumption were included. Since food consumption and physical activity are reported by parents, this may include an element of social desirability bias: social desirability is the tendency of an individual to convey an image in keeping with social norms(Reference Hebert, Clemow and Pbert48). However, this is true of all parents, and whilst it may make the effect size smaller, it is unlikely to have affected the results.
The policy direction for obesity in Wales is currently under review: the Welsh Government is consulting on a draft Obesity Strategy. This research will add to the evidence base and influence policy development in relation to childhood obesity. After accounting for deprivation, the population-level risk factors for childhood obesity (4–5 years) that are amenable to change identified in the current study were access to open space and density of fast food outlets. In Wales, public health action could be supported through the use of Health Impact Assessment as set out in the Public Health (Wales) Act (2017) to consider the impact of open space and fast food density in relation to childhood obesity. Finally, our methods can be more widely applied across high-income countries to support policy makers, public health professionals and researchers working to improve the health of the local population to identify associations between obesity in children and the environment in which they live. Public health professionals may wish to consider robust data surveillance techniques that include environmental risk factors such as density of fast food outlets and accessible open space in the future.
There is still much work needed to understand the effect of the built environment on childhood obesity, and since structural changes to the environment are often costly when undertaken in retrospect, a strong evidence base for effectiveness of any intervention is essential. However, where new villages and housing estates are being planned and the built environment can be considered from the outset the cost is lower; thus, public health input at the planning stage to consider both access to open space and the density of fast food outlets in any new housing developments is recommended.
Acknowledgements
Acknowledgements: The authors thank Public Health Wales for the use of the Childhood Measurement Programme data and the number of pre-schools that have achieved ‘Healthy Pre-school’ status; Sustrans for the data on number of schools who have achieved a ‘Sustrans Schools Mark’ and the Welsh Government for the use of the Welsh Health Survey data. Financial support: This research received no specific grant from any funding agency, commercial or not-for-profit sectors. Conflict of interest: No conflicts of interest. No competing financial interests exist. Authorship: C.B. conceived and designed the study, agreed data sharing arrangements, analysed and interpreted the data. N.P., E.F., D.S.H., L.B. and R.R. provided expertise throughout the research process and oversight of the research project. C.B. drafted the article, all authors approved the final version to be published. Ethics of human subject participation: This research was a secondary analysis of existing data and as such no ethical approval was required for the research.


