


Poor diet is a major risk factor of poor health in Australia, contributing at least 7·2 % of the burden of disease(1). The 2013 Australian Dietary Guidelines (ADG) were developed to provide recommendations to help lower the risk of diet-related chronic disease and increase health and well-being(2). However, in the Australian Health Survey Nutrition and Physical Activity Survey 2011–2013, <1 % of all Australians reported consuming a diet consistent with recommendations(3). In particular, mean population intakes were low in vegetables (<4 % meeting the recommended minimum serves (five serves (375 g) per day for adults)) and very high in discretionary items(3,4) (defined as those foods and drinks that are not required for health and are high in saturated fat, added sugar, salt and/or alcohol)(2) which contributed to over 35 % energy intake in adults.
Low socio-economic groups (SEG) suffer poorer diet-related health than the rest of the Australian population, experiencing higher rates of chronic disease such as diabetes, heart disease and some cancers(5–Reference Harris, Fetherston and Calder7). Low SEG in Australia also experience lower rates of food security (defined as when ‘all people, at all times, have physical, social and economic access to sufficient, safe and nutritious food that meets their dietary needs and food preferences for an active and healthy life’(8)) and, paradoxically, higher rates of obesity than other Australians(Reference Friel, Hattersley and Ford9,Reference Burns, Jones and Renzaho10) . Many factors contribute to this inequity of diet-related health, including those strongly influenced by environmental, economic and social determinants, underscored by inequitable distribution of societal resources such as power and wealth(Reference Marmot, Allen and Bell11).
Different methods of categorisation of SEG include assessment of income, occupational skill level or unemployment status, available household assets (e.g., car and home ownership), educational qualifications and/or the clustering of these factors in specific locations(12). All of these important determinants of socio-economic status, together with other specific factors such as levels of stress, available time and food preparation skills, influence choice of foods and drinks(Reference Friel, Hattersley and Ford9,Reference Friel, Pescud and Malbon13) . Low SEG usually have a lower income than others, and lower income households spend significantly less on food and drinks than those with higher incomes(14). For many households, food expenditure is a relatively flexible budget item which may be reduced to accommodate fixed expenditure, such as on housing and utilities, or unexpected expenses(Reference Booth and Smith15,Reference McKenzie16) . One major difference in food expenditure patterns between households of different income groups in Australia relates to meals eaten outside the home, with higher income households spending more on these than lower income households(14). However, this spending difference does not necessarily relate to a healthier dietary intake for household members of either income group and is influenced by availability and access to healthy foods(14).
Given the high rates of poor diet-related health among low SEG in Australia, it has been expected that their diets are even less likely to conform to the ADG than other Australians(Reference Friel, Hattersley and Ford9,Reference Livingstone, Olstad and Leech17,Reference Darmon and Drewnowski18) . Internationally, those in higher SEG tend to consume healthier diets than those in lower SEG including in both high-income and low/middle-income countries(Reference Konstantinos, Vassilios and Panagiotakos19,Reference Mayén, Marques-Vidal and Paccaud20) . However, surprisingly, determination of dietary intake of low SEG in Australia has not been synthesised in a systematic manner previously.
Appendix A of the ADG 2013(2) includes a discussion of the social distribution of food intake, noting that the 1995 National Nutrition Survey (NNS)(21) ‘showed few systematic differences in food and nutrient intake across quintiles of social disadvantage’ as defined by area-level (based both on population and geography) disadvantage(2). Consumption of some broad food groups was found to differ by area-level disadvantage (e.g., intake of fruit, milk, fish and cereals was lower, and intake of sugar products was higher in the most disadvantaged areas compared with others), while consumption of other foods (including vegetables) was not(2). However, these findings were reported as challenging to interpret, due to categorisation of foods in the NNS by historical culinary-based food groups rather than the seven ADG food groups which allow differentiation of healthy and unhealthy foods;(2) for example, potato chips were classified as ‘vegetables’ in the 1995 NNS. Since the NNS in 1995, the Australian Health Survey Nutrition and Physical Activity Survey 2011–2013(4) has been the only NNS in Australia.
Although the underlying factors are extremely complex, better understanding of the specific dietary differences of SEG could inform strategies to help improve nutrition in low SEG. However, this likely requires quantitative information regarding intake of foods, food groups and whole diets.
The aim of this systematic scoping review is to identify detailed dietary intake of low SEG in comparison to that of higher SEG in Australia.
Methods
Search strategy
The search strategy was structured to identify any studies that compared the types and amounts of food and drinks habitually consumed by low SEG with those consumed by higher SEG. It was anticipated that any identified studies would be heterogeneous(2). Therefore, the study design was more consistent with a scoping review than a comprehensive systematic review, and the search strategy was informed by the methodology for Joanna Briggs Institute Scoping Reviews Methodology(22). The research question was considered in population, intervention, comparator, outcome and time format and the Preferred Reporting Items for Systematic Reviews and Meta-Analyses(23) statement was used to guide review processes.
The search population included Australians of any age and gender categorised as belonging to a low SEG by any method.
The intervention was defined as a study which captured the dietary intake of the population of interest. The comparator was the dietary intake of Australians of any age or gender categorised as belonging to a higher SEG than the search population.
Outcomes were defined as types and amounts of dietary intake, either as an assessment of the full diet, or selected food groups, or as foods or drinks.
The search timeframe was restricted to documents published from January 1999 to September 2019, as it was considered that earlier documents may lack relevance due to changes in the social and food industry landscape and dietary patterns of Australians over the last 20–25 years(4).
Databases of peer-reviewed literature and targeted websites were searched, and all included references were also hand-searched for any missing relevant documents. All stages of the search and data extraction process were conducted by M.L., with 10 % of abstracts and data extractions cross checked by A.L. to control for inter-observer bias.
The peer-reviewed literature databases searched were The Cochrane Library, PubMed, MEDLINE, EMBASE, CINAHL, Informit Health Collection and Web of Science (Science Citation Index and Conference Proceedings Citation Index).
The search terms used were (nutrition OR diet OR diets OR food OR foods OR drinks) AND (consum* OR purchas* OR buy OR intake) AND (low-income OR low income OR low socioeconomic) AND Australia. Low income was used as a proxy for a low SEG as it is used frequently in research relating to the affordability of healthy diets(Reference Barosh, Friel and Engelhardt24–Reference Lee, Kane and Lewis26). Other potential search terms as proxies for low SEG, such as ‘education level’ and ‘deprivation’, were tested but found to lack specificity to SEG and did not lead to the identification of any additional studies. Location was restricted to Australia, as dietary intake and socio-economic structures are influenced by many country-specific social and economic issues; thus, overseas findings would potentially be less applicable to the Australian situation. Food purchasing terms were included in the search as a potential proxy for dietary intake.
The listed databases were searched and resulting citations were downloaded into EndNote X8(27). Duplicates were removed, and the following inclusion and exclusion criteria were systemically applied to screen remaining citations, based on title, then abstract, then full text.
Inclusion criteria
-
Studies that describe ‘usual’ individual and/or household intake of foods and/or drinks, and/or diet,
-
Studies that differentiate dietary data by a socio-economic measure,
-
All types of studies and
-
Studies with the subjects located in Australia.
Exclusion criteria
-
Any study not including human individuals or households located in Australia,
-
Any study which did not report dietary intake differentiated by a socio-economic measure,
-
Any study solely qualitatively assessing the factors influencing dietary intake of low SEG,
-
Any study reporting dietary intake that did not reflect ‘usual’ diet, for example, dietary intervention trial or
-
Any study where dietary intake was only presented in terms of nutrients, rather than foods.
The websites searched were The Australian Prevention Partnership Centre/The Sax Institute, Australian Health Policy Collaboration, Public Health Association of Australia, National Health and Medical Research Council, National Preventive Health Agency, Commonwealth Health Department, Australian Institute of Health and Welfare and the Grattan Institute. Search terms ((Diet OR nutrition) AND (socio-economic OR income)) were systematically entered into each website-specific search engine. The first five page returns or the first ten items listed (when sorted by relevance) from each search were scrutinised.
Data extraction
Data were extracted by the following fields: study author and date, data set used, type of study, location, age group and gender of participants, sample size, dietary assessment method used, foods or food groups investigated, results of dietary intake (by food group) of different SEG (as reported in the studies), reporting method and socio-economic assessment measure/s used.
Data synthesis and analysis
The data extraction table was scrutinised to determine if the location, age and gender of the populations of the included studies were broadly representative of the Australian population. The frequency of use of different dietary assessment methods, food groups studied and socio-economic measures were summarised. Finally, the synthesised results of any dietary differences between SEG were assessed for agreement between studies.
Results
After application of the search strategy, thirty-three publications, comprising thirty-two peer-reviewed studies and one non-peer-reviewed report prepared by the Australian Institute of Health and Welfare (‘the AIHW report’)(28) were included. The Preferred Reporting Items for Systematic Reviews and Meta-Analyses diagram is provided in Fig. 1. The data extraction table for all included studies is provided as see online supplementary material, Supplemental Table S1. An overview of data extracted from the included studies is provided in Table 1.

Fig. 1 Preferred Reporting Items for Systematic Reviews and Meta-Analyses flow chart dietary intake
Table 1 Overview of included studies (n 33*)

SSB, sugar-sweetened beverages.
* Note that the numbers may not add to 33 or 100 % in all categories, due to inclusion of multiple options.
Population
Study type and size
All of the included studies (n 33) were of a cross-sectional design, with the data being collected at a single time point.
Study size varied from 243 to 206 457 participants, with the majority of studies (n 23/33, 70 %) having more than 1000 participants.
Definition of ‘low socio-economic’ group
The measures used to define and categorise SEG by authors of the included studies are shown in Table 2. The most common measures used were income (n 24, 73 %) and the highest attained education level of participants (or a parent in the case of child participants) (n 22, 67 %).
Table 2 Measures used to assess socio-economic status

HH, household; SEIFA IRSD, Socio-Economic Indexes for Areas Index of Relative Socio-economic Disadvantage; AIHW, Australian Institute of Health and Welfare.
In those twenty-four studies (73 %) categorising SEG by income, the participants were differentiated into income ranges dichotomously or by tertiles, quartiles or quintiles. Income was mostly defined as household income (n 22); however, two studies defined it as individual income(Reference Brennan and Singh29,Reference Inglis, Ball and Crawford30) . Regardless of the ranges applied, the lowest income group was defined in the majority of these studies (n 17, 71 %) as receiving a household or personal income of less than $AUD 30 k per annum (p.a.). Two studies (8 %), however, defined the lowest income group as receiving less than $AUD 40 k per household(Reference Kunaratnam, Halaki and Wen31,Reference Martin, Moran and Teede32) and one as receiving less than $AUD 60 k per household p.a.(Reference Zarnowiecki, Ball and Parletta33). Similarly, the highest household income group definition varied from greater than $AUD 52 k p.a. (9 %) to greater than $AUD 104 k p.a. (5 %). The definition of the highest individual income group varied from greater than $AUD 20 k p.a.(Reference Brennan and Singh29) to greater than $AUD 52 k p.a.(Reference Inglis, Ball and Crawford30).
In those twenty-two studies (67 %) categorising SEG by education level attained, education level was divided into two to six categories, most commonly four (n 10, 45 %) comprising: no post-high school education, a diploma/certificate qualification, a vocational qualification or a university qualification (Table 2). The definition of a ‘vocational’ qualification was not provided, although studies using this category placed it below a ‘diploma’ and above ‘no post-school’ in their hierarchy.
Nine of the thirty-two peer-reviewed studies and the AIHW report (n 10, 30 %) categorised SEG by a measure of disadvantage based on the area in which the study participants lived(Reference Livingstone, Olstad and Leech17,28,Reference Martin, Moran and Teede32,Reference Feng and Astell-Burt34–Reference Hardy, Baur and Wen40) . All except one of these studies(Reference Turrell, Bentley and Thomas38) used the Socio-Economic Indexes for Areas Index of Relative Socioeconomic Disadvantage developed by the Australian Bureau of Statistics(12). One study (3 %) used a proxy measure for income – whether the household held a ‘health-care card’ – this is a welfare card issued, depending on household income, by the Australian government that allows access to subsidised medications, among other benefits(Reference Terry, Ervin and Soutter41). Two studies (6 %) used a participant self-rated socio-economic measure(Reference Gasser, Mensah and Kerr35,Reference Chung, Peeters and Gearon42) . Of the included thirty-three papers, two (6 %) outlined a composite metric comprising occupation, education and income, although details of these measures were not reported(Reference Gasser, Mensah and Kerr35,Reference Chung, Peeters and Gearon42) . One study (3 %) did not provide any description of the socio-economic measure applied(Reference Beckford, Grimes and Riddell43).
The majority of the thirty-three studies (n 26, 79 %) used two or more measures to describe and/or categorise the participants’ SEG. Dietary intake data were often reported separately for each measure, although three studies combined data to produce overall results by SEG(Reference Zarnowiecki, Ball and Parletta33,Reference Gasser, Mensah and Kerr35,Reference Grech, Rangan and Allman-Farinelli36) .
Age, gender and location of participants
Adult participants aged 18–65 years were studied most frequently in the thirty-three included papers (n 25, 76 %), with older age participants (>65 years) also commonly studied (n 14, 42 %). Eight peer-reviewed studies and the AIHW report (n 9, 27 %) included children aged 2–13 years(28,Reference Kunaratnam, Halaki and Wen31,Reference Zarnowiecki, Ball and Parletta33,Reference Gasser, Mensah and Kerr35,Reference Hardy, Baur and Wen40–Reference Renzaho, Kumanyika and Tucker44) . Teenagers (13–17 years) were included in only six peer-reviewed studies and the AIHW report (n 7, 21 %)(28,Reference Kunaratnam, Halaki and Wen31,Reference Gasser, Mensah and Kerr35,Reference Hardy, Baur and Wen40,Reference Beckford, Grimes and Riddell43,Reference Giskes, Turrell and Patterson45,Reference Venn and Strazdins46) . No studies included infants aged 0–2 years. Seven papers (21 %) included women only(Reference Inglis, Ball and Crawford30–Reference Martin, Moran and Teede32,Reference McLeod, Campbell and Hesketh47–Reference Wen, Flood and Simpson50) . Studies using the Brisbane Food Study (BFS) (2000) methods (n 7, 21 %)(Reference Brennan and Singh29,Reference Turrell, Bentley and Thomas38,Reference Turrell, Blakely and Patterson39,Reference McKinnon, Giskes and Turrell51–Reference Turrell and Kavanagh54) reported data on purchases made for a household as reported by the main household shoppers, mainly women.
The most common location was a major city, with fifteen studies (45 %) including participants solely from such cities. Eleven peer-reviewed papers and the AIHW report (n 12, 36 %) used national data(2,Reference Livingstone, Olstad and Leech17,28,Reference Gasser, Mensah and Kerr35–Reference Olstad, Leech and Livingstone37,Reference Chung, Peeters and Gearon42,Reference Beckford, Grimes and Riddell43,Reference Giskes, Turrell and Patterson45,Reference Venn and Strazdins46,Reference Giskes, Turrell and Patterson55–Reference Worsley, Blaschea and Ball57) ; another four (12 %) were state-wide(Reference Feng and Astell-Burt34,Reference Hardy, Baur and Wen40,Reference Renzaho, Kumanyika and Tucker44,Reference Thornton, Pearce and Ball48) and one (3 %) focused on a rural location(Reference Terry, Ervin and Soutter41). One study (3 %) included participants from a major city together with those from a rural location(Reference Martin, Moran and Teede32).
Representation of different cultural groups was not reported in any of the included studies. For example, no study included results differentiated by Aboriginal and/or Torres Strait Islander status.
Dietary intake
Data sets used
All except five studies (15 %)(Reference Brennan and Singh29,Reference Zarnowiecki, Ball and Parletta33,Reference Turrell, Bentley and Thomas38,Reference Terry, Ervin and Soutter41,Reference Ball, Crawford and Mishra49) included secondary analysis of prior collected data sets (see online supplementary material, Supplemental Table S1), most commonly the BFS (2000) (n 5, 15 %)(Reference Turrell, Blakely and Patterson39,Reference McKinnon, Giskes and Turrell51–Reference Turrell and Kavanagh54) . National survey data sets utilised included the Australian Health Survey Nutrition and Physical Activity Survey 2011–2013 (n 4, 12 %)(Reference Livingstone, Olstad and Leech17,28,Reference Grech, Rangan and Allman-Farinelli36,Reference Olstad, Leech and Livingstone37) , the Longitudinal Study of Australian Children (n 2, 6 %)(Reference Gasser, Mensah and Kerr35,Reference Chung, Peeters and Gearon42) , the Australian National Children’s Nutrition and Physical Activity Survey (n 1, 3 %)(Reference Beckford, Grimes and Riddell43) and the Household Income and Labour Dynamics in Australia (HILDA) survey (n 1, 3 %)(Reference Venn and Strazdins46). Four studies(Reference Giskes, Turrell and Patterson45,Reference Giskes, Turrell and Patterson55–Reference Worsley, Blaschea and Ball57) (12 %) utilised data from the NNS(21), which was conducted in 1995, that is, prior to the 1999 time frame. However, as the studies were published after 1999, and due to the infrequency of large-scale national surveys of dietary intake in Australia, these papers were included.
Other sub-national data sets used included: the BFS (2000) (n 5, 15 %)(Reference Turrell, Blakely and Patterson39,Reference McKinnon, Giskes and Turrell51–Reference Turrell and Kavanagh54) , the 45 and Up Study (n 1, 3 %)(Reference Feng and Astell-Burt34), the New South Wales Schools Physical Activity and Nutrition Survey (n 1, 3 %)(Reference Hardy, Baur and Wen40), the Socioeconomic Status and Activity in Women (n 1, 3 %) study(Reference Inglis, Ball and Crawford30), the Healthy Beginnings Trial (n 1, 3 %)(Reference Kunaratnam, Halaki and Wen31), the Healthy Lifestyles (HeLP-her) study (n 1, 3 %)(Reference Martin, Moran and Teede32), the Melbourne InFANT Program (n 1, 3 %)(Reference McLeod, Campbell and Hesketh47), the Brisbane Food Frequency Study 2009 (n 2, 6 %)(Reference Miura, Giskes and Turrell58,Reference Miura, Giskes and Turrell59) , the Victorian Child’s Healthy and Wellbeing (n 1, 3 %)(Reference Renzaho, Kumanyika and Tucker44) and the Resilience for Eating and Activity Despite Inequality study (n 1, 3 %)(Reference Thornton, Pearce and Ball48).
Dietary intake assessment
Of the thirty-three included papers, six peer-reviewed studies and the AIHW report (n 7, 21 %) used dietary intake data assessed by 24 h recall, where the types and amounts of all food and drinks consumed by participants over the previous 24 h period were recorded and analysed(Reference Livingstone, Olstad and Leech17,28,Reference Grech, Rangan and Allman-Farinelli36,Reference Olstad, Leech and Livingstone37,Reference Beckford, Grimes and Riddell43,Reference Giskes, Turrell and Patterson45,Reference Giskes, Turrell and Patterson55) . The majority of studies (n 19, 58 %) used dietary intake data assessed by a FFQ, where participants provided information of how often, and sometimes how much, they usually consumed of each item of a selected list of food and drinks.
Seven (21 %) of the included studies used the methods and/or data from the BFS (2000), where household purchases were described using a list of sixteen grocery items, each item providing two different options identified as ‘recommended’ (i.e., better nutritional choices) or ‘regular’; for example, whether tinned tuna in water or oil was purchased most frequently(Reference Brennan and Singh29,Reference Turrell, Bentley and Thomas38,Reference Turrell, Blakely and Patterson39,Reference McKinnon, Giskes and Turrell51–Reference Turrell and Kavanagh54) . There is very low alignment between this method of identifying ‘healthy diets’ and the recommendations of the ADG (see ‘Discussion’ section), and as such the results from these studies were not included in subsequent analysis(60).
Dietary intake measures
A variety of methods was used to report dietary intake data in the thirty-three included papers. Dichotomous measures were most commonly used (n 11, 33 %)(Reference Inglis, Ball and Crawford30,Reference Kunaratnam, Halaki and Wen31,Reference Olstad, Leech and Livingstone37,Reference Hardy, Baur and Wen40,Reference Chung, Peeters and Gearon42,Reference Renzaho, Kumanyika and Tucker44–Reference Venn and Strazdins46,Reference Thornton, Pearce and Ball48,Reference Worsley, Blasche and Ball56,Reference Worsley, Blaschea and Ball57) , including ‘consumed/not consumed’ or ‘met/did not meet’ a set number of serves per day of a particular food group relevant for the age and gender of the participants. In three studies (9 %)(Reference Kunaratnam, Halaki and Wen31,Reference Renzaho, Kumanyika and Tucker44,Reference Venn and Strazdins46) , the reference amounts per day were set as per the ADG(2). Five peer-reviewed studies and the AIHW report (n 6, 18 %) reported intake data by the continuous metrics of grams or serves per day or week(28,Reference Terry, Ervin and Soutter41,Reference Giskes, Turrell and Patterson45,Reference Ball, Crawford and Mishra49,Reference Giskes, Turrell and Patterson55,Reference Miura, Giskes and Turrell58) .
Four studies (12 %) reported dietary intake using diet quality indices, with a single score representing the whole diet(Reference Livingstone, Olstad and Leech17,Reference Martin, Moran and Teede32,Reference Grech, Rangan and Allman-Farinelli36,Reference McLeod, Campbell and Hesketh47) . These indices incorporated other elements in addition to the type and amount of food and drinks consumed, such as whether meat fat was trimmed. Two of these studies also provided individual scores for composite food groups(Reference Livingstone, Olstad and Leech17,Reference McLeod, Campbell and Hesketh47) .
A further ten studies (30 %) used a variety of derived scores to reflect intake of one or more component/s of the diet, including the seven BFS (2000) studies(Reference Brennan and Singh29,Reference Feng and Astell-Burt34,Reference Gasser, Mensah and Kerr35,Reference Turrell, Bentley and Thomas38–Reference Hardy, Baur and Wen40,Reference McKinnon, Giskes and Turrell51–Reference Turrell and Kavanagh54) .
Food groups reported
The intake of various food groups, or selected foods therein, reported by the included studies is shown in Table 3. All food groups discussed below refer to those defined by the ADG(2).
Table 3 Dietary intake measures and reported results

F&V, fruit and vegetables; ADG, Australian Dietary Guidelines 2013; 24 h, 24 h recall; N/A, food group investigated, but individual result for food group not available; G, socio-economic status derived from a combination of measures; E, education level used as a measure of socio-economic status; I, income used as a measure of socio-economic status; A, area-level disadvantage used as a measure of socio-economic status; -, no significant difference between socio-economic groups; –, food group not investigated in the current; ↓, intake of lowest socio-economic group assessed in study to be ‘less healthy’ than a higher socio-economic group; Selected, only a few selected foods within the food group were studied/reported; AIHW, Australian Institute of Health and Welfare; BFS Methods, Brisbane Food Study where type of food usually purchased is studied rather than dietary intake – excluded from further analysis (see ‘Results’ and ‘Discussion’ sections); Occ, occupation used as a measure of socio-economic status; O, other measures of socio-economic status applied (e.g., composite measure).
Only four (12 %) of the studies reported on the whole diet, including all ADG food groups(Reference Livingstone, Olstad and Leech17,Reference Martin, Moran and Teede32,Reference Grech, Rangan and Allman-Farinelli36,Reference McLeod, Campbell and Hesketh47) . Two studies (6 %) reported intake of highly selected single foods only but did not report data for any drinks(Reference Worsley, Blasche and Ball56,Reference Worsley, Blaschea and Ball57) . The seven (21 %) BFS (2000) studies investigated usual purchases of tinned fruit and juice, highly selected dairy foods, meats, grains and healthy oils and spreads only. Of the remaining twenty studies, all but three(Reference Chung, Peeters and Gearon42,Reference Beckford, Grimes and Riddell43,Reference Miura, Giskes and Turrell59) (n 17, 52 %) reported fruit and vegetable intake, with three of these excluding potato(Reference Giskes, Turrell and Patterson45,Reference Giskes, Turrell and Patterson55,Reference Miura, Giskes and Turrell58) . Three of the whole diet studies(Reference Livingstone, Olstad and Leech17,Reference Grech, Rangan and Allman-Farinelli36,Reference McLeod, Campbell and Hesketh47) , six of the BFS studies(Reference Turrell, Bentley and Thomas38,Reference Turrell, Blakely and Patterson39,Reference McKinnon, Giskes and Turrell51–Reference Turrell and Kavanagh54) and four other studies(Reference Zarnowiecki, Ball and Parletta33,Reference Giskes, Turrell and Patterson45,Reference Worsley, Blasche and Ball56,Reference Worsley, Blaschea and Ball57) also assessed fruit and vegetable variety.
One peer-reviewed study and the AIHW report (n 2, 6 %) presented intake of all milk, yogurt, cheese and alternatives(28,Reference Gasser, Mensah and Kerr35) , while five (15 %) reported milk intake only(Reference Kunaratnam, Halaki and Wen31,Reference Feng and Astell-Burt34,Reference Terry, Ervin and Soutter41,Reference Thornton, Pearce and Ball48,Reference Wen, Flood and Simpson50) . The AIHW report presented intake of all lean meats, poultry, fish, eggs, tofu, nuts and seeds, and legumes/beans (‘lean meat and alternatives’ group)(28), whereas one peer-reviewed study reported intake of selected meat products only(Reference Feng and Astell-Burt34). The AIHW report presented intake of all grain (cereal) foods(28), and one peer-reviewed study reported intake of selected grains only(Reference Wen, Flood and Simpson50). Intake of healthy oils and spreads was considered in those studies reporting the whole diet, but no others.
Four studies (12 %) reported intake of all discretionary food and drinks(Reference Kunaratnam, Halaki and Wen31,Reference Zarnowiecki, Ball and Parletta33,Reference Gasser, Mensah and Kerr35,Reference Terry, Ervin and Soutter41) , four studies reported consumption of takeaway foods only(Reference Inglis, Ball and Crawford30,Reference Wen, Flood and Simpson50,Reference Miura, Giskes and Turrell58,Reference Miura, Giskes and Turrell59) , four studies reported intake of highly selected discretionary food and/or drinks(Reference Hardy, Baur and Wen40,Reference Chung, Peeters and Gearon42,Reference Beckford, Grimes and Riddell43,Reference Venn and Strazdins46) and only one study (3 %) included alcohol intake(Reference Feng and Astell-Burt34).
As noted in the Introduction, the NNS categorised dietary intake by historical culinary-based food groups, where food products and mixed dishes were classified by their major ingredient (e.g., pizza was classified as a ‘cereal-based product’)(61). This could have created challenges in interpreting the ‘healthiness’ of dietary intake, as reported results did not correspond to the healthy ADG food groups or discretionary groups; however, all included studies using the NNS data set (n 4, 12 %) reported intake of fruits and vegetables(Reference Giskes, Turrell and Patterson45,Reference Giskes, Turrell and Patterson55) , which did align with ADG food groups or intake of selected individual foods(Reference Worsley, Blasche and Ball56,Reference Worsley, Blaschea and Ball57) .
Assessments of dietary intake of low socio-economic groups
As shown in Table 3, no included studies found that low SEG consumed diets or foods considered ‘healthier’ than those consumed by higher SEG; either no statistically significant difference was found between dietary intake of SEG or the dietary intake of low SEG was assessed as being ‘less healthy’ than that of higher SEG. ‘Less healthy’ was defined variously as: group mean consuming less of one of the five food groups, a smaller proportion of participants consuming above a set quantity of one of the five food groups per day, group mean consuming more discretionary food and drinks, a larger proportion of participants consuming above a set quantity of discretionary food and drinks per day and/or having a lower diet quality score.
Quantitative data
The included studies providing quantitative dietary intake data were highly heterogeneous. None of these studies provided quantitative intake for all ADG food groups; in particular, no study reported quantitative intakes for healthy oils and spreads, or discretionary food and drinks, including alcohol (Table 4). All quantities of fruit and vegetables reported by serves per day have been converted to g/d in Table 4, using the ADG serve sizes of 150 g/serve of fruit and 75 g/serve of vegetables(62). For all other food groups, intakes are shown as reported by varieties per day or serves per day. Different socio-economic measures were applied in each of the six studies (18 %) reporting dietary intake data by continuous metrics(28,Reference Terry, Ervin and Soutter41,Reference Giskes, Turrell and Patterson45,Reference Ball, Crawford and Mishra49,Reference Giskes, Turrell and Patterson55,Reference Miura, Giskes and Turrell58) .
Table 4 Quantitative results of dietary intake by socio-economic group (SEG)
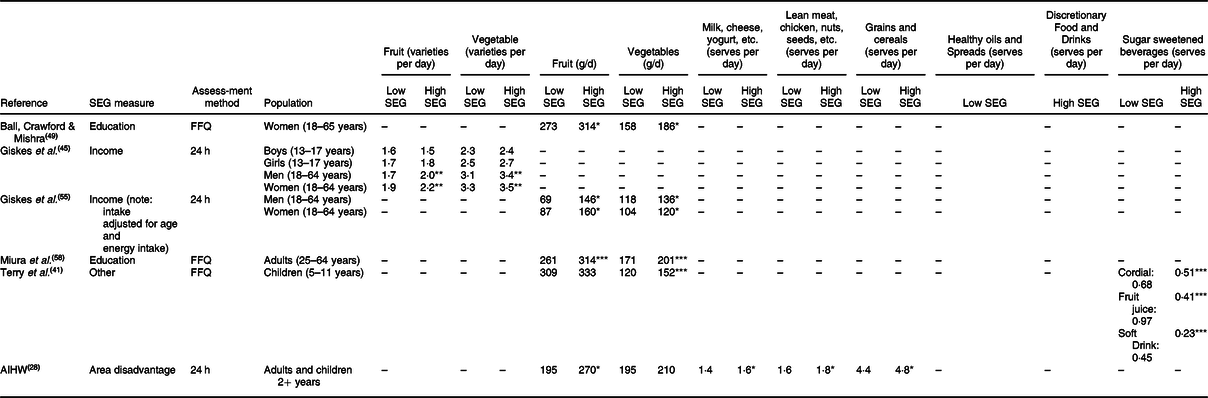
24 h, 24 h recall; AIHW, Australian Institute of Health and Welfare; –, Food group not investigated in the current study.
Significant difference to low SEG at *P < 0·05, **P < 0·01, ***P < 0·001.
Fruit and vegetable intake was the only ADG food groups where continuous quantitative data were reported by multiple studies(28,Reference Terry, Ervin and Soutter41,Reference Giskes, Turrell and Patterson55,Reference Miura, Giskes and Turrell58) . Each of these utilised a different socio-economic measure to categorise low and high SEG and investigated dietary intake in different age groups, and one study(Reference Giskes, Turrell and Patterson55) adjusted fruit and vegetable intakes for the age and total energy intake of participants. Hence, there was wide variation in the findings.
Giskes et al.(Reference Giskes, Turrell and Patterson55) found that, compared with those in high SEG, men and women in low SEG consumed around 50 % less fruit and 14 % less vegetables per day. In the adults studied by Miura et al.(Reference Miura, Giskes and Turrell58) and the women studied by Ball et al.(Reference Ball, Crawford and Mishra49), these proportions were approximately 15 % less fruit and vegetables per day. Terry et al.(Reference Terry, Ervin and Soutter41) found that, compared with those in high SEG, children in low SEG consumed 22 % less vegetables but observed no significant difference in intake of fruit between groups. Considering adults and children together, the Australian Institute of Health and Welfare(28) found consumption of fruit was 18 % less in low SEG than high SEG but observed no significant difference in vegetable intake between the SEG.
The Australian Institute of Health and Welfare(28) also found that, compared with those in high SEG, adults and children in low SEG consumed 12 % less milk, cheese, yogurt and alternatives, 12 % less lean meats and alternatives and 8 % less grain (cereal) foods per day.
Across the heterogeneous studies, analysis of the reported intakes of fruit by low SEG varied from 69(Reference Giskes, Turrell and Patterson55) to 309 g/d(Reference Terry, Ervin and Soutter41). Similarly, the reported intakes of fruit by high SEG varied from 146(Reference Giskes, Turrell and Patterson55) to 333 g/d(Reference Terry, Ervin and Soutter41). Reported intakes of vegetables by low SEG varied from 104(Reference Giskes, Turrell and Patterson55) to 195 g/d(28), and reported intake by high SEG varied from 120(Reference Giskes, Turrell and Patterson55) to 210 g/d(28).
Whole diet and component food group studies
All four studies (12 %) that assessed the whole diet intake computed diet quality indices and found that low SEG (categorised by income, education and/or area disadvantage) had lower total diet quality scores than higher SEG (Table 3)(Reference Livingstone, Olstad and Leech17,Reference Martin, Moran and Teede32,Reference Grech, Rangan and Allman-Farinelli36,Reference McLeod, Campbell and Hesketh47) . However, in the two studies that investigated food group component scores, McLeod et al.(Reference McLeod, Campbell and Hesketh47) and Livingstone et al.(Reference Livingstone, Olstad and Leech17), statistically significant differences between these scores were not identified consistently (Table 5)(Reference Livingstone, Olstad and Leech17,Reference McLeod, Campbell and Hesketh47) . The two whole diet studies that utilised education as a socio-economic measure(Reference Livingstone, Olstad and Leech17,Reference McLeod, Campbell and Hesketh47) found that groups with less educational opportunities had lower diet quality component scores compared with higher educated groups for fruit and vegetable variety, and intake of vegetables, and milk, cheese, yogurt and alternatives(Reference Livingstone, Olstad and Leech17,Reference McLeod, Campbell and Hesketh47) In one of these studies, lower scores were found for less educated groups compared with higher educated groups for intake of fruit, grains and discretionary food and drinks(Reference Livingstone, Olstad and Leech17), but the other study found no difference between SEG in intake of these food groups(Reference McLeod, Campbell and Hesketh47). No difference in diet quality score between SEG was found in either study for food group intake of lean meat and alternatives or alcohol(Reference Livingstone, Olstad and Leech17,Reference McLeod, Campbell and Hesketh47) .
Table 5 Quantitative diet quality scores by socio-economic groups (SEG; score out of 10 except where stated)

Significant difference to low SEG at *P < 0·05, **P < 0·01, ***P < 0·001.
The whole diet study that also utilised income as a socio-economic measure found low income groups had lower diet quality scores than higher income groups for fruit and vegetable variety, and intake of fruit, milk, cheese, yogurt and alternatives, and lean meat and alternatives, but found no difference in scores for intake of vegetable, grains (cereals), healthy oils and spreads, discretionary food and drinks as a whole or alcohol intakes(Reference Livingstone, Olstad and Leech17).
When the same whole diet study utilised area-level disadvantage as a socio-economic measure, participants living in more disadvantaged areas were found to have lower diet quality scores than those living in less disadvantaged areas for fruit and vegetable variety, and intake of milk, cheese, yogurt and alternatives, and lean meat and alternatives, but no difference was observed in scores for intake of fruit, vegetables, grains (cereals), healthy oils and spreads, discretionary food and drinks as a whole or alcohol(Reference Livingstone, Olstad and Leech17).
Partial diet studies
Fruit intake
Seven of the eight partial diet studies reporting fruit intake of SEG categorised by education level found fruit intake was lower in less educated groups than higher educated groups;(Reference Inglis, Ball and Crawford30,Reference Olstad, Leech and Livingstone37,Reference Renzaho, Kumanyika and Tucker44,Reference Thornton, Pearce and Ball48–Reference Wen, Flood and Simpson50,Reference Miura, Giskes and Turrell58) however, the other study found no difference(Reference Kunaratnam, Halaki and Wen31) (Table 3). Four of the nine partial diet studies reporting fruit intake by SEG by income found fruit intake was lower in lower income groups than higher income groups;(Reference Kunaratnam, Halaki and Wen31,Reference Giskes, Turrell and Patterson45,Reference Wen, Flood and Simpson50,Reference Giskes, Turrell and Patterson55) however, the other five studies found no difference(Reference Inglis, Ball and Crawford30,Reference Olstad, Leech and Livingstone37,Reference Renzaho, Kumanyika and Tucker44,Reference Venn and Strazdins46,Reference Thornton, Pearce and Ball48) . One of the three partial diet studies reporting fruit intake by SEG by area-level disadvantage found fruit intake was lower in participants living in more disadvantaged areas than less disadvantaged areas;(28) however, the other two studies found no difference(Reference Olstad, Leech and Livingstone37,Reference Hardy, Baur and Wen40) . The single partial diet study reporting fruit intake by SEG by other measures found no difference in intake between groups(Reference Terry, Ervin and Soutter41).
Vegetable intake
Five of the eight partial diet studies reporting vegetable intake of SEG categorised by education found intake was lower in less educated groups than higher educated groups;(Reference Inglis, Ball and Crawford30,Reference Renzaho, Kumanyika and Tucker44,Reference Thornton, Pearce and Ball48,Reference Ball, Crawford and Mishra49,Reference Miura, Giskes and Turrell58) however, the other three studies found no difference(Reference Kunaratnam, Halaki and Wen31,Reference Olstad, Leech and Livingstone37,Reference Wen, Flood and Simpson50) (Table 3). Three of the nine partial diet studies reporting vegetable intake by SEG by income found intake was lower in lower income groups than higher income groups;(Reference Giskes, Turrell and Patterson45,Reference Giskes, Turrell and Patterson55,Reference Miura, Giskes and Turrell58) however, the other six studies found no difference(Reference Inglis, Ball and Crawford30,Reference Kunaratnam, Halaki and Wen31,Reference Olstad, Leech and Livingstone37,Reference Renzaho, Kumanyika and Tucker44,Reference Venn and Strazdins46,Reference Thornton, Pearce and Ball48) . All three partial diet studies reporting vegetable intake by SEG by area-level disadvantage found no difference in vegetable intake between areas(28,Reference Olstad, Leech and Livingstone37,Reference Hardy, Baur and Wen40) . The single partial diet study reporting vegetable intake by SEG by other measures found intake to be lower in lower SEG compared with higher SEG(Reference Terry, Ervin and Soutter41).
Fruit and vegetable variety
Of the thirteen studies (39 %) that investigated fruit and vegetable variety, five studies reported the data by SEG categorised by education level, income and area-level disadvantage and found that the number of different types of fruit and vegetables consumed was lower in lower SEG compared with higher groups(Reference Livingstone, Olstad and Leech17,Reference Giskes, Turrell and Patterson45,Reference McLeod, Campbell and Hesketh47,Reference Worsley, Blasche and Ball56,Reference Worsley, Blaschea and Ball57) .
Intake of milk, yogurt, cheese and alternatives
The single partial diet study reporting dietary intake of all milk, cheese, yogurt and alternative foods by SEG categorised by area-level disadvantage found a lower intake in participants living in more disadvantaged areas than less disadvantaged areas (Table 3)(28).
Two of the three partial diet studies reporting milk intake by SEG by education found milk intake was lower in less educated groups compared with higher educated groups;(Reference Thornton, Pearce and Ball48,Reference Wen, Flood and Simpson50) however, the other study found no difference(Reference Kunaratnam, Halaki and Wen31). The two partial diet studies reporting milk intake by SEG by income found no difference in intake(Reference Thornton, Pearce and Ball48,Reference Wen, Flood and Simpson50) .
Intake of lean meat and alternatives
The single partial diet study reporting intake of lean meats and alternatives by SEG categorised by area-level disadvantage found lower intakes in participants living in more disadvantaged areas than less disadvantaged areas (Table 3)(28).
Grains (cereals) intake
The single partial diet study reporting intake of all grain (cereal) foods by SEG categorised by area-level disadvantage found a lower intake in participants living in more disadvantaged areas than less disadvantaged areas (Table 3)(28). The single partial diet study reporting intake of selected grains foods (breakfast cereals, pasta, rice or noodles) by SEG by education found a lower intake in less educated groups than more educated groups; however, no difference was found in intake between income groups(Reference Wen, Flood and Simpson50).
Discretionary food and drink intake
As shown in Table 3, the single partial diet study(Reference Kunaratnam, Halaki and Wen31) reporting intake of all discretionary foods (not including drinks) by SEG categorised by education found no difference between groups. However when discretionary food intake in the current study was reported by income, it was found to be higher in low income groups than higher income groups(Reference Kunaratnam, Halaki and Wen31).
Both partial diet studies reporting intake of sugar-sweetened beverages (SSB) by SEG by education found SSB intake was higher in less educated groups than higher educated groups(Reference Kunaratnam, Halaki and Wen31,Reference Wen, Flood and Simpson50) . One of the two partial diet studies reporting SSB intake by SEG by income found SSB intake was higher in lower income groups than higher income groups(Reference Wen, Flood and Simpson50); however, no difference was found in the other study(Reference Kunaratnam, Halaki and Wen31). All three partial diet studies reporting SSB intake by SEG by other measures found intake was higher in low SEG compared with higher SEG(Reference Terry, Ervin and Soutter41–Reference Beckford, Grimes and Riddell43).
Three of the four partial diet studies reporting takeaway food intake by SEG by education found intake was higher in less educated groups than higher educated groups;(Reference Wen, Flood and Simpson50,Reference Miura, Giskes and Turrell58,Reference Miura, Giskes and Turrell59) however, no difference was found in the other study(Reference Inglis, Ball and Crawford30).
All partial diet studies reporting takeaway food intake by SEG by income (n 3) found intake was higher in lower income groups than higher income groups(Reference Inglis, Ball and Crawford30,Reference Kunaratnam, Halaki and Wen31,Reference Miura, Giskes and Turrell59) .
Summary of results
In summary, all included studies were cross-sectional in design and most included more than 1000 participants. SEG was mostly categorised by income and/or educational level attained; however, boundary placement for each category varied between studies. All age groups except infants (0–2 years) were represented, with adults most commonly studied. While some studies utilised nationally collected data, those that did not mostly studied participants from major cities.
Secondary analysis of large dietary intake data sets was common to the majority of included studies; dietary intake was assessed most commonly by FFQ or 24 h recall methods. Dietary intake data were reported in a variety of ways, with only five of the included studies reporting continuous metrics. Only four studies analysed the whole diet, with the remainder mainly only analysing intake of fruit, vegetable and/or some types of discretionary choices. Unfortunately, those included studies which reported secondary analysis of the same data sets applied different SEG measures, different reporting metrics or reported intake of different food groups, thus precluding any comparison of results.
Overall, assessment of dietary intake by SEG described in the included studies showed that lower SEG had dietary intakes of lower nutritional value/quality or were similar to diets of higher SEG. However, studies were heterogeneous and no consistency in results was found.
Discussion
The aim of this systematic scoping review was to identify detailed dietary intake in low SEG in Australia compared with higher SEG. Included studies were heterogeneous, with large variation between the metrics and definitions applied, dietary assessment methods, findings and a lack of granular quantitative data. Before synthesising and analysing the dietary data, it was important to review the varied approaches applied to better understand the findings.
Population and socio-economic assessment
Definition of ‘low socio-economic’ groups
The authors of the majority of included studies (n 26, 79 %) used two or more measures to define and differentiate SEG. While many authors did not justify the choice of measure, two studies did provide some rationale. McLeod et al.(Reference McLeod, Campbell and Hesketh47) used only educational attainment, citing the claim it was the ‘strongest and most consistent indicator for predicting health outcomes’. Giskes et al.(Reference Giskes, Turrell and Patterson45) justified using household income alone, due to its claimed effect on the amount and type of food purchased and on other income sensitive household resources, such as transport and purchase of food storage and preparation devices. The two studies investigating the effect of area-level socio-economic measures compared with individual level factors on food purchasing found evidence of an independent area-level effect(Reference Turrell, Bentley and Thomas38,Reference Turrell, Blakely and Patterson39) . However, the effect was small and was not considered by the authors to be significant. Turrell et al.(Reference Turrell, Hewitt and Patterson52) and Zarnowiecki et al.(Reference Zarnowiecki, Ball and Parletta33) suggested that each measure (education, occupation and household income) was independently associated with dietary intake and recommended using multiple measures separately. These findings suggest that caution should be used in comparing dietary intake results in studies utilising different socio-economic measures.
Definition of ‘low income’
The variation in income ranges and metrics applied in the studies did not allow quantitative comparison of the dietary intake of a ‘low income group’. The most common definition of low income groups was a household or personal income of less than $AUD 33 000. Poor definition of income groups potentially influenced the finding of a low variance in dietary intake by SEG in one study, where the lowest household income group range (<$AUD 60 k) was substantially higher than other studies(Reference Zarnowiecki, Ball and Parletta33). Frequently, selection of the income metric and income range values appeared to be arbitrary, with little consideration of the actual range of Australian population incomes.
Age, gender and location of participants
All age groups, except infants, were included in the reviewed studies, as were both genders. However, children, teenagers and men were under-represented compared with the demographics of the Australian population.(63).
People living in remote and very remote locations were not specifically identified in any study, although some members of these population groups would presumably have been included in some of the national, Australia-wide dietary intake surveys(64). Compared with the demographics of the Australian population(63), there is also potential under-representation of those living in rural and remote locations. These populations tend to contain a high proportion of low SEG(12) who are subject to additional food security risk due to high unemployment, and difficult physical and economic access to food(Reference Pollard, Landrigan and Ellies65). Unfortunately, Aboriginal and Torres Strait Islander groups were not specifically included in any study, although these groups experience higher levels of diet-related chronic disease, food insecurity, low income and lack of educational opportunities compared with other Australians(Reference Lee and Ride66). A separate national Aboriginal and Torres Straits Islander Health Survey was undertaken in 2012–2013, including dietary intake measures(67). However, available analysis of this data has focused on differences between remote and non-remote population groups, and comparisons to non-Indigenous Australians, rather than differentiation by socio-economic measures(67). It is critical to ensure adequate representation of all key population groups when planning population dietary surveys and dietary studies.
Dietary intake
Dietary intake assessment
Dietary intake assessment methods applied in the included studies comprised 24 h recall and FFQ. The majority (n 28) of the thirty-three included studies reported secondary data analysis from prior collected data sets and many authors did not report on all available data. Self-reported/recalled dietary intake data can be affected by low literacy levels, social desirability bias and low motivation to provide an accurate intake record(Reference Shim, Oh and Kim68). Social desirability bias is particularly a confounder for females, overweight/obese persons and low SEG(Reference Giskes, Turrell and Patterson45,64) . It is possible to use statistical methods to detect and control for this bias; however, such approaches were not used in any of the included studies(Reference van de Mortel69). Adjustment for participants reporting improbably low and/or high energy intakes was undertaken in only three of the thirty-three included studies(Reference Livingstone, Olstad and Leech17,Reference Martin, Moran and Teede32,Reference Grech, Rangan and Allman-Farinelli36) .
The strengths and limitations of the dietary assessment methods applied, and the validity of results, were considered rarely in the included studies. In this regard, particular issues were identified in the BFS (2000), which characterised participant’s purchasing of a small number of highly selected food and drink items as ‘regular’ or ‘recommended’ options based on one nutrient only. For example, the milk option was regular or low fat, the bread option was white or wholemeal/wholegrain/hi fibre and the butter option was regular or unsalted. The ‘recommended’ options were claimed to be ‘options endorsed in dietary guideline publications and considered preferable choices to minimize risk for the development of diet-related diseases’(Reference Turrell, Hewitt and Patterson53). As the study was conducted in 2000, the 1998 ADG would have been relevant(60). However, there is little agreement between the recommendations of the 1998 ADG and the perceived healthfulness of the food categorisations applied in the BFS (2000). For example, intake of butter, whether low salt or otherwise, was not recommended in the ADG 1998(60); yet the BFS identified unsalted butter as ‘recommended’. Similarly, the BFS classified peanut, sesame and macadamia oils as ‘regular’ and less preferable to oils such as rapeseed, sunflower, safflower and olive, yet all these oils contain a high proportion of poly- or mono-unsaturated fats to saturated fats and were recommended by the 1998 ADG(Reference Turrell, Hewitt and Patterson53,60) . Other grocery item definitions in this method appear contradictory, such as classifying tinned fish in oil as ‘regular’ compared with the ‘recommended’ tinned in water, whereas oils such as rapeseed, sunflower and olive, usually present in tinned fish in oil, are also classified as ‘recommended’(Reference Turrell, Hewitt and Patterson53). Also, the BFS system only considered the items as purchased, rather than as consumed; for example, purchase of chicken with skin was classified as ‘regular’, whereas skinless chicken was ‘recommended’, yet the skin may have been removed prior to consumption. As such, shopping selections which are ‘recommended’ by this method do not represent dietary intake aligned with the ADG as claimed but appear to be selected arbitrarily. No assessment was made of purchasing of food or drinks from the core food groups compared with purchasing of discretionary items (called ‘extra’ items in ADG 1998) which is one of the most significant recommendation of the ADG(62). The BFS thus falsely categorises participant’s purchasing of specific food and drink items as ‘healthy’ or ‘unhealthy’, and the validity and value of results using this method should be questioned. However, these studies have been cited frequently as providing evidence of low SEG having ‘less healthy’ diets than higher SEG(Reference Kettings, Sinclair and Voevodin25,Reference Zarnowiecki, Ball and Parletta33,Reference Burns70) , and the method has been used recently(Reference Terry, Ervin and Soutter41).
Dietary intake analysis
Many of the included studies reported results using a single score derived from dietary intake measures, which can be useful for assessing dietary quality differences between population groups. With a single dietary quality score, however, granularity is lost and it can be difficult to identify component dietary determinants and translate these into specific recommendations to inform policy and practice.
Classification of food intake simply as ‘consumed’ or ‘not consumed’, with no indication of the quantity or frequency of consumption, gives little indication of overall dietary intake. Similarly, the blunt classification as having ‘met’ or ‘not met’ the ADG recommended intakes of specific food groups provides little variance and can be problematic in identifying dietary differences between SEG, especially for food groups, such as vegetables, where very few Australians (<4 %) meet the guidelines(2,3) .
To inform the development of detailed and targeted interventions and policies, a continuous quantitative metric for foods and/or food groups such as g/d or serves per day gives necessary detail (Table 4). This was only provided by six (18 %) of the thirty-three included studies(28,Reference Terry, Ervin and Soutter41,Reference Giskes, Turrell and Patterson45,Reference Ball, Crawford and Mishra49,Reference Giskes, Turrell and Patterson55,Reference Miura, Giskes and Turrell58) , and none of these assessed differences for all ADG food groups. Four of these studies(28,Reference Terry, Ervin and Soutter41,Reference Giskes, Turrell and Patterson55,Reference Miura, Giskes and Turrell58) assessed differences in quantitative intake of fruit and vegetables between SEG, and where these were significant, most reported around 15 % less intake per day in low SEG than high SEG; however, there was variability in study results.
Fruit and vegetables were the only two food groups where quantitative dietary intake data were provided by multiple studies; however, comparison between studies was not possible due to differences in socio-economic categorisation methods and population groups targeted.
The AIHW report(28) was the only study to present quantitative dietary intake data for ADG food groups other than fruit and vegetables. However, it did not provide data for the healthy fats and oils group, or the discretionary food and drinks group. In the absence of the provision of relevant data, it could be assumed that low SEG consumed at least as much energy as high SEG. Therefore, as intakes of all the healthy ADG food groups reported were lower in low SEG than higher SEG, it could be presumed that, if they had been reported, intakes of the healthy fats and oils group and/or the discretionary food and drinks group would have been higher in low SEG than in higher SEG. Hence, such dietary patterns may help explain the poorer diet-related health suffered by low SEG than other Australians(5-Reference Harris, Fetherston and Calder7). However, the lack of comprehensive detailed data to confirm such dietary inequities is astounding in a developed economy like Australia.
Food groups studied
The majority of the studies included in this review (n 29, 88 %) only examined the intake of selected food groups, mainly fruit, vegetables and/or discretionary food and drinks. Reasons for such restriction were not provided. Intake of fruit and vegetables may function as a blunt indicator for the overall healthfulness of the diet(Reference Ball, Crawford, Watson and Preedy71). However, it has also been argued that determination of all ‘healthy’ and ‘unhealthy’ elements of the diet is necessary to understand habitual dietary patterns, which are the key dietary driver of health outcomes(2,Reference Livingstone, Olstad and Leech17) .
In addition to quantitative fruit and vegetable intake, the number of varieties consumed was used as a proxy marker of a healthy diet in thirteen of the thirty-three (39 %) included studies. Consumption of a wide variety of healthy foods is encouraged by the ADG, although this applies between, as well as within, the five healthy food groups, not just for fruit and vegetables(2,72) . However, the need for variety does not apply to discretionary foods or drinks, as a major finding of the ADG 2013 was that there is little room in the diets of most Australians for any of these unhealthy foods or drinks(62).
Assessments of dietary intake of low socio-economic groups
Overall the included studies found that, compared with higher SEG, low SEG had lower total diet quality scores, lower or no significant difference in the intake of five food group and higher or no significant difference in intake of discretionary food and drinks (Table 3). The limited quantitative data available from the included studies (Table 4) exhibited a similar pattern. However, there was no consistency in the quantitative dietary intake of different SEG assessed by the different studies.
While there was consistency of findings of the whole diet quality scores across SEG (Table 5), at the food group and specific food levels, consistent differences were not found for any other dietary intake measure (Table 3). Dietary differences between SEG were not differentiated consistently by any of the socio-economic measures applied. This was likely due to the variation of metrics and methods used, including the inconsistent definitions of socio-economic measures, and approaches to dietary assessment, analysis and reporting of results. This variation in metrics and lack of granular results for all food groups mirrors results found in similar reviews in countries other than Australia(Reference Konstantinos, Vassilios and Panagiotakos19,Reference Mayén, Marques-Vidal and Paccaud20) . While it is appreciated that variations in metrics naturally arise from investigation of a variety of research questions, consistent comparison of results with recommendations of national food-based dietary guidelines would likely increase utility of results and relevance to future studies.
In summary, the detailed dietary data necessary to inform policy and practice were not identified in the included studies. These data are necessary to inform development of, for example, diet costing tools for use by low SEG, as was achieved previously for Aboriginal and Torres Strait Islander groups in Australia based on the separate Aboriginal and Torres Straits Islander Health Survey 2012–2013(Reference Lee and Lewis73). The findings of the studies suggested that analysis of the confidential unit record files of the national dietary survey would be necessary to identify the granular data required(74).
Strengths and limitations
A strength of this review is the detailed analysis of the many factors in the included studies that influenced assessment of dietary intake differentiated by SEG. The review was limited however to those documents available to online searching, and the information reported within. Common limitations of the included studies comprised low representation of men, infants and rural and remote population groups, failure to consider quality and utility of collected dietary data, such as effect of social desirability bias, and whether the dietary metrics reported were consistent with dietary guidance or provided sufficient granularity to inform policy and practice to support dietary improvement in low SEG. Meta-analysis was not feasible given the heterogeneity of the included studies.
Conclusions
This is the first systematic assessment of studies of dietary intake in different SEG in Australia. The evidence identified suggests that the nutritional quality of dietary intake of low SEG, particularly related to lower intakes of fruit and vegetables, is poorer generally than that of higher SEG. However, observed differences were not consistent for all measures of SEG, or for intake of all food groups, or food and drinks assessed, both within and between studies. Many included studies reported only selected dietary variables, and/or dietary metrics which did not support relative assessment of the healthiness of the diets of different SEGs, consistent with the evidence-based recommendations of the ADG 2013(2).
The review found that the detailed data analysis necessary for the development of targeted interventions and specific policies to help improve dietary inequities and assist lower SEG to move towards dietary recommendations in Australia is lacking. There is an urgent need for greater granularity of reported population dietary intake data to support relative assessment of the healthiness of diets against national food-based dietary guidelines in studies assessing food and dietary intake among different SEG in Australia.
The methods used in this review could be applied to interrogate dietary intake of low SEG in other countries and regions.
Acknowledgements
Acknowledgements: None. Financial support: M.L. was supported by a Research Training Program Scholarship provided by The University of Queensland, and a Top Up Scholarship provided by The Australian Prevention Partnership Centre, The Sax Institute. Conflict of interest: None. Authorship: M.L. designed and conducted the search, data extraction, analysed the data and drafted the manuscript. A.J.L. cross checked the search, data extraction and data analysis and provided critical feedback and input to the manuscript. Ethics of human subject participation: This research did not include the use of human subjects.
Supplementary material
For supplementary material accompanying this paper visit https://doi.org/10.1017/S1368980020003006


