Starch is the main energy source in common pig diets. Starch in pig diets originate from various botanic origins, causing variation in digestion rate in the gastro-intestinal tract (GIT) and thus in glucose appearance kinetics in the portal circulation( Reference Regmi, van Kempen and Matte 1 ). Variation in starch digestion kinetics has been demonstrated to affect pig performance. For example, pigs fed diets containing high amounts of non-digestible starch (resistant starch, RS) or slowly digestible starch (SDS) had longer meal durations and inter-meal intervals( Reference Da Silva, Bosch and Bolhuis 2 ) and lower energy losses by activity-related heat production( Reference Bolhuis, van den Brand and Staals 3 ), when compared with pigs fed rapidly digestible starch (RDS). Also, asynchrony between the rates of glucose and amino acid appearance in the blood negatively affects protein utilisation in restrictively fed pigs( Reference van den Borne, Schrama and Heetkamp 4 ) and poultry( Reference Weurding, Enting and Verstegen 5 ). In addition, variation in the presence of starch in the ileum and colon can influence the degradation of other macronutrients, notably recalcitrant fibres( Reference de Vries, Gerrits and Kabel 6 ).
Starch is composed of two types of polysaccharides: amylose, a linear α(1–4) linked glucan, and the much larger amylopectin, an α(1–4) linked glucan that contains around 5 % α(1–6) linkages, resulting in a branched molecule( Reference Tester, Karkalas and Qi 7 ). These two polysaccharides both form three-dimensional double helices that are packed in either dense A-type crystals or less dense B-type crystals( Reference Tester, Karkalas and Qi 7 ). These crystalline regions form shells that ultimately result in water-insoluble granules, which highly vary in size, shape and porosity( Reference Jane, Chen and Lee 8 , Reference Fannon, Hauber and BeMiller 9 ). In vitro studies showed that these intrinsic properties of starch cause variation in starch digestion kinetics. Although many of the structural and molecular properties of starch are inter-related within a botanic source of starch, B-type crystalline structure and long amylopectin side chains generally reduce digestion rate across botanic sources( Reference Regmi, van Kempen and Matte 1 , Reference Jiang, Jane and Acevedo 10 , Reference Martens, Gerrits and Bruininx 11 ). Within starch of cereal origin, the number of pores and the amylopectin:amylose ratio are positively correlated with in vitro digestion rate( Reference Fannon, Hauber and BeMiller 9 , Reference Martens, Gerrits and Bruininx 11 ). Several in vivo studies confirm these in vitro findings, as starch with a high-amylose (HA) content and B-type crystalline structure positively correlate with lower incremental plasma glucose concentrations in pigs( Reference Regmi, van Kempen and Matte 1 , Reference Giuberti, Gallo and Masoero 12 ). Apart from intrinsic starch properties, the extrinsic cereal matrix affects digestibility. Most cereals fed to pigs are known to have two types of endosperm tissue in which starch is stored: in soft endosperm starch granules are loosely organised within the cell, whereas in hard endosperm starch is densely packed within cell walls and proteins, decreasing the degradability of endosperm tissue( Reference Chandra, Proudlove and Baxter 13 , Reference Dombrink-Kurtzman and Bietz 14 ). In addition, digestibility of the cereal endosperm tissue is affected by the cell wall architecture. Plant cell walls are degraded for approximately 20 % when leaving the ileum of monogastrics, but the extent depends greatly on the molecular structure and composition of the cell wall( Reference Knudsen 15 ). Feed processing can increase starch digestion by reducing the particle size of the cereal matrix, thereby partly disrupting the cell wall matrix and by (partly) gelatinising the starch, for example, in pelleted( Reference Abdollahi, Ravindran and Wester 16 , Reference Rojas, Vinyeta and Stein 17 ) or extruded diets( Reference Rojas, Vinyeta and Stein 17 ).
Although in vitro starch digestion kinetics have been studied extensively, in vivo evidence is scarce and typically focuses on ileal starch disappearance( Reference Rojas, Vinyeta and Stein 17 , Reference Knudsen, Steenfeldt and Hedemann 18 ) or glucose appearance in the portal vein( Reference van Kempen, Regmi and Matte 19 ) or peripheral plasma( Reference Giuberti, Gallo and Masoero 12 ). Knowledge on starch breakdown mechanisms inside the GIT is largely based on in vitro studies, with a rather unknown contribution of brush-border enzymes or digesta passage kinetics. Furthermore, studies on the interaction between cereal matrix, processing and starch source towards digestion kinetics are scarce, complicating the prediction of starch digestion kinetics in a complete diet. The aim of the present study was to assess the effects of botanic source (barley, maize, HA maize) and starch form (isolated, in the cereal matrix or extruded) on the kinetics of starch disappearance along the GIT of pigs. In addition, we compared the in vivo outcome with an in vitro method, as described by Englyst et al. ( Reference Englyst, Kingman and Cummings 20 ), on starch digestion kinetics of those nine diets. The concentration and structure of unabsorbed starch residuals in digesta were measured to increase insight into the mechanisms of starch digesting enzymes. We hypothesised that extrusion would increase the rate of in vivo starch digestion and that an increase in amylose content would decrease the rate of digestion.
Methods
The experiment was conducted at research farm ‘Laverdonk’ of Agrifirm Innovation Center (Heeswijk-Dinther, the Netherlands). All experimental procedures were approved by the Dutch Central Committee of Animal Experiments (the Netherlands) under the authorisation number AVD260002016550.
Animals, housing and experimental design
Ninety crossbred gilts (Topigs 20× Pietrain sire), weighing 23·1±2·1 kg, were assigned to one of nine treatment combinations in a 3×3 factorial arrangement, in four successive batches of maximum twenty-four pigs each. Factors were starch source (barley v. maize v. HA maize) and form (as isolated starch v. ground cereal v. extruded cereal). The resulting dietary treatments were abbreviated as follows: barley starch in isolated (IB), ground (GB) and extruded (EB) forms; maize starch in isolated (IM), ground (GM) and extruded (EM) forms; and HA maize starch in isolated (IA), ground (GA) and extruded (EA) forms.
In total, ninety-six pigs were used: ten pigs were assigned per treatment, whereas the remaining animals served as reserve animals and were used to replace excluded animals. Seven pigs had to be excluded from the study because of feed refusals exceeding 20 % of their feed allowance during the 24 h before dissection. Another seven pigs were excluded due to a prolonged reduction in feed intake (>4 d) and signs of an Escherichia coli infection during the experimental period. Pigs that were excluded in one of the first three batches were replaced in the sequential batch. Replacement was done in such a way that a minimum of seven observations was realised for each dietary treatment.
The experiment consisted of an adaptation period of at least 2 d, during which the animals were gradually switched from a commercial grower diet (Agrifirm Feed) to the experimental diets, followed by an experimental period of at least 12 d, during which the experimental diets were fed. Pigs were housed in groups of four animals per pen (0·91 m2 per animal; 6:1 ratio of solid to slatted floor). To enable individual feeding, animals were separated using physical barriers through which they could still see, hear, smell and touch each other. The animals remained individually housed for the duration of feeding (max 1 h per meal, two meals per d), after which they were group-housed again. Pigs always had free access to water, and pens were enriched with a toy that was changed regularly (every 2–3 d). Temperature in the barn was maintained at 25±1°C. Lights were on from 06.00 to 19.00 hours, except for the 2 d before dissection (lights on from 06.00 to 22.00 hours), and the night before dissection (lights on from 02.30 hours onwards). Animals were fed 2·0× the energy requirements for maintenance (750 kJ net energy/kg body weight (BW)0·60)( Reference Blok and Spek 21 ), divided over two equal meals at 08.00 and 16.00 hours. Diets were fed as mash and mixed with water just before feeding. In the first batch, a feed:water ratio of 1:2 was applied. After the first batch, the feed:water ratio of the ground diets was altered to 1:1·5 to facilitate ingestion, whereas the feed:water ratio was maintained at 1:2 for other treatments. During the last 2 d of the experimental period, the daily allowance of the pigs was equally divided over six meals, starting at 07.00 and applying a between-meal interval of 3 h, to reach a constant passage rate of digesta through the GIT. Just before dissection, a frequent feeding procedure was applied to enable the measurement of digesta passage kinetics: each pig was fed six meals containing 1/12th of their daily allowance each, applying a 1 h between-meal interval. The first of the six hourly meals was fed exactly 6 h before a pig was euthanised. Pigs were euthanised and dissected in an order balanced for treatment and time after onset of the frequent feeding procedure. Upon the start of the frequent feeding procedure of the first pig, extra meals (1/12th of daily feed allowance) were provided with 2-h intervals to the pigs whose frequent feeding procedure had not yet started, to prevent restlessness in the barns. Pigs were weighed when they entered the barns, 7 d before dissection and on the day of dissection.
Diets and processing
Nine diets, containing approximately 400 g of starch/kg DM, were formulated to meet or exceed the nutrient requirements of growing pigs( Reference Blok and Spek 21 ) (Table 1). Barley grain and purified starch, isolated from the same barley grains, were obtained from Altia Corporation. Maize and HA maize and purified starch, again isolated from the same maize grains, were obtained from Roquette. Whole grains were ground by a hammer mill (3 mm sieve) and used as such, or extruded and subsequently reground by a hammer mill (3 mm sieve). Diets with isolated starch were formulated to be identical in crude protein, fat and total dietary fibre content to diets including native or extruded grains, using soyabean meal, hulls, protein isolate, oil and sugar beet pulp. Cr and Co were included as markers in the feed at a level of 170 mg/kg (w/w, as-fed basis), in the form of chromium oxide (Cr2O3) and Co-EDTA, respectively.
Table 1 Ingredient and nutrient composition of diets containing barley, maize or high-amylose maize starch included as isolated powder, ground cereal or extruded cerealFootnote *

* Diets are abbreviated as follows: barley starch in isolated (IB), ground (GB), and extruded (EB) forms; maize starch in isolated (IM), ground (GM) and extruded (EM) forms; and high-amylose maize starch in isolated (IA), ground (GA) and extruded (EA) forms.
† Altia Corporation, Koskenkorva.
‡ Roquette, Lestern, France.
§ Unisol NRG IP Non-GMO, Vitablend, Wolvega, The Netherlands.
|| Provided per kg of diet: vitamin A (retinyl acetate), 10 000 IU (3000 µg retinol activity equivalents); vitamin D3 (cholecalciferol), 2000 IU (50 µg vitamin D3); vitamin E (dl-α-tocopherol), 40 mg; vitamin K3 (menadione), 1·5 mg; vitamin B1 (thiamin), 1·0 mg; vitamin B2 (riboflavin), 3 mg; vitamin B6 (pyridoxine-HCl), 1·5 mg; vitamin B12 (cyanocobalamin), 20 µg; niacin, 30 mg; d-pantothenic acid, 15 mg; choline chloride, 150 mg; folic acid, 0·4 mg; biotin, 0·05 mg; Fe, 100 mg, as FeSO4.H2O; Cu, 20 mg, as CuSO4.5H2O; Mn, 30 mg, as MnO; Zn, 70 mg, as ZnSO4.H2O; I, 1 mg, as KI; Se, 0·25 mg, as Na2SeO3.
¶ Calculated based on data from Centraal Veevoeder Bureau( Reference Blok and Spek 21 ).
Extrusion was performed in a co-rotating twin-screw extruder (M.P.F.50; Baker Perkins) as described by de Vries et al. ( Reference de Vries, Pustjens and Kabel 22 ). Briefly, the extruder consisted of nine heating zones and a die with two orifices (Ø 3·8 mm). Temperatures in the nine heating zones were set at 30, 40, 50, 60, 70, 80, 95, 105 and 110°C, respectively. The actual values of all heating zones were close to the set values, except the one to last zone, which was set at 105°C but reached a temperature of maximum 145°C. The speed of the extruder screw was fixed at 160 rpm and the measured product temperatures at the die ranged from 97 to 99°C for barley, 95 to 96°C for maize and 95 to 97°C for HA maize diets. Water was added to the ground cereal directly in the extruder with a water pump at 6·8 litres/h, and the measured product throughput was 55 kg dry cereals/h. The extruded cereals were subsequently air-dried at 55°C overnight in air-forced ovens.
Digesta collection
Before dissection, pigs were sedated by intramuscular injection of a mixture of xylazine (2 mg/kg BW) and zolitil (4 mg/kg BW). After sedation, pigs were injected intravascular with pentobarbital (24 mg/kg BW) and exsanguinated. Immediately after exsanguination, clamps were placed between the stomach and small intestine (SI) and between the SI and caecum, to prevent the movement of digesta, and the organs were carefully removed. The SI was spread on a table and divided with clamps in four segments. The terminal 1·5 m from the SI (SI4) was considered to represent the ileum. The rest of the SI was divided into three parts of equal length (SI1, SI2 and SI3, from proximal to distal SI, respectively). All parts were dissected and their contents were collected by gently stripping. The total weight of the digesta was recorded and a representative sample was immediately frozen on dry-ice and kept at –20°C until freeze-drying. After freeze-drying, samples were ground to pass a 1 mm sieve using a centrifugal mill at 12 000 rpm (ZM200; Retsch).
Chemical analyses
Before chemical analysis, feed samples were ground in the same way as digesta samples. All analyses were performed in triplicate, unless indicated otherwise. DM content of digesta was determined in singlicate by recording the weight before and after freeze-drying. DM content in feed was determined in duplicate according to NEN-ISO 6496( 23 ). Total starch content of all diet and digesta samples was determined according to AOAC method 996.11 with the total starch assay kit from Megazyme. In short, digesta and feed samples were dissolved in KOH (kit procedure c) followed by enzymatic hydrolysis of the starch (kit procedure a). The glucose concentration was determined with hexokinase–glucose-6-phosphate dehydrogenase reagent (Roche). Samples were not washed with water or ethanol before analysis, thus the total starch content as measured in this study includes free glucose and soluble maltodextrins. Amylose content of starch was determined in isolated starch, according to the amylose/amylopectin procedure of Megazyme (K-AMYL 06/18). N content of the diets was determined in duplicate according to NEN-EN-ISO 5983-2( 23 ). Crude fat of the diets was determined in duplicate according to NEN-ISO 6492( 23 ). Ash content of the diets was determined in duplicate according to NEN-ISO 5984( 23 ). The total dietary fibre content of the diets was calculated as total DM minus crude fat, N, ash and starch( Reference Blok and Spek 21 ). Concentrations of Cr and Co were determined in singlicate in digesta and feed material by inductively coupled plasma optical emission spectroscopy. Cr and Co were measured at a wavelength of 357·9 and 228·0 nm, respectively, as described by van Bussel et al. ( Reference van Bussel, Kerkhof and van Kessel 24 ), after sample preparation according to Williams et al. ( Reference Williams, David and Iismaa 25 ).
The structure of unabsorbed starch residuals in the small intestine of pigs was analysed using a scanning electron microscope (SEM). From each treatment, one pig was selected that had digesta mean retention times (MRT) and starch digestion coefficients (DC), in all small-intestinal compartments, which were close to the average MRT and DC within that treatment. Only digesta that had more than 10 % unabsorbed starch residuals (DC >0·9) could be analysed with SEM. Feed samples and fresh digesta, directly frozen after collection, were washed subsequently with hexane, twice with demi water and finally with 96 % ethanol. All washing steps were performed at room temperature, with an approximate ratio of digesta to solvent of 1:4. In between each washing step, the sample was centrifuged for 10 min at 2000 g , before the solvent was discarded. Samples were dried for 48 h at 40°C in an oven. Dried digesta were attached on SEM sample holders using carbon adhesive tabs (EMS) and sputter coated with 15 nm tungsten (EM SCD 500; Leica). Starch granules and granular residues were analysed with a field emission SEM (Magellan 400; FEI) with secondary electron detection at 2 kV. When digesta consisted of large pieces (e.g. digesta of pigs fed ground cereals), those pieces were attached on SEM sample holders using carbon adhesive tabs in combination with carbon adhesive (EMS). The samples were sputter coated twice, in opposite positions at angles of 45°, with 15 nm tungsten.
Glucose and starch-derived maltodextrins in the water-soluble fractions of feed and digesta were analysed with a high-performance anion exchange chromatography system with pulsed amperometric detection (HPAEC-PAD). Digesta samples were pooled by intestinal segment and pig within treatment, based on weight. Diet and pooled digesta samples were boiled for 5 min (50 mg/ml) before centrifugation. Supernatant was diluted and analysed on a ICS5000 HPAEC-PAD (Dionex Corporation) equipped with a CarboPac PA-1 column (inner diameter 2 mm×250 mm) and a CarboPac PA guard column (inner diameter 2 mm×25 mm). The flow rate was set at 0·3 ml/min. The two mobile phases were (A) 0·1 m NaOH and (B) 1 m NaOAc in 0·1 m NaOH and the column temperature was 20°C. The elution profile was as follows: 0–37 min, 5–30·9 % B; 37–50 min, 30·9–100 % B; 50–55 min, 100 % B; 55–55·1 min, 100–5 % B; and finally column re-equilibration by 5 % B from 55·1 to 65 min. The injection volume was 10 µl. Calibration curves of glucose, maltose, maltotriose, maltotetraose, maltopentaose and maltohexose were used to quantify the concentration of glucose and linear α(1–4) maltodextrins with degree of polymerisation (DP) 1, 2, 3, 4, 5 and 6, respectively. Furthermore, maltohexose was used to quantify concentrations of maltodextrins with DP >6.
In vitro starch digestion kinetics were evaluated using a digestion method described by Englyst et al. ( Reference Englyst, Kingman and Cummings 20 ) and van Kempen et al. ( Reference van Kempen, Regmi and Matte 19 ). Briefly, 500 mg of starch was incubated with pepsin (P-7000) in a hydrochloric acid solution (0·05 mol/l), containing guar-gum and 50 % saturated benzoic acid at pH 3 and 39°C for 30 min. Following, the pH was changed to 6 by adding a sodium acetate buffer (0·5 mol/l) containing porcine pancreatin (P-7545), amyloglucosidase (A7095) and invertase (I4504), and the sample was incubated at 39°C for 360 min. In contrast to the assay described by van Kempen et al. ( Reference van Kempen, Regmi and Matte 19 ), samples were incubated in a head-over-tail mixing device (8 rpm) located in an oven. Furthermore, glucose concentrations were measured in smaller aliquots in a ninety-six wells plate using a glucose oxidase peroxidase assay (Megazyme).
Calculations and statistical analyses
In vivo DC of starch were calculated based on the dual-marker method with two indigestible markers for the insoluble (Cr2O3) and soluble (Co-EDTA) digesta fractions and starch concentrations in feed and digesta (equation 1)(26). Because starch is partly solubilised during digestion, undigested starch behaves partly as insoluble and partly as a soluble compound, which differed significantly in passage behaviour throughout the SI (BMJ Martens, M Noorloos, S de Vries, HA Schols, EMAM Bruininx and WJJ Gerrits, unpublished results). The fraction of starch found as glucose and soluble oligomers and polymers was used to calculate DC, according to equation 1.
 $${\rm DC(}n{\rm ){\equals}1}{\minus}\left( {{{{\rm [Cr}_{{\rm F}} {\rm ]}{\times}{\rm (1}{\minus}S{\rm )}\left[ {{\rm starch}_{{\rm D}} } \right]} \over {{\rm [Cr}_{{\rm D}} {\rm ]}{\times}\left[ {{\rm starch}_{{\rm F}} } \right]}}{\plus}{{\left[ {{\rm Co}_{{\rm F}} } \right]{\times}{\rm (}S{\rm )}\left[ {{\rm starch}_{{\rm D}} } \right]} \over {\left[ {{\rm Co}_{{\rm D}} } \right]{\times}\left[ {{\rm starch}_{{\rm F}} } \right]}}} \right)$$
where DC(n) is the digestibility coefficient of starch in the compartment n as fraction of ingested starch, [Co] is the concentration of soluble indigestible marker dosed in feed (F) or measured in digesta (D) (mg/g DM), [Cr] is the concentration of insoluble indigestible marker dosed in feed (F) or measured in digesta (D) (mg/g DM), [starch] is the concentration of starch measured in feed (F) or digesta (D) (mg/g DM), S represents glucose and soluble starch-derived maltodextrins, as fraction of the total amount of starch in digesta. In addition, DC were calculated with Cr2O3 as the only marker (referred to as DCcr), according to the commonly used single-marker method( Reference Kotb and Luckey 27 ).
To study starch digestion kinetics, the DC was plotted against the cumulative retention time (CRT) of starch per segment (n) of the SI according to equation 2.
 $$\eqalignno{ &{\rm CRT}\left( n \right){\equals}S{\times}\left( {{\rm MRT}_{{\rm l}} (n-1){\plus}0.5{\times}{\rm MRT}_{{\rm l}} \left( n \right)} \right)\, \cr & \quad {\plus}(1-S){\times}\left( {{\rm MRT}_{{\rm S}} (n-1){\plus}0.5{\times}{\rm MRT}_{{\rm S}} \left( n \right)} \right)$$
where CRT is the cumulative retention time of digesta in SI compartment n in min and S is the fraction of soluble starch breakdown products as part of the total amount of starch in digesta. MRT is the MRT of the solid (s) or liquid (l) fraction of digesta in min (calculations and results will be described elsewhere). For SI1, MRT(n–1) is zero.
A modified version of the Chapman–Richards model was used to model in vitro digestion kinetics, as previously described by van Kempen et al. ( Reference van Kempen, Regmi and Matte 19 ) (equation 3).
 $${\rm Starch \ hydrolysis}{\equals}{\rm plateau}{\times}\left( {1{\minus}\exp \left( {{\minus}{{{K \over {100}}} \over {{\rm plateau}}}{\times}100{\times}{\rm time}} \right)} \right)$$
where starch hydrolysis is expressed as percentage of starch in sample, plateau is the maximum amount of starch hydrolysed during digestion (as percentage of sample weight), which is calculated from the maximum glucose release×0·9, and K is the rate of glucose release corrected for plateau effects (as percentage of starch hydrolysed to glucose per min). Time is the incubation time (min) since start of the in vitro procedure. The K and plateau values of each starch sample were estimated by nonlinear regression procedures (PROC NLIN, SAS, version 9.4; SAS Institute). For estimation of the plateau value, a boundary was included forcing the estimation to be ≤1. Amounts of in vitro RDS, SDS and RS were calculated based on the classification system of Englyst et al. ( Reference Englyst, Kingman and Cummings 20 ).
Effects of the experimental factors on DC and DCcr within each segment were tested using a general linear mixed model (PROC MIXED; SAS). Starch form (isolated starch, ground cereal, extruded cereal), starch source (barley, maize, HA maize), small-intestinal segment (SI1, SI2, SI3, SI4) and all interactions were included as fixed effects. Batch was included as random effect, and pig was considered as the experimental unit. Differences among starch forms within sources were considered pre-planned contrasts and were evaluated using contrast statements. Changes in DC throughout the SI within each starch source were analysed using a general linear mixed model, with segment as fixed effect. Segment within pig (subject) was modelled as R-side effect to account for repeated observations within pigs. Based on the fit statistics, a heterogeneous autoregressive covariance structure was assumed. The slice statement was used to identify effects of starch form, starch source and their interaction within each segment and to identify effects of segment within each starch form, starch source and source–form combination. Contrast statements were used to compare segments within starch source. Data are presented as least square means and standard deviation of the mean unless stated otherwise. A retrospective power analysis was performed to validate the sample size of this study. Considering starch DC as the most important parameter, the power was evaluated using the variation in starch DC observed in this study, by calculating the critical F value for a two-sided α level of 0·05 and for the mixed model study design( Reference Stroup 28 ). A power greater than 0·95 was reached on the main effects of form, source and segment, the form×source interaction, and the source×segment interaction. For the form×segment interaction, a power of 0·44 was reached; and for the form×source×segment interaction, a power of 0·68 was reached. Significance was assumed at P<0·05, while a tendency was considered when 0·05<P≤0·1.
Results
Effects of starch form, starch source and small-intestinal segment on starch digestion coefficients
The sum of glucose and all-soluble α(1–4) maltodextrins was quantified as fraction of total unabsorbed starch residuals (online Supplementary Table S1) and used to calculate the DC of starch (Table 2). In addition to the linear α(1–4) maltodextrins, other (unidentified) starch-derived soluble oligosaccharides were present, making up <5 % of the total peak area as measured with HPAEC, which were excluded in the calculation of starch DC. DC are also calculated according to the commonly used single-marker method (DCcr, online Supplementary Table S2).
Table 2 Digestion coefficients (DC) of starch in digesta recovered from four consecutive parts of the small intestine (SI) of pigs fed diets containing barley, maize or high-amylose maize starch, included as isolated powder, ground cereal or extruded cereal*Footnote † (Least square mean values and standard deviations)

a,b Differences among starch forms within all diets of barley origin (P<0·05).
c,d Differences among starch forms within all diets of maize origin (P<0·05).
e,f,g Differences among starch forms within all diets of high-amylose maize origin (P<0·05).
* DC values are calculated using the dual-marker method( Reference Vries and Gerrits 26 ).
† SI4 is the terminal 1·5 m of the small intestine, whereas the rest of the small intestine is divided into three parts of equal length (SI1, SI2 and SI3, from proximal to distal SI, respectively).
‡ Starch forms and sources are abbreviated as follows: isolated (I), ground (G) and extruded (E) forms, originating from barley (B), maize (M), and high-amylose maize (A).
§ Model established P values for fixed effects of starch form (isolated, ground or extruded), source (barley, maize or high-amylose maize), and the interaction between form and source, within segment. When an interaction between form and source was identified, superscripts a–g are used to indicate significant differences among starch forms within each starch source. Significance was assumed at P<0·05, while a tendency was considered when 0·05 P≤0·1.
|| When a form or source effect is present (P<0·05), ‘>’ indicates that the DC of a form/source is larger than others, whereas ‘=’ indicates that there is no difference in DC.
¶ The maximum number of replicate observations equals the amount of animals per treatment. In some segments, not enough digesta was present to allow chemical analysis, causing one missing observation in SI1 of GB, SI1 of EA, SI4 of IB and SI4 of GM, and two missing observations in SI1 of EM.
** Model established P values for fixed effects of segment, analysed per source.
†† When a segment effect is present (P<0·05), ‘<’ indicates that the DC of a segment is smaller than others, whereas ‘=’ indicates that there is no difference in DC.
In the absence of form×source×segment interactions (P>0·1), form×source interactions (P<0·01) are presented per segment. Due to the absence of segment×form interactions (P>0·1), segment effects on starch DC are presented within source. Overall, starch digestion increased with each following SI segment for all starch sources (0·04–0·32 DC units, P<0·001), except for pigs fed HA maize, where SI1 and SI2 did not differ. For all segments, a significant interaction between starch form and source was present. The average DC of starch from maize origin was similar to that of barley in SI1 and SI2, but lower in SI3 and SI4 (0·03 DC units in both segments, P<0·05). The average starch DC of pigs fed HA maize was lower than that of pigs fed barley and maize from SI2 onwards (0·20–0·33 DC units, P<0·01). For barley-fed pigs, starch DC did not differ among starch forms in SI1 and SI4. In SI2, the DC of starch for pigs fed GB was lower (0·16 DC units, P<0·05); and in SI3, the DC of starch for pigs fed GB was lower (0·08–0·09 DC units, P<0·05) than for pigs fed IB and EB. In contrast, extrusion increased the DC of starch in all SI segments of maize-fed pigs (0·12–0·26 DC units, P<0·05) and in all SI segments of pigs fed HA maize (0·13–0·47 DC units, P<0·05), compared with pigs fed ground cereals. The cereal matrix hampered starch digestion for maize fed pigs (IM v. GM) in SI3 and SI4 (0·10–0·15 DC units, P<0·0001). For HA maize, the cereal matric (IA v. GA) hampered starch digestion in SI3 (0·08 DC units, P<0·05) but not in SI4.
Glucose and maltodextrins released during starch digestion, as fraction of unabsorbed starch residuals
A typical HPAEC elution pattern of the soluble fraction of starch residuals in small-intestinal digesta (SI1–SI4) of pigs fed ground maize (online Supplementary Fig. S1) illustrates the presence of mainly glucose and linear α(1–4) maltodextrins. The fraction of unabsorbed starch residuals (1-DC) was divided into glucose, individual α(1–4) gluco-oligosaccharides (up to DP6), soluble gluco-polysaccharides (>DP6) and insoluble starch (Fig. 1). The sum of glucose and all soluble maltodextrins is referred to as soluble unabsorbed starch residuals. Expressed as a percentage of total unabsorbed starch residuals, these soluble residuals averaged 25 % in SI1 and 18 % in SI2 of barley-fed pigs, whereas this was only 4 % in SI3 and 2 % in SI4. For pigs fed maize-based diet, a similar pattern was observed as 17, 13, 4 and 1 % of total unabsorbed starch residuals were recovered as soluble starch residuals in SI1 to SI4, respectively. For HA maize-fed pigs, soluble starch residuals made up 10, 11, 9 and 7 % of the total unabsorbed starch residuals from SI1 to SI4, respectively. For all treatments, concentrations of glucose, maltose and maltotriose were numerically highest for all individually identified molecules. For barley-fed pigs, the sum of glucose, maltose and maltotriose averaged 32 % of the soluble unabsorbed starch residuals across all SI segments, whereas this was 24 % for maize-fed pigs and 12 % for pigs fed HA maize. In the first SI segment of pigs fed extruded cereals, the sum of glucose, maltose and maltotriose constituted 33 % of the soluble unabsorbed starch residuals, which was 21 % for pigs fed isolated starch and 13 % for pigs fed ground cereals. In SI2–4, this concentration averaged 32 % for pigs fed isolated starch, 19 % for pigs fed ground cereals and 17 % for pigs fed extruded cereals.
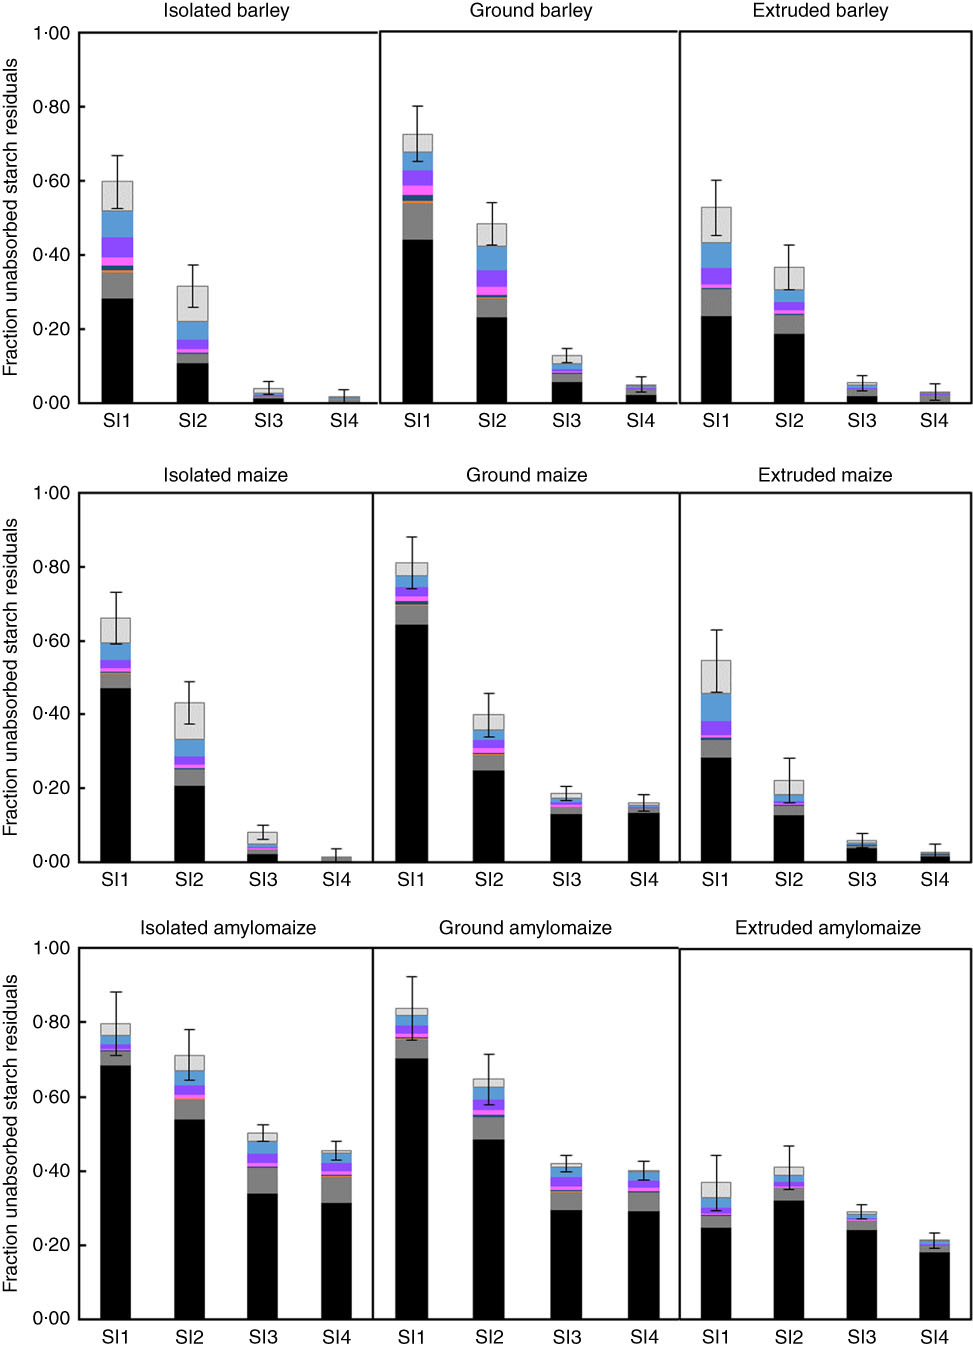
Fig. 1 Fraction unabsorbed starch residuals calculated as 1 – digestion coefficient (DC) in digesta recovered from four parts of the small intestine (SI) of pigs fed barley, maize or high-amylose maize-based diets which included starch as isolated powder, ground cereal or extruded cereal. Undigested starch is divided into soluble oligomers, quantified per individual oligomer up to degree of polymerisation (DP) 6 and insoluble starch. The error bars represent the standard error of the estimated mean DC.
![]() , DP1;
, DP1;
![]() , DP2;
, DP2;
![]() , DP3;
, DP3;
![]() , DP4;
, DP4;
![]() , DP5;
, DP5;
![]() , DP6;
, DP6;
![]() , >DP6;
, >DP6;
![]() , insoluble starch.
, insoluble starch.
Visual inspection of undigested starch
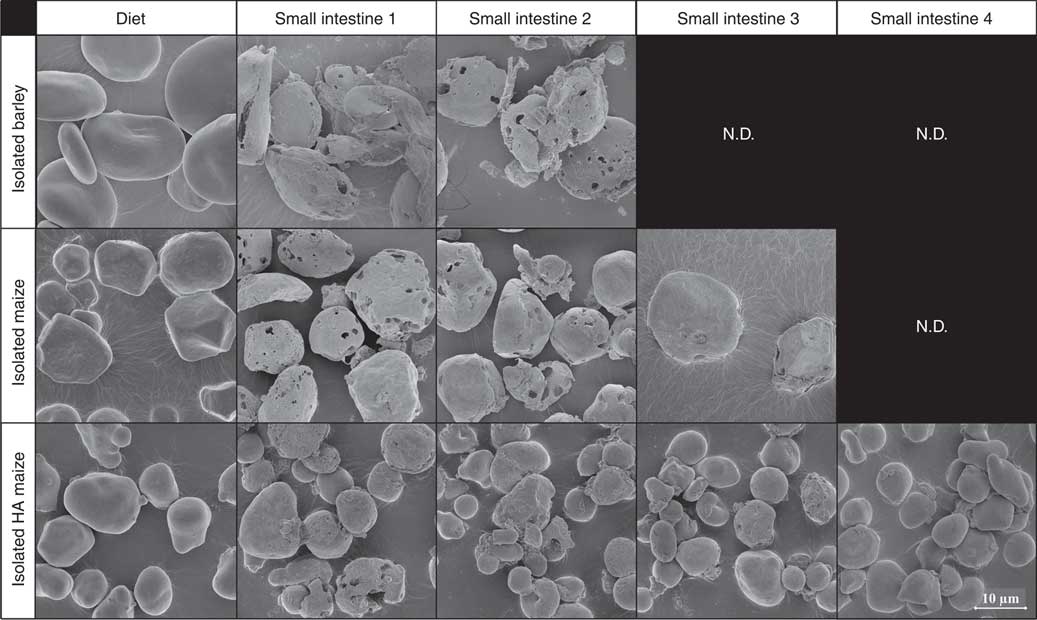
Before ingestion, starch consisted largely of undamaged starch granules, both at individual granule level (Fig. 2, 5000× magnified) and within the ground cereal matrix (Fig. 3, 1000× magnified). Furthermore, starch in all ground cereals was mainly present inside a protein and cell wall matrix, which was damaged upon extrusion (Fig. 3). Individual starch granules of diets containing isolated starch showed signs of digestion in all parts of the SI, although digestion appeared more extensive for barley and maize starch granules compared with HA maize starch (Fig. 2). Digestion of starch fed as ground cereals was hampered by the protein and cell wall matrix, which remained intact for a part throughout the SI (Fig. 4 and online Supplementary Fig. S2).
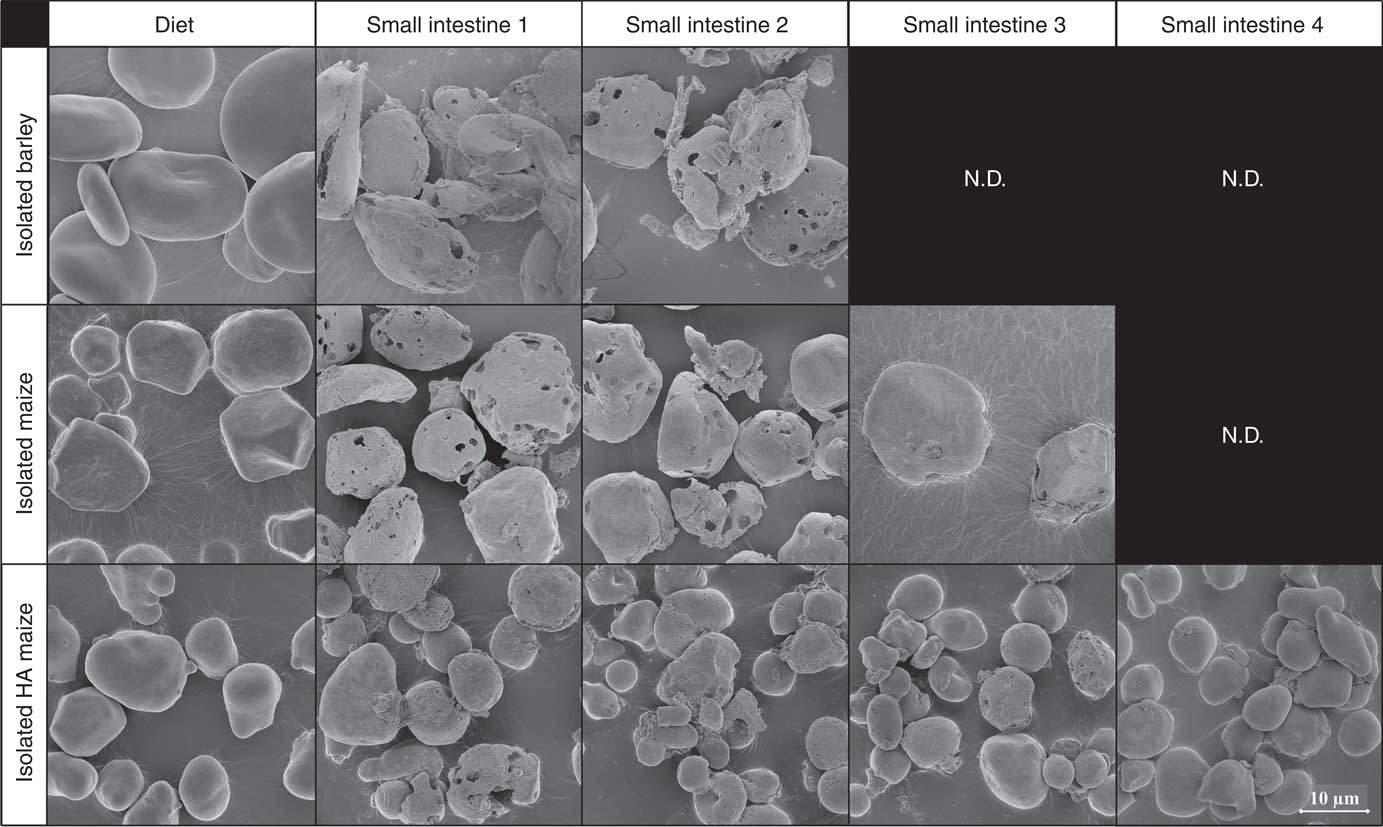
Fig. 2 Typical scanning electron microscope (SEM) images of starch granules in digesta of pigs fed diets containing isolated starch from barley, maize or high-amylose (HA) maize origin, in diets and four segments of the small intestine, 5000× magnified. N.D. is used to indicate that not enough insoluble starch residues were present in those small intestine compartments to enable SEM analysis (i.e. not determined).
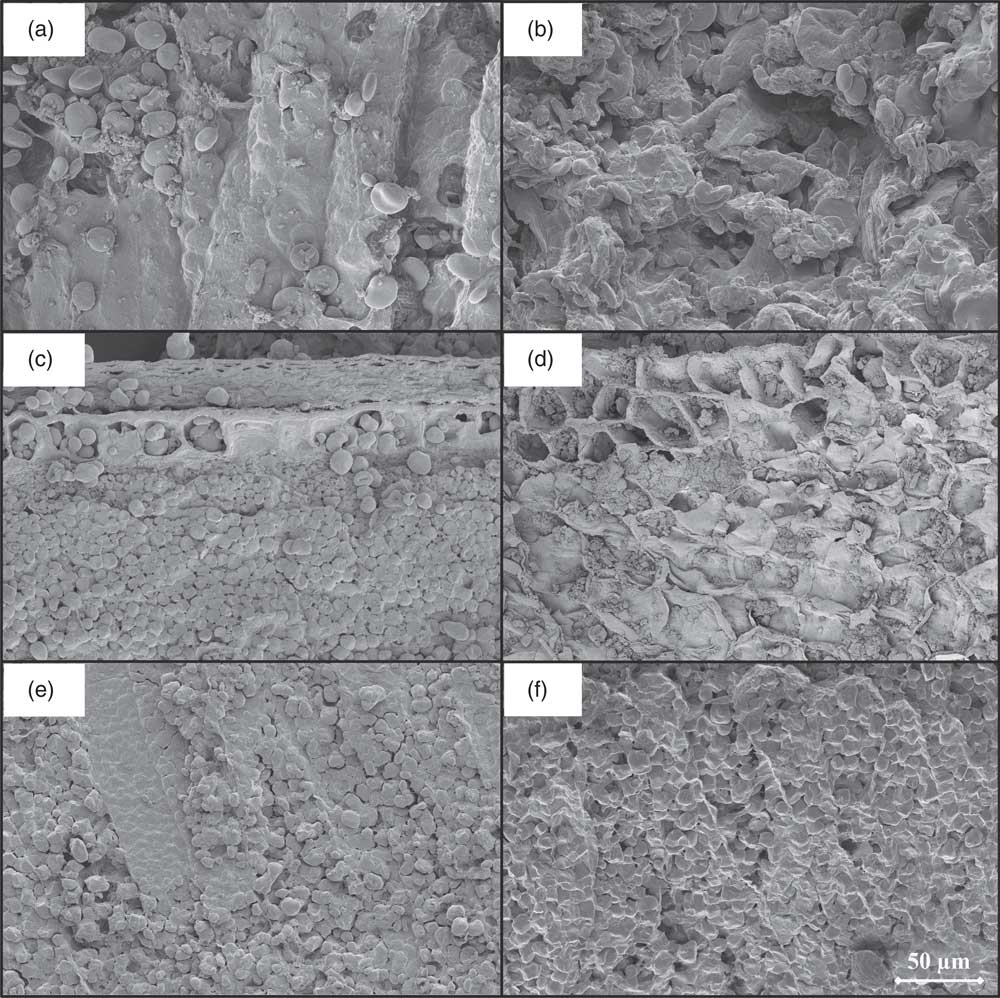
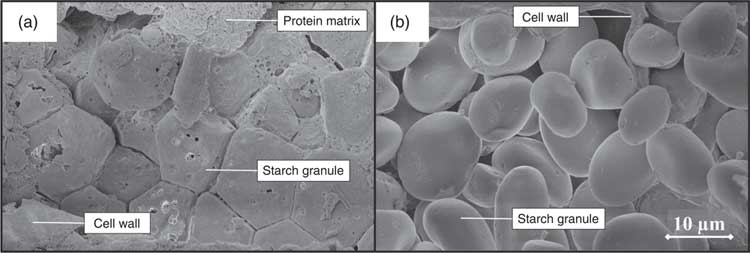
Fig. 3 Scanning electron microscope images of diets containing barley in ground (a) and extruded forms (b), maize in ground (c) and extruded forms (d), and high-amylose maize in ground (e) and extruded forms (f), 1000× magnified.
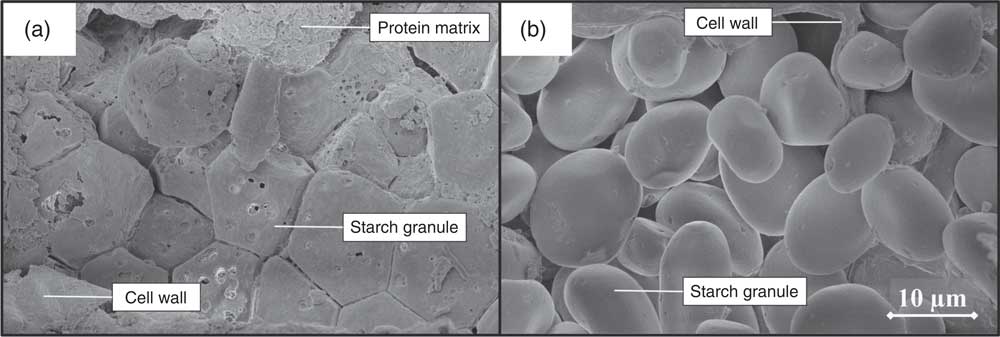
Fig. 4 Scanning electron microscope image of digesta recovered from small intestine 4 of a pig fed ground maize (a) and of a pig fed ground barley (b), 5000× magnified.
In vitro starch digestion kinetics
For all starch sources, the rate of in vitro starch digestion was measured and found to be higher for extruded diets compared with diets containing isolated starch and ground cereals (Table 3). Furthermore, each HA maize starch was digested slower in vitro than barley and maize starch of the same form. Extrusion resulted in a substantial increase in RDS, which was around 20 % higher in barley and maize starch compared with HA maize starch. Consequently, extruded cereals contained low amounts of SDS and little (HA maize) or no RS (barley and maize). Ground barley and maize were digested slower than isolated barley and maize starch, resulting in higher levels of RDS for IB v. GB and IM v. GM. In contrast, isolated HA maize starch and ground HA maize were digested at a similar rate, resulting in similar levels of RDS, which were much lower than RDS levels of IB, IM, GB and GM. Consequently, IA and GA contained considerable higher levels of RS, but not SDS, than all other diets.
Table 3 In vitro digestion rate, plateau level and calculated amounts of rapidly digestible starch (RDS)Footnote *, slowly digestible starch (SDS) and resistant starch (RS) of diets containing barley, maize or high-amylose maize starch, included as isolated powder, ground cereal or extruded cereal

* Calculated based on the classification system of Englyst et al. ( Reference Englyst, Kingman and Cummings 20 )
Discussion
The aim of this study was to assess the effects of variation in botanic starch source and processing form on the kinetics of starch disappearance along the GIT of pigs and to relate this to the in vitro predicted digestion kinetics. In addition, the structure of starch residuals that remained unabsorbed in the small intestine was analysed to obtain more information on the digestive mechanisms of starch hydrolysing enzymes.
Influence of intrinsic starch properties v. the cereal matrix
An in-depth analysis of the intrinsic properties of maize, barley and HA maize starch and their relation to in vitro digestion kinetics is presented elsewhere( Reference Martens, Gerrits and Bruininx 11 ). Briefly, maize and barley starch used in this study have comparable intrinsic properties, whereas HA maize has a higher amylose content (55 %) compared with barley and maize starch (20 %). Furthermore, HA maize starch has a different type and amount of crystalline structure, less pores and a different amylopectin structure. These intrinsic properties of HA maize hampered ileal digestibility illustrated by the lower ileal starch digestibility of IA (66 %) compared with IM (99 %), which confirms the results of in vivo studies( Reference Bird, Vuaran and Brown 29 – Reference Fouhse, Gänzle and Regmi 31 ).
Presence of the cereal matrix hampered ileal starch digestion for maize but not for barley and HA maize. This is illustrated by a reduced ileal starch DC for pigs fed ground v. isolated and maize, whereas this difference is absent for barley and HA maize. Results of in vivo studies with pigs have indicated that a reduction in the particle size, thus an increased damage of protein matrix and cell walls, increased ileal starch digestibility of both barley, from 0·92 to 0·96 units( Reference Knudsen, Steenfeldt and Hedemann 18 ), and maize, from 0·89 to 0·97 units( Reference Rojas and Stein 32 ). In addition, a reduction in the particle size of maize increased starch DC in the duodenum and jejunum of pigs( Reference Amaral, Amaral and Cantarelli 33 ).
In this research, neither cereal endosperm nor cell wall structures were examined. Analysis with SEM revealed undigested protein residues covering starch granules in the distal SI parts of pigs fed ground maize (Fig. 4). This indicates the presence of substantial fractions of hard endosperm, which is typically richer in indigestible proteins( Reference Dombrink-Kurtzman and Bietz 14 ). In contrast, only loosely packed starch granules were identified for barley (Fig. 4), suggesting the presence of mainly soft endosperm that allows for a more rapid starch digestion( Reference Dhital, Warren and Butterworth 34 ). SEM analysis also revealed large fractions of starch granules entrapped within intact cell wall material in SI4 of maize-fed pigs (online Supplementary Fig. S2), which was not observed for barley-fed pigs. Based on previous research, it is suggested that this is caused by larger fractions of soluble fibres, which are generally more abundant in barley than in maize, and more easily degraded by monogastrics( Reference Knudsen 15 , Reference de Vries, Pustjens and Schols 35 ).
In summary, both the endosperm cell wall and protein structure seem to contribute to a higher RS fraction in ground maize compared with ground barley. In ground HA maize, the cereal matrix likely has a similar effect as seen in ground maize, as substantial fractions of hard endosperm were observed in HA maize. However, intrinsic properties of HA maize seem to hamper digestion more than its cereal matrix, because the DC of isolated HA maize did not exceed the DC of ground HA maize in any of the SI parts.
Effect of extrusion on in vivo starch digestion
Extrusion increased the ileal digestibility of maize and HA maize starch with 0·15 and 0·19 units to 0·98 and 0·79 units, respectively. This is more than expected based on previous research with maize-fed pigs, where a modest increase in ileal digestibility of 0·02 units was identified( Reference Rojas, Vinyeta and Stein 17 ). However, the starch DC measured for native ground maize used in the current study (0·86) was lower than in the previous study (0·98)( Reference Rojas, Vinyeta and Stein 17 ). Ileal starch digestibility of ground barley was nearly complete in our study, leaving no room for an increase by extrusion, which was observed in previous work( Reference Sun, Laerke and Jorgensen 36 ). For HA maize, starch DC in the proximal SI was increased by extrusion, whereas the DC remained almost similar to that of SI1 in subsequent SI segments. As visualised by SEM, the effect of extrusion on HA maize appeared smaller than observed for maize and barley (Fig. 3). Indeed, the molecular properties of HA starch led to a higher gelatinisation temperature of starch, causing similar processing conditions to result in a lower degree of gelatinisation( Reference Li, Hasjim and Xie 37 – Reference Waigh, Gidley and Komanshek 39 ).
Mechanisms of starch hydrolysing enzymes in the small intestine
A substantial part of the unabsorbed starch residuals in the small intestine was present as soluble oligomers (Fig. 1), especially for pigs fed barley and maize (on average 63 and 42 % across starch forms, respectively). Our novel findings indicate that the soluble oligomer fraction in SI1 and SI2 consisted mostly of molecules with DP ≤3. Maltose and maltotriose are typical end products of pancreatic α-amylase( Reference Robyt and French 40 ), whereas glucose is the end product of brush-border enzyme activity( Reference Hooton, Lentle and Monro 41 ). The presence of glucose in the proximal SI suggests a delay in the absorption of glucose that is produced by brush-border enzymes, which was observed before for pigs fed native maize starch( Reference Noah, Lecannu and David 42 ). In addition, the high concentration of glucose in digesta indicates activity of brush-border enzymes, which are not bound to the gut wall. This corresponds well with the results of recent experiments, which indicated that a proportion of brush-border enzymes is actively budded off as brush-border membrane vesicle( Reference McConnell and Tyska 43 ) and that the enzymes might transit and diffuse to all parts of the intestinal lumen( Reference McConnell, Higginbotham and Shifrin 44 ). The presence of maltose and maltotriose reveals that the rate of starch hydrolysis by α-amylase exceeds the rate of maltose and maltotriose degradation by brush-border enzymes.
In digesta of pigs fed isolated barley or maize starch, granular starch residues in SI1 and SI2 showed severe signs of digestion (Fig. 2), whereas little to no granular residues were left in SI3 and SI4. Digesta of pigs fed IA contained granular starch residuals in all SI compartments. Granules remaining in SI4 showed barely signs of digestion, indicating that granules are either fully digested or left untouched. This heterogeneous digestion of HA starch has been observed previously in vitro, where indeed most residual granules from HA maize starch were largely intact( Reference Evans and Thompson 45 , Reference Brewer, Cai and Shi 46 ).
Comparing in vivo starch digestion kinetics with an in vitro assay
The rate of in vitro starch digestion measured in this study was higher for extruded cereals compared with ground cereals and isolated starch. In addition, the rate of in vitro starch digestion of ground cereals was lower than that of isolated starch. This confirms the results of previous in vitro studies, which showed that the presence of a cereal matrix slows starch digestion( Reference Dhital, Warren and Butterworth 34 , Reference Al-Rabadi, Gilbert and Gidley 47 ) and that extrusion increases starch digestion rates( Reference Sun, Laerke and Jorgensen 36 ). In addition, every form of HA maize starch analysed in this study was digested slower than maize starch of the same form. This is also in agreement with in vitro results, demonstrating a negative correlation between digestion rates and an increased amylose content, B-type of crystalline structure and long amylopectin side chains( Reference van Kempen, Regmi and Matte 19 , Reference Li, Zhang and Luo 30 , Reference Asare, Jaiswal and Maley 48 , Reference Shrestha, Blazek and Flanagan 49 ).
In vitro and in vivo hydrolysis rates were visually compared (Fig. 5), by plotting in vivo starch hydrolysis in all segments of pigs on a single treatment, against the cumulative intestinal retention time (online Supplementary Table S3). For this plot, maltodextrins with DP ≤3 were assumed to be end products of α-amylase hydrolysis( Reference Robyt and French 40 ). In the same figure, in vitro starch hydrolysis was plotted against the incubation time. For extruded starch, the initial rate of starch digestion, in SI1 and SI2, compares well between in vitro and in vivo data. For isolated and ground starch sources, however, the in vitro assay underestimates the initial rate of starch digestion. The extent of in vivo starch digestion in SI1 measured in this study (on average 35 % for all diets) is close to that in the duodenal and initial jejunum of growing pigs fed ground maize (on average 45 %)( Reference Amaral, Amaral and Cantarelli 33 ). In addition, it corresponds well with the extend of starch digested in the first third of the SI of growing pigs fed ground oats (on average 57 %)( Reference Knudsen, Jensen and Hansen 50 ). The difference between in vitro and in vivo starch digestion becomes smaller towards the distal SI for barley and maize starch in isolated or ground form, whether it remains rather constant for IA and GA.
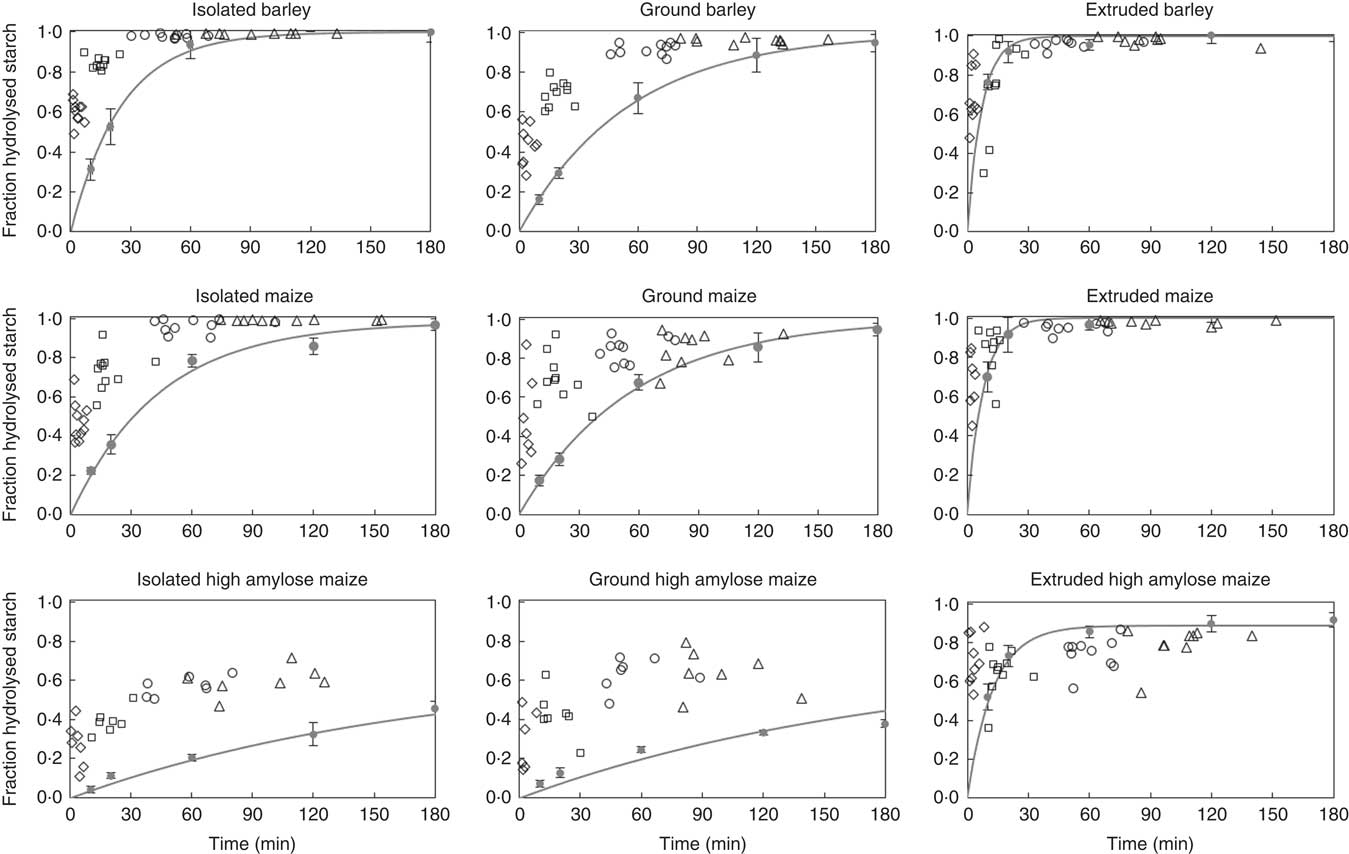
Fig. 5 Digestion coefficients of starch measured in digesta recovered from part 1 (♦), 2 (□), 3 (○) and 4 (∆) of the small intestine of individual pigs fed barley, maize or high-amylose maize based diets which included starch as isolated powder, ground cereal or extruded cereal, plotted against the cumulative retention time. In each graph, in vitro starch hydrolysis is plotted against incubation time. Symbols (●) indicate the average of in triplicate measured values; lines represent the first-order kinetic model fitted to the data points. Error bars represent the standard deviation of in vitro measured starch digestion.
The similarity between our in vivo data and results of previous studies( Reference Amaral, Amaral and Cantarelli 33 , Reference Knudsen, Jensen and Hansen 50 ), emphasises that the in vitro method systematically underestimates the initial in vivo rate of starch digestion. This contributes to the ongoing debate on the predictability of in vivo data by in vitro assays( Reference Hasjim, Lavau and Gidley 51 , Reference Bohn, Carriere and Day 52 ). Amongst others, the absence of brush-border enzymes in the in vitro assay may result in an underestimation of in vivo starch digestion( Reference Dhital, Lin and Hamaker 53 , Reference Ao, Quezada-Calvillo and Sim 54 ). Alternatively, digestion processes initiated in the stomach may partly explain the rapid initial starch hydrolysis in vivo. This includes the possibility of starch hydrolysis in the stomach but also alterations of the digesta matrix inadequately simulated in vitro. Finally, errors in the measurement of in vivo digesta passage kinetics may contribute to differences between in vivo and in vitro results.
All starch that is digested in vitro in 120 min, but not in 20 min, can be considered SDS according to Englyst’ classification( Reference Englyst, Kingman and Cummings 20 ). This fraction corresponds to a gradual and prolonged glucose release in vivo, leading to an extended glycaemic index( Reference Zhang and Hamaker 55 ). Barley and maize diets, containing starch in isolated or ground form, were high in SDS according to in vitro digestion but did not release a relevant amount of glucose in the distal part of the SI. IA and GA contained 33 % in vitro digestible starch, of which 20 % was characterised as RDS and 80 % as SDS. In contrast, IA and GA were in vivo digested for 65 and 68 %, respectively, of which half disappeared from the SI within the first 10 min. The fraction of intact starch barely differed between SI3 and SI4 (Fig. 1), which indicates that starch escaping initial hydrolysis in vitro does not necessarily lead to an increase in starch hydrolysis in more distal parts of the SI. Consequently, the in vivo glucose release, and thus glucose absorption, is less gradual than expected based on in vitro analysis.
Conclusions
Starch digestion for barley and maize is primarily determined by the cereal matrix, whereas digestion of HA maize is limited by intrinsic starch properties. The presence of soluble maltodextrins in SI digesta illustrates that a combination of α-amylase and brush-border enzymes determine the rate of in vivo starch digestion, but that variation in starch digestion kinetics, caused by the feed matrix, is not adequately predicted by current in vitro methods. The underestimation of initial starch digestion in vitro indicates that the role of the stomach on starch digestion is currently underestimated. The present results indicate that glucose release from SDS is less gradual than predicted from in vitro analysis.
Acknowledgements
The authors would like to thank Ruud Dekker, Pieter Roskam, Tiny Franssen-Verheijen, Tamme Zandstra, Marit Noorloos (Wageningen University and Research, Wageningen, the Netherlands), Jos van Hees, and animal caretakers at the Laverdonk Research Farm (Agrifirm North West Europe, Heeswijk-Dinther, the Netherlands) for their advice and/or skilled assistance during the set-up and practical work of this study.
This project is jointly financed by the Topsector Agri&Food and Agrifirm as coordinated by the Dutch Carbohydrate Competence Center (CCC-ABC; www.cccresearch.nl).
B. M. J. M., H. A. S., E. M. A. M. B. and W. J. J. G. designed the experiment. B. M. J. M. and T. F. conducted research. B. M. J. M., S. d. V. and W. J. J. G. performed statistical analysis. B. M. J. M. wrote the manuscript. S. d. V., H. A. S., E. M. A. M. B. and W. J. J. G. revised the manuscript. All authors have read and approved the final manuscript.
All authors declare that they have no conflicts of interest.
Supplementary material
For supplementary material/s referred to in this article, please visit https://doi.org/10.1017/S0007114519000503