


Insulin resistance is the first detectable defect in the pathogenesis of metabolic diseases (e.g. type 2 diabetes (T2D)( Reference Petersen, Dufour and Savage 1 )) and can, along with the associated impairment in glucose tolerance, independently predict risk of CVD and mortality( 2 ). Glucose tolerance and insulin sensitivity can be quantified in vivo using an oral glucose tolerance test (OGTT). Indeed, the OGTT is frequently employed in both clinical (to diagnose T2D) and research settings (to assess the efficacy and/or effectiveness of exercise or dietary interventions for altering blood glucose control). After an overnight fast, a 75 g glucose load is ingested and followed by an observation period (usually 120 min) where blood samples are collected to determine glucose concentrations. If combined with insulin measurements, estimates of whole-body insulin sensitivity can be derived that are more representative of free-living physiology than other measures such as the hyperinsulinaemic–euglycaemic clamp( Reference Belfiore, Iannello and Volpicelli 3 – Reference Stumvoll, Mitrakou and Pimenta 6 ).
However, guidelines for the OGTT provide no clear consensus or justification for the most appropriate method for blood sampling. Consequently, oral glucose tolerance and OGTT-derived estimates of insulin sensitivity are determined from blood sampled from antecubital veins( Reference Gonzalez, Veasey and Rumbold 7 ), capillaries( Reference Gonzalez, Barwood and Goodall 8 ), heated dorsal hand veins( Reference Chowdhury, Richardson and Holman 9 ) and glucose concentrations in the interstitial fluid( Reference Chowdhury, Richardson and Holman 9 ). In some instances, the blood sampling method (i.e. the sample site used) is not reported, including in the validation of a commonly cited (>2500 times) oral glucose-derived insulin sensitivity index (ISI)( Reference Matsuda and DeFronzo 5 ). Arterial blood best represents the exposure of peripheral tissues such as skeletal muscle to systemic metabolites and hormones. When knowledge of peripheral exposure to glucose and insulin is required, arterial samples are therefore preferable. However, due to the potential risks associated with arterial cannulation( Reference Hall 10 ), alternative methods are often used to provide blood reflective of arterial samples (commonly referred to as arterialised–venous or arterialised blood), including the heated-hand technique( Reference Abumrad, Rabin and Diamond 11 – Reference Sonnenberg and Keller 17 ).
Nonetheless, many studies derive oral glucose tolerance and insulin sensitivity from (non-arterialised) venous blood via an antecubital vein, under conditions where the activity and/or feeding status of participants is manipulated( Reference Gonzalez, Veasey and Rumbold 7 ). Some guidelines provide corrections for venous to capillary plasma for an OGTT, but only at rest( 18 ). However, concentrations of metabolites or hormones in a vein can differ due to their net uptake or release from tissue beds, which depends on environment, nutritional and/or metabolic factors. For example, a bout of endurance-type exercise increases insulin sensitivity and glucose uptake in active muscle( Reference Goodyear, Laurie and Kahn 19 ) and can impair insulin sensitivity in non-exercised muscle( Reference Devlin, Barlow and Horton 20 ). This prohibits venous-to-arterialised corrections, or direct comparisons between studies that have used different, but common, methods for obtaining blood samples (i.e. arterialised blood from a heated dorsal hand vein v. sampling from an antecubital vein).
A direct comparison of arterialised and venous blood, for estimates of glucose tolerance and OGTT-derived insulin sensitivity, under different metabolic conditions (i.e. when prior exercise has been completed) has never been performed. As such, the aim of this study was to: (1) establish if OGTT-derived insulin sensitivity indices differ when calculated from arterialised v. venous blood samples and (2) investigate whether prior lower-limb exercise influences the magnitude of any differences between arterialised and venous concentrations of glucose or insulin.
Methods
Trial design
This study adopted a cross-over design, whereby participants completed preliminary measures followed by exercise and rest trials in a randomised order (randomisation performed by Robert Edinburgh using an online tool: randomizer.org), separated by an interval of 7–21 d. On main trial days, an hour of moderate-intensity cycling or rest (lying recumbent on a bed) was followed by an OGTT, during which blood samples were collected simultaneously from a pre-heated dorsal hand vein (arterialised) and an antecubital vein of the contralateral arm (venous). All trials were completed at the University of Bath (Bath, UK) in accordance with the Declaration of Helsinki. The study was approved by the Research Ethics Approval Committee for Health at the University of Bath (reference: EP 15/16 44).
Participants
A total of ten self-reported physically active and healthy men (age: 23 (sd 3) years; body mass: 76·9 (sd 5·7) kg; height: 181·6 (sd 4·5) cm; BMI: 23·3 (sd 1·8) kg/m; VO2 peak: 52·7 (sd 8·9) ml/kg per min) were recruited from the staff and student population at the University of Bath, between November 2015 and April 2016. Exclusion criteria included any history of metabolic disease, or any condition that might have posed undue personal risk to the participant or have introduced bias to the experiment. Written, informed consent was obtained from all participants before testing.
Preliminary testing
Upon arrival at the laboratory, height was measured to the nearest 0·1 cm with a stadiometer (Seca Ltd), with participants barefoot in the Frankfurt plane. Body mass was measured with participants in light clothing and to the nearest 0·1 kg using electronic weighing scales (BC543 Monitor; Tanita). An incremental cycling test was then completed at a self-selected cadence on an electronically braked ergometer (Excalibur Sport; Lode®). Participants were allowed to adjust the saddle and handlebar heights to their preferred position. The initial power output was set at 50 W and was increased by 50 W every 4 min, for four stages. Thereafter, the power output was increased by 20 W every 1 min until volitional exhaustion. Heart rate was monitored throughout (Polar Electro Oy) and breath-by-breath measurements were recorded using an online gas analysis system (TrueOne2400; Parvomedics). The volume and gas analysers used were calibrated with a 3 litre calibration syringe (Hans Rudolph) and known concentrations of a calibration gas (16·04 % O2; 5·06 % CO2) respectively. Maximal power output (MPO) was taken as the work rate of the last completed stage, plus the fraction of time in the final non-completed stage, multiplied by the work rate increment. Peak oxygen uptake (VO2 peak) was taken as the highest average over a rolling 30 s period.
Main trials
Participants arrived at 08.00 (sd 1) h, after a minimum 10 h overnight fast and having refrained from strenuous physical activity and caffeine for 24 h. They were asked to record their evening meal and physical activity on the day before the first trial and replicate this for the second visit, in line with standard procedures for postprandial glucose tolerance testing( Reference Brouns, Bjorck and Frayn 21 ). Upon arrival, participants placed their dominant hand into a heated-air box set to a constant temperature of 55°C (Mass Spectrometry Facility; The University of Vermont & the University of Vermont Medical Center). After 20 min, intravenous cannulae (BD Venflon Pro; BD) were fitted in the heated dorsal hand vein (retrograde) and the antecubital fossa of the contralateral arm (antegrade). A simultaneous baseline 5 ml blood sample was drawn from each site to be used as a baseline sample. Cannulae were kept patent via flushing of a 0·9 % sodium chloride infusion (B. Braun) and the first 2 ml of each sample was thus discarded. Plasma was obtained by dispensing whole blood into EDTA acid-coated tubes (BD) which were centrifuged for 10 min (4°C and 3500 g ) (Heraeus Biofuge Primo R; Kendro Laboratory Products Plc.). Samples were dispensed into 0·5 ml aliquots and immediately frozen at −20°C, before longer-term storage at −80°C.
On the exercise trial, participants completed 60 min of cycling on an ergometer (Monark 894E; Monark) at 50 % MPO. On the rest trial, they remained in the recumbent position throughout this period and were permitted to complete resting activities (i.e. watching television or reading). In both trials, an OGTT was then performed. Participants ingested 82 g of dextrose powder (Myprotein) dissolved in 300 ml of water (equivalent to 75 g of anhydrous glucose). Whole blood (5 ml) was collected immediately prior to (OGTT 0 min) and every 15 min post-ingestion of the glucose load from the heated dorsal hand vein and the antecubital vein of the contralateral arm simultaneously, and processed via aforementioned methodology.
Expired gas samples were collected at baseline and hourly during the OGTT for 5 min, and for 1 min at 15-min intervals during exercise (and same time points in the rest trial). Gas samples were collected into 200 litre Douglas Bags (Hans Rudolph) via falconia tubing (Baxter, Woodhouse and Taylor Ltd). Concurrent measurements of inspired air composition were made, to correct for changes in ambient O2 and CO2 concentrations. Expired O2 and CO2 concentrations were measured in a known volume of sample, using paramagnetic and IR analysers (Mini HF 5200; Servomex Group Ltd).
Data analysis
Plasma glucose, lactate and TAG concentrations were measured on an automated analyser (Daytona; Randox Laboratories) according to manufacturer’s instructions. Plasma insulin concentrations were determined using a commercially available ELISA (Mercodia AB; intra-assay CV, 3·7 %; inter-assay CV 6·5 %). Samples were analysed in batch after all data collection was completed, and for every participant, all samples from both trials were analysed on the same plate.
Energy expenditure and substrate utilisation were determined for rest, exercise and during the OGTT via indirect calorimetry. Assuming urinary N excretion to be negligible, substrate utilisation was calculated using stoichiometric equations and adjusted for exercise values to account for the contribution of glycogen( Reference Jeukendrup and Wallis 22 ):
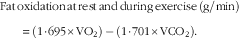 $$\eqalign{&{\rm \!\!\!\!Fat}\,{\rm oxidation }\,{\rm at }\,{\rm rest }\,{\rm and }\,{\rm during}\,{\rm exercise} \,({\rm g/min}) \cr \quad \,{\equals\,} \left( {1\!\cdot\!695 {\times} {\rm VO}_{2} } \right) {\,\minus\,} \left( {1\!\cdot\!701 {\times} {\rm VCO}_{2} } \right).$$
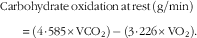 $$\eqalign{&{\rm \!\!\!\!\!\!\!\!\!\!\!\!\!\!\!\!\!\!\!\!\!\!\!\!\! Carbohydrate }\,{\rm oxidation }\,{\rm at }\,{\rm rest \,}({\rm g/min}) \cr \!\!\!\!\!\!\!\!\!\!\!\!\!\!{\equals\,}{\rm }\left( {4\!\cdot\!585 {\times}{\rm VCO}_{2} } \right){\,\minus\,}\left( {3\!\cdot\!226{\rm }{\times}{\rm VO}_{2} } \right).$$
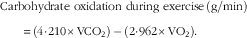 $$\eqalign{&{\rm Carbohydrate \,\,}{\rm oxidation}\,\,{\rm during}\,\,{\rm exercise}\,{\rm }({\rm g/min}) \cr \,\,\,\,\,\quad{\equals\,}\left( {{\rm 4}\!\cdot\!{\rm 210 }{\times}{\rm VCO}_{2} } \right){\,\minus\,}\left( {{\rm 2}\!\cdot\!{\rm 962 }{\times}{\rm VO}_{2} } \right).$$
At rest, these calculations assume that glucose provides all of the carbohydrate required for metabolism. Adjustments were made for estimations of carbohydrate oxidation during moderate-intensity exercise, where metabolic requirements are met by both glucose and glycogen, which typically provide a 20 and 80 % contribution respectively( Reference Jeukendrup and Wallis 22 ). Energy expenditure was determined assuming that lipids, glucose and glycogen provide 40·81, 15·64 and 17·36 kJ/g, respectively( Reference Jeukendrup and Wallis 22 ).
Statistical analysis
A sample size estimation was performed using fasting glucose concentrations sampled from arterialised and venous blood (4·70 (sd 0·19) v. 4·52 (sd 0·19) mmol/l, for arterialised v. venous, respectively)( Reference Liu, Moberg and Kollind 13 ). Using the calculated effect size of 1·33, ten participants were required to provide an 80 % chance of detecting a statistical difference between arterialised and venous blood for glucose with an α-level of 0·05.
The area underneath the concentration-time curve (AUC) for the plasma glucose and plasma insulin OGTT responses was calculated using the trapezoid rule. The total AUC (mmol/l,120 min) was divided by the duration of the OGTT observation period (120 min) to provide a time-averaged AUC (mmol/l), which was used as a summary measure for the reported postprandial responses. Insulin sensitivity indices were calculated as described in the relevant table or figure( Reference Cederholm and Wibell 4 – Reference Stumvoll, Mitrakou and Pimenta 6 , Reference Katz, Nambi and Mather 23 , Reference Levy, Matthews and Hermans 24 ). For comparisons of multiple means, a two-way repeated measures trial (exercise or rest)×sample method (arterialised or venous) ANOVA was employed. Where significant trial×sample method interactions were detected, t tests were performed to locate variance, and corrected for multiple comparisons using Sidak’s multiple comparison test. A Pearson r was used to correlate the arterialised–venous difference after rest against the arterialised–venous difference after exercise. Data are presented as mean values and standard deviations in text and means and 95 % CI in figures unless otherwise stated. All statistical analysis was completed using a commercially available software package (GraphPad Software, Inc.). In one participant’s exercise trial the 105- and 120-min post-OGTT blood samples were not collected from both sampling methods, and for these time points (1 % of total samples collected across the study) the last observation carried forward approach was used. Statistical significance was accepted at P≤0·05.
Results
Energy expenditure and substrate utilisation
The exercise was completed as prescribed, except for one participant for whom the intensity was decreased to 45 % MPO for the final 30 min due to his inability to maintain an intensity of 50 % MPO. Exercise intensity was equivalent to 63 (sd 5) % VO2 peak. In the rest trial, energy expenditure was 5·68 (sd 0·55) kJ/min in the hour before the OGTT and rates of carbohydrate and fat oxidation were 0·14 (sd 0·07) and 0·09 (sd 0·04) g/min, respectively. In the exercise trial, energy expenditure during cycling was 51·00 (sd 5·51) kJ/min and carbohydrate and fat oxidation rates were 2·21 (sd 0·41) and 0·38 (sd 0·16) g/min, respectively. During the OGTT, no difference was detected between trials in energy expenditure or substrate oxidation (all P>0·05).
Plasma glucose concentrations
At baseline, there was no difference in plasma glucose concentrations measured in arterialised compared with the venous samples in the rest (5·31 (sd 0·35) v. 5·27 (sd 0·28) mmol/l, respectively, P>0·05) or exercise trials (5·25 (sd 0·47) v. 5·18 (sd 0·37) mmol/l, respectively, P>0·05). Immediately before the OGTT, plasma glucose concentrations were higher in arterialised compared with venous samples after rest (Table 1; P=0·02) but not after exercise (P>0·05). After rest, glucose concentrations were higher at 30 and 45 min post-OGTT in arterialised relative to venous plasma (Fig. 1(a); all P<0·05). In the exercise trial glucose concentrations did not differ between arterialised or venous plasma at any time post-glucose ingestion (Fig. 1(b); all P>0·05). Glucose AUC was higher when calculated from arterialised relative to venous plasma after rest and after exercise (Fig. 3(a); both P<0·01). However, the arterialised–venous difference was greater after rest (0·99 (sd 0·46) mmol/l) relative to after exercise (0·56 (sd 0·24) mmol/l) (Fig. 3(a); P<0·01). When analysed independently, 120 min post-OGTT glucose concentrations were higher in arterialised relative to venous plasma, and in both trials (Table 1; P<0·05). When recommended adjustments for venous to capillary plasma were applied (venous plasma+1·1 mmol/l( 18 )), glucose concentrations were higher in corrected venous compared with arterialised plasma (Table 1; P<0·05). For the plasma glucose AUC, the magnitude of the arterialised–venous difference after rest was positively correlated with the magnitude of the arterialised–venous difference after exercise (r 0·800, P<0·01).

Fig. 1 Plasma glucose concentrations during an oral glucose tolerance test (OGTT) after rest (a) or after exercise (b). Data are samples collected simultaneously from a pre-heated dorsal hand vein (arterialised; ![]() ) and the antecubital fossa of a contralateral arm (venous;
) and the antecubital fossa of a contralateral arm (venous; ![]() ). Values are means (n 10) and 95 % CI. * Significant differences between arterialised and venous samples (P<0·05).
). Values are means (n 10) and 95 % CI. * Significant differences between arterialised and venous samples (P<0·05).
Table 1 Plasma concentrations and time-averaged area underneath the concentration-time curve (AUC) for various metabolites, and insulin sensitivity indices (ISI) from the oral glucose tolerance test (OGTT)Footnote * (Mean values and standard deviations; n 10)

au, Arbitrary units; HOMA2-IR, homeostatic model assessment of insulin resistance; QUICKI, quantitative insulin sensitivity check index.
* Data are samples collected simultaneously from a pre-heated dorsal hand vein (arterialised) and the antecubital fossa of the contralateral arm (venous).
† Significant difference between arterialised and venous blood samples (P<0·05).
‡ Significant sample method v. trial interaction (P<0·05). ISIStumvoll=0·226−(0·0032×BMI (kg/m2))−(0·000064×plasma insulin at OGTT 120 (mIU/ml))−(0·0037×plasma glucose at OGTT 90 (mmol/l))( Reference Stumvoll, Mitrakou and Pimenta 6 ). HOMA2-IR=calculated as per instructions: https://www.dtu.ox.ac.uk/homacalculator/download.php ( Reference Levy, Matthews and Hermans 24 ). QUICKI=1/(log plasma insulin at OGTT 0 (mIU/ml)+log plasma glucose at OGTT 0 (mg/dl))( Reference Katz, Nambi and Mather 23 ).
§ Significant difference between arterialised and venous blood samples (P<0·01).
Plasma insulin concentrations
At baseline, there was no difference in plasma insulin concentrations measured in arterialised relative to the venous samples in the rest (21·26 (sd 4·26) v. 20·49 (sd 4·47) pmol/l, respectively, P>0·05) or exercise trials (22·39 (sd 6·78) v. 21·55 (sd 5·93) pmol/l, respectively, P>0·05). Thereafter, there were no difference in plasma insulin concentrations measured in arterialised compared with venous samples at any time point in the rest (Fig. 2(a)) or exercise trials (Fig. 2(b); both P>0·05). The time-averaged insulin AUC was higher if calculated from arterialised plasma relative to venous plasma after rest and after exercise (Fig. 3(b); both P<0·01). No trial×sample method interaction was detected, indicating that the arterialised–venous difference was similar across the two trials (17·7 (sd 16·8) v. 11·2 (sd 6·7) pmol/l for rest v. exercise, P=0·13). For the plasma insulin AUC, the arterialised-venous difference after rest was positively correlated with the arterialised–venous difference after exercise (r 0·790, P<0·01). When data from both trials were pooled, the arterialised–venous difference for insulin AUC was positively correlated with the arterialised–venous difference in glucose AUC (r 0·766, P<0·01).

Fig. 2 Plasma insulin concentrations during an oral glucose tolerance test (OGTT) after rest (a) or after exercise (b). Data are samples collected simultaneously from a pre-heated dorsal hand vein (arterialised; ![]() ) and the antecubital fossa of a contralateral arm (venous;
) and the antecubital fossa of a contralateral arm (venous; ![]() ). Values are means (n 10) and 95% CI.
). Values are means (n 10) and 95% CI.

Fig. 3 Time-averaged area under the plasma glucose (a) and plasma insulin (b) concentration-time curves, and insulin sensitivity index (ISI)Matsuda (c) and ISICederholm (d) indices after rest or exercise. Data are samples collected simultaneously from a pre-heated dorsal hand vein (arterialised; ![]() ) and the antecubital fossa of a contralateral arm (venous;
) and the antecubital fossa of a contralateral arm (venous; ![]() ). Values are means (n 10), and 95 % CI represented by vertical bars. ISIMatsuda=10 000/(baseline glucose (mg/dl)×baseline insulin (mIU/ml))×(mean glucose over 120 min (mg/dl)×mean insulin over 120 min (mIU/ml))(
Reference Matsuda and DeFronzo
5
). ISICederholm=75 000+(baseline glucose (mmol/l)−glucose at oral glucose tolerance test (OGTT) 120 (mmol/l))×0·19×180×1·15×body mass (kg)/(120×log mean insulin over 120 min (mIU/ml)×mean glucose over 120 min (mmol/l))(
Reference Cederholm and Wibell
4
). au, Arbitrary units.
). Values are means (n 10), and 95 % CI represented by vertical bars. ISIMatsuda=10 000/(baseline glucose (mg/dl)×baseline insulin (mIU/ml))×(mean glucose over 120 min (mg/dl)×mean insulin over 120 min (mIU/ml))(
Reference Matsuda and DeFronzo
5
). ISICederholm=75 000+(baseline glucose (mmol/l)−glucose at oral glucose tolerance test (OGTT) 120 (mmol/l))×0·19×180×1·15×body mass (kg)/(120×log mean insulin over 120 min (mIU/ml)×mean glucose over 120 min (mmol/l))(
Reference Cederholm and Wibell
4
). au, Arbitrary units.
Insulin sensitivity indices
The OGTT-derived ISIMatsuda was lower if calculated from arterialised compared with venous plasma in both trials (Fig. 3(c); P<0·01). A trial×sample method interaction indicated that the arterialised–venous difference was greater after rest (1·97 (sd 0·81) arbitrary units (au)) compared with after exercise (1·35 (sd 0·57) au) trial (Fig. 3(c); P=0·03). Similarly, the ISICederholm was lower if calculated from arterialised relative to venous plasma after rest and after exercise (Fig. 3(d); both P<0·01). The arterialised-venous difference was also greater after rest compared with after exercise (14·76 (sd 7·83) v. 8·70 (sd 3·95) au, respectively; Fig. 3(d); P<0·01).
There was a small but statistically significant difference for ISIStrumvoll after rest, with calculated values lower when derived from arterialised, relative to venous plasma (P<0·01). After exercise, a similar trend was observed, but the difference between sampling methods did not reach statistical significance in this instance, and no significant trial×sample method interaction effect was detected for this outcome (Table 1; both P=0·08). The homeostatic model assessment of insulin resistance (HOMA2-IR) index was higher if calculated from arterialised relative to venous plasma at rest (Table 1; P=0·02) but no difference was detected between sample methods after exercise (P>0·05). The quantitative insulin sensitivity check index (QUICKI) was lower if calculated from arterialised, relative to venous plasma after rest (Table 1; P=0·01). A similar trend was also apparent after exercise, but the difference between sampling methods did not reach statistical significance in this instance (P=0·12). No significant trial×sample method interaction effect was detected for HOMA2-IR or QUICKI (P>0·05).
Other metabolites
Immediately before the OGTT, plasma lactate concentrations were not different in arterialised relative to venous samples, and this was apparent in both the exercise and rest trials (Table 1; both P>0·05). Lactate AUC was not significantly different if calculated from arterialised or venous plasma after rest or after exercise (Table 1; both P>0·05). Before the OGTT, plasma TAG concentrations were not affected by sample method used after rest (Table 1; P>0·05), but after exercise concentrations were higher in venous relative to arterialised samples (P<0·01). TAG AUC was unaffected by sample method after rest and exercise (Table 1; both P>0·05). No trial×sample method interaction effect was detected for either the lactate or TAG AUC.
Discussion
This study demonstrates that venous blood samples produce different values with respect to both glucose tolerance and insulin sensitivity indices, when compared with arterialised blood samples. Furthermore, when assessing whole-body glucose tolerance, differences between these sampling methods are not consistent under different metabolic conditions (e.g. when a prior bout of endurance-type exercise is performed, compared with after rest) and so no single venous-to-arterialised correction factor can always be applied.
It has been known for decades that post-meal blood glucose concentrations can predict future risk of metabolic diseases( Reference Jarrett and Keen 25 ). Thus, glucose tolerance and OGTT-derived insulin sensitivity indices are widely used in research to assess disease risk and responses to lifestyle or pharmacological interventions. Whilst arteries are the preferred site for determining peripheral exposure to metabolites or hormones, antecubital veins are a common site for postprandial blood sampling, due to risks associated with arterial cannulation. Nonetheless, it has been known since at least the 1920’s that heating the hand to approximately 37°C causes the cutaneous capillary beds to vasodilate as part of a homoeostatic mechanism to radiate heat( Reference Goldschmidt and Light 26 ). This results in the dorsal veins of a heated hand providing concentrations of metabolites (e.g. glucose, NEFA, amino acids and lactate) and hormones (e.g. insulin and glucagon) that are consistent with arterial blood( Reference Abumrad, Rabin and Diamond 11 – Reference Sonnenberg and Keller 17 ). Even increasing ambient temperature produces higher postprandial concentrations of glucose and insulin if sampled in venous blood, due to partial arterialisation( Reference Frayn, Whyte and Benson 27 , Reference Dumke, Slivka and Cuddy 28 ).
The data presented here also show that postprandial glucose concentrations are higher if measured in arterialised, relative to venous plasma, but importantly the magnitude of this difference is influenced by the activity status of participants at the time when the OGTT is performed. This means that when glucose tolerance or insulin sensitivity are assessed with an OGTT, it is essential to report the blood sampling procedure that is used, as this could influence the interpretation of reported findings and will allow for more appropriate comparisons between studies that have used different sampling methods.
Immediately prior to the OGTT, plasma glucose concentrations were higher in arterialised relative to venous plasma after rest, but there was no difference between sample methods when a prior bout of exercise was performed. After rest, differences were detected when indices of insulin resistance that use fasting concentrations of glucose and insulin were calculated from arterialised v. venous plasma (i.e. HOMA2-IR and QUICKI), but the absence of a trial×sample method interaction suggests that the arterialised–venous difference is uninfluenced by activity status. In line with previous results, we showed that in both trials the postprandial glucose AUC was greater if calculated from arterialised, relative to venous plasma. Importantly, these novel data demonstrate that the arterialised–venous difference was lower if the OGTT was performed after a bout of exercise, compared with after rest. Therefore, when assessing glucose tolerance, venous samples cannot be adjusted by a consistent correction to provide an equivalent to arterial concentrations. Estimates of insulin sensitivity, including ISIMatsuda and ISICederholm, were also influenced by the sample method used, with venous blood providing higher values. The magnitude of the arterialised–venous difference was also greater after rest relative to after exercise, again preventing consistent corrections being readily applied.
These results also have implications when determination of absolute glucose concentrations is required, such as when assessing hypo- and hyperglycaemia. For example, peak postprandial plasma glucose concentrations and associated measures (i.e. time-to-peak) have implications for risk of metabolic disease and are often included as intervention outcomes( Reference Bonora 29 ). Our results demonstrate that 120 min post-OGTT and peak plasma glucose concentrations are higher in arterialised relative to venous plasma. If suggested corrections are applied to obtain capillary concentrations from venous plasma( 18 ), corrected venous glucose concentrations are greater than those measured in arterialised blood. As such, these corrections may need to be revisited.
It is beyond the scope of this work to establish the underlying mechanisms for the smaller arterialised–venous difference in glucose AUC after exercise compared with after rest. It is likely that the cycling induced localised insulin resistance in the non-exercising forearm( Reference Devlin, Barlow and Horton 20 ), potentially due to lipid deposition in non-exercise muscle( Reference Schrauwen-Hinderling, Van Loon and Koopman 30 ). This may have reduced glucose uptake across the forearm, reducing the difference in concentrations between the arterialised and venous samples in the exercise condition. The smaller difference could also be explained by an increase in forearm blood flow post-exercise( Reference Green, Bilsborough and Naylor 31 ).
Also of interest is the exploratory observation that participants with larger arterialised–venous differences for the plasma glucose and insulin AUC after rest, tended to have larger arterialised–venous differences for these outcomes after exercise. It is plausible that this may be attributable to differences between the participants in forearm muscle mass, and/or the anatomy of their vasculature, but this was not possible to ascertain from the current study.
To conclude, venous blood provides lower postprandial glucose concentrations and higher estimates of insulin sensitivity than arterialised samples, when common indices are applied. Moreover, the variation in plasma glucose concentrations between venous and arterialised samples is different after exercise compared with after rest, and thus corrections cannot readily be applied across all conditions. These results indicate that the method used for blood sampling (i.e. heating the hand for arterialised blood or sampling from an antecubital vein) is an important consideration when comparing studies that estimate glucose tolerance or insulin sensitivity from oral glucose loads.
Acknowledgements
The authors thank the volunteers for their time and effort in participating in this study. The authors also thank Iain Templeman, Oliver J. Perkin and Harriet A. Carroll for assistance with blood sampling during some trials.
This study was partly supported by The European Society for Clinical Nutrition and Metabolism (grant no. Z0011); and The Rank Prize Funds (grant no. Z0078).
R. M. E. analysed the data; R. M. E., J. T. G., J. A. B. and D. T. designed the research; R. M. E., H. A. S., A. H. and J.-P. W. conducted the research; H. A. S., A. H., J.-P. W., J. A. B. and D. T. contributed to writing the paper; R. M. E. and J. T. G. wrote the paper.
The supporting data are openly available at http://opus.bath.ac.uk
None of the authors has any conflicts of interest to declare.


