


CLINICIAN’S CAPSULE
What is known about the topic?
The first two articles of this quality improvement (QI) Primer Series for emergency medicine (EM) clinicians reviewed foundational steps to prepare for and execute a QI project.
What did this study ask?
This article focused on the measurement, evaluation, and sustainability of QI projects.
What did this study find?
Run charts are used to represent the temporal relationship visually between interventions and the measures of interest. Sustainability of projects can be achieved through the use of specific frameworks, tools, and cultural change.
Why does this study matter to clinicians?
QI has grown into an important operational and academic field in EM in recent years, and a better understanding of its methodology would lead to greater improvement in patient care.
INTRODUCTION
Emergency departments (EDs) are a crucial point of access to care for millions of Canadians each year, but the fast-paced and complex nature of ED care can pose threats to patient safety. 1 , 2 Improvements in the quality and safety of ED care have the potential to affect patient outcomes meaningfully. Over the past two decades, which included the publication of two important Institute of Medicine reports on quality improvement (QI) and patient safety (PS), the number of QI and PS projects has grown substantially in all medical disciplines. 3 - 5
This is the third and final article in a series intended as a QI primer for emergency medicine (EM) clinicians; it builds on the example of a project that aims to decrease the time from triage to antibiotic therapy for patients admitted with sepsis. In the first article, we introduced the concept of strategic planning that included stakeholder analysis and engagement; the establishment of a core change team; and three tools for root cause analysis, Ishikawa (fishbone) diagrams, Pareto charts, and process mapping.Reference Chartier, Cheng, Stang and Vaillancourt 6 In the second article, we presented the four steps of a Plan-Do-Study-Act (PDSA) cycle and the Model for Improvement (MFI), a rapid-cycle testing method popularized by the Institute for Healthcare Improvement (IHI) that includes the determination of the aim, measures, and change ideas for a project.Reference Chartier, Stang, Vaillancourt and Cheng 7 This article will introduce the tools used in measuring and evaluating QI projects, such as monitoring the impact of interventions during the PDSA cycles and evaluating the sustainability of outcomes and new practices.
Run charts
Specific tools have been developed in the QI field to evaluate the impact of interventions.Reference Langley 8 Health care providers may be more familiar with analysis methods such as t-tests and chi-square tests, which are used at the end of a study to compare various populations or interventions. However, QI projects require more dynamic monitoring tools that can help inform the project in real time and detect signs of change early so interventions can be refined and retested.
Run charts are a visual way to represent data and demonstrate temporal relationships between various interventions and the measures of interest.Reference Perla, Provost and Murray 9 They are easy to construct without statistical programs or mathematical complexity. They are usually used to identify signals in the data and demonstrate the change (or lack thereof) in a selected quality measure before, during, and after a QI project.Reference Perla, Provost and Murray 9 Another more rigorous and resource-intensive tool used to measure the impact of an intervention that is beyond the scope of this article is a statistical process control (SPC) chart.Reference Provost and Murray 10 SPC charts are used to detect variability in a process with a focus on non-random (or “special cause”) variation.Reference Benneyan, Lloyd and Plsek 11
The core change team of your sepsis project decides to build a run chart to monitor the previously selected process measure of time from triage to antibiotic therapy over a six-month time frame (Figure 1). On the x-axis, you mark the time intervals at which you will collect your data. In the spirit of rapid-cycle testing, this time frame should be as small as is feasible with respect to local resources and logistics of data collection (e.g., weekly intervals). It is useful to collect and display a number of values for the period before the QI project started to obtain an appreciation of baseline performance. On the y-axis, you mark the quality measure of interest that is time to antibiotics. By convention, run charts always display a horizontal “centreline” at the level of the median, that is, the value on the y-axis at which one-half of the data points are above and one-half are below the line. You may also add another line to signify the target or aim of the project. Over the course of your project, your team fills the run chart with weekly measurements. You should also annotate the chart with the timing of the various interventions to show which interventions were associated with which effects over time.

Figure 1 Run chart of your sepsis project. The x-axis represents the weeks before (negative numbers) and during (positive numbers) your QI project; the y-axis represents the time from triage to antibiotics (in hours). The annotations represent the times at which the various change interventions were introduced and then iteratively tested by your team. The continuous horizontal line (i.e., the centreline) represents the median of the entire data set (4.5 hours) and the dashed line represents the project’s target time (three hours). IT = Information technology.
To assist in identifying signals of success or failure in run charts, certain rules derived from statistical probability calculations are useful.Reference Anhøj and Olesen 12 These rules help prevent the natural tendency to overreact to a single and recent data point.Reference Deming 13 For the rules to be applicable, collating at least 10 measurements is usually necessary. We present here four rules for the interpretation of run charts; interested readers can consult the article by Perla et al. to further understand the nuances of these rules.Reference Perla, Provost and Murray 9
∙ Shift rule:
o At least six consecutive data points fall above or below the median line (points on the median are skipped). Given that the mathematical likelihood of being on either side of the median is one in two in a random sample (by definition 50% are above, and 50% are below the line), the likelihood of having six consecutive points (an arbitrarily chosen but agreed-upon number) is 0.5 ^ 6=0.016, which is well below the statistical significance level of p<0.05. Data points #16 (week 7) to #23 (week 14), shown as triangles in Figure 1, exemplify this rule. Data points #27 (week 18) to #35 (week 26) also represent a shift (unmarked).
∙ Trend rule:
o At least five consecutive data points increase or decrease in value (numerically equivalent points are skipped; data points can cross the median line). Similar rules of probability can be used to derive the statistical significance of this rule.Reference Olmstead 14 Data points #25 (week 16) to #31 (week 22), shown as squares in Figure 1, exemplify this rule. Data points #19 (week 10) to #25 (week 16) also represent a trend (unmarked).
∙ Run rule:
o A “run” is a series of points in a row that are all on the same side of the median, and the number of runs in a run chart is determined by counting the number of times that the data line fully crosses the median and adding one. In Figure 1, the data line crosses the median three times (indicated by arrows), so there are four runs. A non-random pattern is signalled by too few or too many runs, as compared with the total number of data points in a run chart, according to established rules based on a 5% risk of failing the run test if the data were truly random.Reference Perla, Provost and Murray 9 , Reference Provost and Murray 10 , Reference Swed and Eisenhart 15 See Appendix 1 for a table of the number of expected runs for run charts with 10 to 60 total data points. For example, if there are too few runs, it may be that a successful intervention has increased or decreased the measure of interest to the point where it is preventing the data line from regressing toward and across the median line, which would occur in a random sample. In the case of your sepsis project, four runs are fewer than the 12 expected in a run chart with 35 total data points, if the data were truly random; therefore, it signals a non-random change in the system.
∙ Astronomical point rule:
o One data point is or many data points are subjectively quite different from the rest visually. This is not a statistical rule but rather a gestalt rule, and it should prompt questions as to whether the result is accurate, meaningful, or even worthy of consideration. Data point #31 (week 22), shown as a diamond in Figure 1, is an astronomical point, which could represent an issue in the data quality.
YOUR SEPSIS PROJECT IN ACTION
As shown in Figure 1, your core change team tested multiple interventions to try to decrease the time to antibiotics for patients with sepsis. Your first PDSA cycle involved an educational intervention, given that you had identified a lack of provider knowledge as an issue through clinician surveys. Unfortunately, as is often the case with this type of intervention, your team’s educational intervention was not successful in driving down the outcome of interest, possibly given the multiple competing priorities faced by your ED colleagues and systemic barriers preventing best practices.Reference Cafazzo and St-Cyr 16 , Reference Grimshaw, Eccles, Lavis, Hill and Squires 17 Your education sessions did, however, inform many colleagues about a quality issue that was not previously known to them. Your second cluster of PDSA cycles involved improving the flagging of stat orders, as described in the second article of this series.Reference Chartier, Stang, Vaillancourt and Cheng 7 Your run chart indicates that this intervention was associated with a demonstrable improvement. Your third PDSA cycle involved the creation of a new policy in facilitating communication between nurses and physicians about sicker patients. Although this policy was well received and likely improved the overall care of patients in your ED, it failed to target patients with sepsis specifically and led to a worsening in time to antibiotics. Finally, your fourth PDSA cycle involved the accelerated placement of patients with severe sepsis in stretchers for assessment. This was done in conjunction with the information technology (IT) department, which enabled a computerized function on the electronic patient tracking board. This last intervention, which ranks higher on the hierarchy of effectiveness, seemed to have improved the time to assessment and time to antibiotics for patients with sepsis. 18
Sustainability
Sustainability has been defined as “when new ways of working and improved outcomes become the norm.”Reference Maher, Gustafson and Evans 19 In other words, the implemented changes that led to improved performance are now ingrained in the workflow and do not require ongoing support to continue. Although sustainability is discussed last in this QI series, it may be one of the most important considerations in a QI project. Many QI experts believe that as hard as improving care is, sustaining the improvements is even harder.Reference Ham, Kipping and McLeod 20 Indeed, a Harvard Business Review article reported that up to 70% of organizational change is not sustained in the corporate world, and the National Health Service (NHS) in the United Kingdom found that one-third of QI projects were not sustained one year after completion.Reference Maher, Gustafson and Evans 19 , Reference Beer and Nohria 21 Some of the reasons identified for these shortcomings include: the waning enthusiasm or turnover of front-line providers as newer, more exciting projects are rolled out; the competing personal or professional interests of managers; the shifting priorities of leaders who support the project through their time and resources; and the tendency of QI teams to declare victory too soon that leads to a shift in focus away from an improvement that may not have been as stable and ingrained as was thought.Reference Buchanan, Fitzgerald and Ketley 22
One of the most important tasks of a QI project leader is to know when to transition from the more active project phase to the longer-term sustainability phase. There are a few factors your core change team should consider when determining the readiness of the project and system for sustainability 23 :
1) Your evaluation (e.g., on a run chart) demonstrates an improved level of performance that has been maintained for a reasonable period of time (weeks or months, depending on the project and measurement intervals).
2) The changes have been tested with various combinations of staff, as well as at different times and/or locations (if applicable).
3) There is infrastructure in place (e.g., equipment, supplies, and personnel) to support the project in the long run. This does not mean that significant resources must be dedicated to the project, but rather that the intensity of changes must match the ability of the system to support and maintain them.
4) There are mechanisms and people in place to continue monitoring system performance (if it is feasible and is felt to encourage compliance with new processes).
There are a few factors that have been shown to increase the likelihood of sustainability of change projects. Your core change team should consider these while designing the various interventions and change ideas, as they are associated with front-line workers’ uptake and long-term commitment. The Highly Adoptable Improvement model suggests that the success of a health care improvement project depends on the balance between the providers’ perceived value of the initiative and the resulting change in workload.Reference Hayes 24 Additional workload, if not met with added capacity (e.g., resources or support), may lead to increased burden, workarounds, errors, and resistance.Reference Hayes 24 While workers may be willing to alter their standard work processes in the short run if there were a perceived benefit, this change would unlikely be sustained, unless it would make their workload lighter or the value gained would otherwise be substantial and visible.Reference Hayes 24 A few other questions to ask yourself and your team about the changes tested and implemented include whether the changes 25 :
1) Offer a clear advantage compared with the previous work processes
2) Are compatible with the system in place and providers’ values
3) Are simple and easy to use
4) Have a demonstrable and observable impact on the front-line workers
One useful model that can be used to assess the probability of the sustainability of a project is the NHS sustainability model developed by QI experts and front-line workers.Reference Maher, Gustafson and Evans 19 Using practical advice, it helps teams identify opportunities to increase the likelihood that the changes would be sustained, both in the planning and testing stages.Reference Maher, Gustafson and Evans 19 Table 1 shows the three sections and 10 factors included in the model, as well as a selection of the included questions in the model that may help you improve your interventions.
Table 1 The sustainability model

PDSA=Plan-Do-Study-Act.
Modified with permission from Maher et al.Reference Maher, Gustafson and Evans 19
Culture
Batalden and Davidoff, two pioneers of QI science, acknowledged the importance of culture when they stated that measured performance improvement was the result of the application of generalizable scientific evidence to a particular context.Reference Batalden and Davidoff 26 In other words, the settings, habits, and traditions in which a project operates may be as important to its success and sustainability as the change ideas themselves, or even more so.Reference Kaplan, Brady and Dritz 27
There are many ways to understand the environment in which a project operates. One simple, yet effective, method is to break the system down into various segments: the micro, meso, and macro levels.Reference Batalden and Splaine 28 There are various ways to conceptualize these levels, but for the purpose of a local QI project, the micro level is your small core change team and the clinical unit in which the changes are introduced. Ensuring that the team is multidisciplinary and that front-line workers are receptive to change are important factors to consider at the micro level. Planning for and advertising small wins early on in the project is also a good way to generate enthusiasm and gain momentum.Reference Kotter 29 The meso level is a constellation of departments and people who interact with your QI project. For your sepsis project, this would likely involve the entire ED (including medical and nursing leadership), laboratory, microbiology and infectious disease departments, and health IT department. Partnering with key players in each of these departments would likely help in the success of your project. The macro level refers to the organization in which your project takes place, including the senior leadership of your hospital. It can also include the health system in which your hospital operates. Aligning your QI project with hospital-level or external forces may increase the likelihood of long-term success.Reference Kaplan, Provost, Froehle and Margolis 30 For example, framing the aim of your project to decrease the time to antibiotics as a factor in achieving reduced morbidity and mortality could align with your organizational goal of being a high-reliability organization.
QI methods to sustain improvements
Once your project has reached a steady state, you will want to build safeguards to ensure its sustainability. There are many different methods available to sustain change in health care.Reference Ogrinc and Headrick 31 One useful method consists of using visual management tools. One practical way to use this for your sepsis project would be to create a performance board, as shown in Figure 2, that displays an outcome of interest (e.g., time to antibiotics) over relevant time periods. Colours are often used to demonstrate the successes and shortcomings of the project conspicuously.
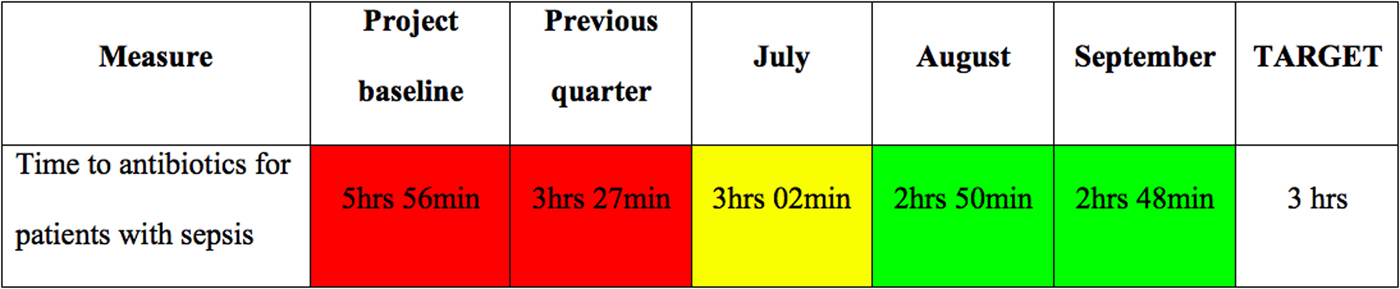
Figure 2 Performance board for your sepsis project. Green background = better than objective; yellow background = less than 10% worse than objective; red background = more than 10% worse than objective.
Another QI method that may help sustain gains is creating a standard work process, which is a simple written or visual description of best practices with respect to the relevant process of care. Although front-line workers sometimes frown upon such one-size-fits-all approaches, decreasing the variability in evidence-based care processes has been associated with improved outcomes.Reference Toussaint 32 , Reference Ballard, Ogola and Fleming 33 The nature of the standard work can be variable and includes posters, training, audits, performance reviews, order sets, and IT constraints, but the specific tool must be tailored to the specific local environment.
A final QI method that can be used to improve sustainability is the improvement huddle. Huddles are regular, short meetings involving all members of a clinical unit that serve as reminders of ongoing projects.Reference Toussaint 32 They can be used to review past, current, and expected levels of performance; discuss reasons for high and low performance; brainstorm change ideas for future PDSA cycles; and assign responsibilities for new ideas and projects.
For your sepsis project, your team elects to continue with the process of stat orders and to strengthen the partnership with the IT department, as they are felt to be the two most sustainable changes in your ED. Given that your ED has a strong culture of peer accountability, you also partner with the ED nurse manager to convene all staff every day for five minutes for team huddles, to review the performance board for the department, and to notify the team of next steps (with regard to this sepsis and other projects).
DISSEMINATION
QI projects are generally local endeavours aimed at improving the care of patients in a specific institution. As a result of this local focus, few project leads think of sharing the lessons they have learned. However, there is tremendous learning to be gained from reading about what has worked, and what has not, in similar settings. There is no reason to reinvent the wheel every time a team wants to tackle sepsis in their ED, as dozens of similar institutions worldwide have already implemented successful initiatives. We suggest that at the outset of a project, teams identify prior work that could inform their own through the use of a Google Scholar search or the Turning Research Into Practice (TRIP) medical database website. Teams should also explore scholarly dissemination options for sharing their lessons learned, which may require obtaining research ethics board approval or exemption from their local institution at the outset of the project. The A pRoject Ethics Community Consensus Initiative (ARECCI) Ethics Screening Tool is a useful tool to determine the types of ethical risks involved and appropriate type of ethics review required for a QI project. 34 Teams should strongly consider adhering to the Standards for Quality Improvement Reporting Excellence (SQUIRE) Guidelines (http://squire-statement.org). There are also respected peer-reviewed journals that focus on the publication of QI projects and studies, such as BMJ Quality & Safety and BMJ Open Quality. Many QI projects, while possibly not suitable for peer-reviewed publication, can still be disseminated through abstracts, posters, or presentations at local rounds or at medical specialty or QI conferences (e.g., Annual Scientific Assembly of the Canadian Association of Emergency Physicians and Health Quality Transformation conference).
CONCLUSION
This article concludes our three-part QI primer for EM clinicians. In the first article, we discussed the work required to prepare for a QI project, including stakeholder engagement and the use of tools to understand the current state of the system. In the second article, we introduced the Model for Improvement to define an effective project and systematically test interventions through rapid-cycle testing. In this final article, we presented methods to evaluate and sustain a QI project, including run charts and their associated rules, the sustainability model, and various QI sustainability tools such as visual management, standard work processes, and huddles. Now that your sepsis team has successfully implemented useful changes in your department, it may be time to turn your attention to longer-term sustainability and consider starting another project to build on the momentum gained.
Acknowledgements
The authors would like to acknowledge the mentorship of Dr. Eddy Lang for his support in the development of this series and Ms. Carol Hilton for her review and improvement of the manuscript.
Competing interests
None declared.
SUPPLEMENTARY MATERIAL
To view supplementary material for this article, please visit https://doi.org/10.1017/cem.2018.380


