


Introduction
This paper examines how incarceration affects children’s subsequent labour market outcomes. Other studies have focused on the effects of incarceration on outcomes such as education or recidivism (Aizer and Doyle, Reference Aizer and Doyle2015, for example) but there are three reasons why labour market impacts are of interest. First, labour market outcomes are path dependent. Incarceration as a child may increase the probability of being out of work as a young person (Apel and Sweeten, Reference Apel and Sweeten2010; Aizer and Doyle, Reference Aizer and Doyle2015) which in turn, can harm later employment and earnings prospects (Gregg, Reference Gregg2001; Gregg and Tominey, Reference Gregg and Tominey2005; Dorsett and Lucchino, Reference Dorsett and Lucchino2018). Hence, youth custody may inflict a lasting penalty on labour market outcomes.
Second, children in custody are disproportionately made up of the most disadvantaged young people. The Taylor Review of the Youth Justice System noted extreme disadvantage in respect of literacy and numeracy, school attendance, exclusions, looked after status and mental health (Taylor, Reference Taylor2016). There is therefore interest from an equity perspective.
Third, incarcerating children is expensive. Young Offender Institutions, which account for the majority of incarcerated children, cost £76,000 per place per year in 2016/17, while Secure Children’s Homes cost £210,000.Footnote 1 If custody harms employment prospects, incarcerating children may also have downstream exchequer costs. Understanding the labour market impact of being incarcerated as a child can help build a fuller appreciation of the overall cost of youth custody.
Estimating the impact of incarcerating children is complicated by the high degree of non-random selection into custody. A U.S. study exploiting quasi-random assignment of defendants to judges who vary in their sentencing tendencies shows that incarceration reduces high school completion and increases adult recidivism in Chicago (Aizer and Doyle, Reference Aizer and Doyle2015). It also suggests negative impacts on employment and earnings, although these are not precisely estimated. Other U.S. studies rely instead on observing all important individual characteristics likely to affect selection (Apel and Sweeten, Reference Apel and Sweeten2010) or use panel data to control for fixed effects (Hjalmarsson, Reference Hjalmarsson2008).
Broadly, there are two channels through which incarceration may harm later labour market outcomes. First, it might alter children’s characteristics and behaviour. Incarceration interrupts schooling and can result in children being ‘left behind’. With poorer qualifications, they are then less able to compete for jobs. Mental health can suffer, leading to behavioural problems (Forrest et al., Reference Forrest, Tambor, Riley, Ensminger and Starfield2000). Equally, incarcerated children are likely to be exposed to negative peer influences (Bayer et al., Reference Bayer, Hjalmarsson and Pozen2009), which may consolidate antisocial behaviour (Dodge et al., Reference Dodge, Dishion and Lansford2006) and cause further disengagement from the labour market.
Second, labelling theory suggests that formal criminal justice intervention is likely to result in a negative self-concept (Restivo and Lanier, Reference Restivo and Lanier2015), blocked opportunities (McAra and McVie, Reference McAra and McVie2007, for example, show police discrimination against prior offenders) and increased likelihood of associations with other “delinquents” (Paternoster and Iovanni, Reference Paternoster and Iovanni1989), all of which may lead to recidivism and, by implication, to poor labour market outcomes. There may be considerable variation within this broad framework. Emms et al. (Reference Emms, Povey and Clift1986), for example, explore racial differences in self-concept among young offenders, arguing that it may vary between groups and also that it may change over time. Individuals who have experienced custody might subsequently be stigmatised by schools and employers (Bernburg and Krohn, Reference Bernburg and Krohn2003). Such discrimination provides a more direct link between the label of criminality and labour market outcomes.
These mechanisms are context-dependent. Much of the existing empirical evidence relates to the case of the U.S. and may not be informative of other countries with different criminal justice systems. The main contribution of this paper is to provide evidence specific to the case of England. Specifically, we address the following research question:
What effect does incarceration as a child have on employment and earnings as a young adult?
We consider children reaching the age of 18 between 2014 and 2017. The oldest of these children reached the age of criminal responsibility in 2004, a time during which punishment played an important role in the English system. The Taylor Review remarked on this and recommended that the youth justice system be changed ‘…so that we see the child first and the offender second.’ A government-commissioned report concluded that the secure estate for children was not fit for purpose (Wood et al., Reference Wood, Bailey and Butler2017) and a subsequent inspection found unacceptably low levels of safety (HM Chief Inspector of Prisons, 2017). Goldson (Reference Goldson2005) argues for the abolition of child imprisonment on the grounds of it focusing only on punishment and failing to achieve any positive longer-term outcomes. Expanding on this, Goldson (Reference Goldson2006) highlights the inherent violence associated with incarcerating children and the harm, sometimes fatal, that this inflicts.
Our analysis begins by considering children in care. Such ‘looked after’ children constitute a vulnerable group – most have suffered abuse or neglect – and they tend to experience worse outcomes than other children with regard to a range of outcomes including higher education (Harrison, Reference Harrison2020) and employment (Berlin et al., Reference Berlin, Vinnerljung and Hjern2011). They are also more likely than other children to be criminalised; those in care account for less than 1% of all children but approximately half of all children in custody (Laming, Reference Laming2016). We also estimate the impact of custody on incarcerated children more broadly.
The analysis uses the Longitudinal Education Outcomes (LEO) data, that links individual education records (National Pupil Database, NPD) to post-school outcomes taken from tax, benefit and further/higher education records.Footnote 2 We use this to estimate an econometric model of transitions between education, custody, employment and NEET (Not in Employment, Education or Training), and of earnings for those entering work.
The size of the data is such that males and females can be considered separately. For males who have been looked after, we find that custody reduces employment up to age 21 by more than 10%, which in turn causes earnings to fall. For females who have been looked after, there is no evidence of an impact on employment but, for those in work, custody reduces pay by 25%. For boys as a whole – whether in care or not – the impacts on employment and earnings are similar to those for those in care although there is possibly an even greater risk of disengagement.
Brief details of the youth justice system
10-17 year olds charged with a criminal offence have their cases heard in the youth court; a type of magistrates’ court for young people. Serious crimes are passed to the Crown Court. For less serious crimes, the youth court can pass a custodial sentence (usually a Detention and Training Order of 4-24 months; the first half served in custody, the second in the community). For most (73% in 2018/19), the custodial period is served at a young offender institution (YOI). More vulnerable children (17%) will go to a secure training centre (STC) while the most vulnerable (10%) go to a secure children’s home (SCH). Alternatively, the youth court can give a non-custodial sentence which may involve restorative commitments or other requirements (such as curfew, electronic tagging, voluntary work).
Youth diversion provides an alternative to court processing. Rather than criminal justice processes following arrest, police can offer young people the opportunity of a community-based intervention in return for avoiding formal processing and a criminal record.
Data
The LEO data are drawn from administrative records and cover nearly all school children in England, tracking them after they leave school. Monthly histories were constructed from age 13 (incarceration is rare below this age, see Youth Custody Service, 2021) for young people born between September 1994 and August 1998. Outcomes were tracked until March 2017, by which point the oldest (earliest) cohort was academic age (hereafter, ‘age’) 21 and the youngest was age 18.Footnote 3 Details of spells in care are recorded and, for those looked after for at least a year, whether the child was convicted during the course of the year. Children who enter custody are identified on a month-by-month basis up to the age of 17.Footnote 4
Table 1 presents some descriptive statistics. The first two columns make up the population of children who have been looked after for 12 months or longer and who have been convicted of a crime: of these, column (1) relates to those who received a custodial sentence, column (2) to those who received a non-custodial sentence. For context, columns (3) and (4) present characteristics for all looked after children and all children respectively.
Table 1. Population characteristics
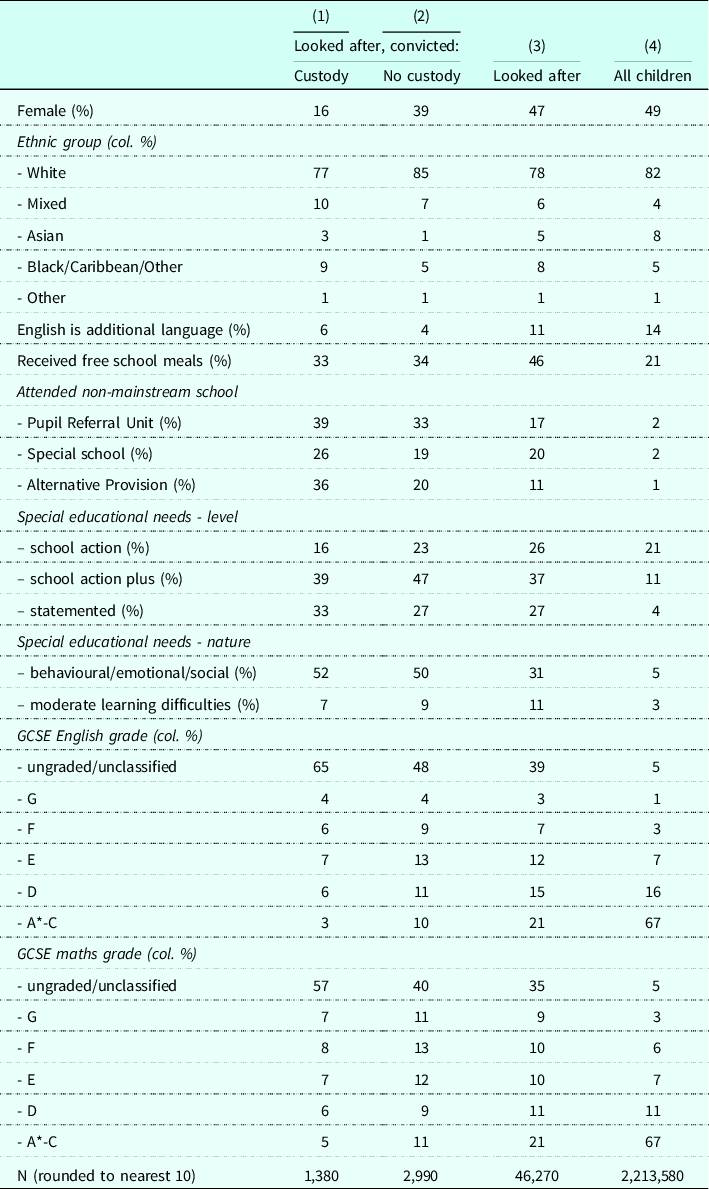
Looked after children form a small subset of all children; roughly two per cent. They are much more likely to be in receipt of free school meals, indicating a low level of household income. They are more likely to have attended a non-mainstream school: special schools (for pupils with special educational needs or a disability), pupil referral units (PRU: alternative provision for pupils who cannot attend mainstream school due to permanent exclusion, emotional or behaviour difficulties, experience of bullying, special educational needs, illness or unavailability of a mainstream school place) or local authority alternative provision (education commissioned by local authorities outside the state-funded school sector).
Higher-level needs are much more common among looked after children than among children as a whole. Schools report the category of SEN:
-
School Action: additional support provided by the school (e.g. use of additional teachers, specialist equipment or different materials)
-
School Action Plus: as above, plus additional support from external services (e.g. a speech and language therapist)
-
Statement: a legal document which sets out a pupil’s educational needs and how they will be addressed.
SEN on the grounds of behavioural, emotional and social difficulties or moderate learning difficulties is more common among looked after children.
Lastly, attainment among looked after children is worse than among the population as a whole. GCSE (General Certificate of Secondary Education) is the qualification level that corresponds to the end of compulsory schooling at age 15. An ungraded or unclassified result – reflecting a level too low to receive a grade, or that the examination was not taken – is rare in the population as a whole but is the most common outcome for looked after children. Similarly, A*-C – generally viewed as a ‘good’ grade – is achieved by two-thirds of children compared to one fifth of looked after children.
Overall, the impression is of looked after children forming a highly selected and disadvantaged group. Those convicted of a crime appear more marginalised still. Compared to looked after children as a whole, columns (1) and (2) show they are more likely to have been outside mainstream education, to have special educational needs on the grounds of behavioural, emotional and social difficulties and to have worse attainment in English and maths.
Columns (1) and (2) constitute the estimation sample for looked after children, with the non-custodial subgroup used as comparison group for the custodial subgroup. Comparing the columns reveals several differences. These can be controlled for in estimation but the concern is that there may also be unobserved differences. Our econometric model controls for unobserved heterogeneity.
We construct a monthly status indicator, allowing for four activities: education, custody, employment and NEET. Table 2 describes the spell structure of the data. Columns (1) and (2) relate to the convicted subgroup of looked after children who received a custodial sentence (column (1) of Table 1), shown separately for males and females. The median male in this group is observed to have 7 spells, compared to 6 for the median female. Males tend to be observed for slightly longer too; a median of 90 months relative to 78 months. The length of observation varies by cohort, with those born in the academic year 1994/95 observed into their 21st year (an average actual age of nearly 22). Hence, the data allow us to follow individuals for some years after school-leaving age.
Table 2. Spell characteristics for convicted looked after children

Spell length by type of spell for the custodial subgroup is shown in Table 3. Across the four states we consider, education and NEET spells are longer than custody and employment spells. This is true for both males and females. Perhaps the most marked difference between males and females is with regard to censoring of custody spells, 13% and 1% respectively.
Table 3. Spell length by type of spell for incarcerated looked after children

Empirical strategy
An overview of the econometric model
This section outlines the econometric model. Full detail is presented in Appendix A of the Supplementary Material.
We estimate an econometric model of transitions between four states: e (education), c (custody), w (employment) and n (NEET). These transitions are modelled as discrete time hazard regressions. An individual in a given state can exit at any point to one of the other states and the hazard regressions allow the probability of such transitions to vary over the duration of the spell (duration dependence). Transitions are influenced by both observed characteristics and unobserved heterogeneity, which is introduced in a flexible way through a discrete approximation (Heckman and Singer, Reference Heckman and Singer1984). For transitions into employment, a hazard function is also used to model earnings, following Donald et al. (Reference Donald, Green and Paarsch2000). As with transitions, the influence of unobserved heterogeneity is allowed for using a discrete approximation.
All transition types and the earnings hazard are estimated jointly. With four states plus earnings, this results in a system of 13 equations (12 transition equations plus 1 earnings equation). These are related since unobserved heterogeneity is specified in a way that allows for cross-equation dependence, thereby providing a means of controlling for selection into successive states. The equations are also related due to the inclusion of variables indicating the nature of the previous state. Among these, the variable of key interest is the lagged custody indicator. Under the standard assumption of proportional hazards, the exogenous regressor variation in our data is sufficient to identify the lagged dependencies (Horny and Picchio, Reference Horny and Picchio2009).
Variables included in the estimation
Each of the 12 transition equations is a hazard regression from an origin state to a destination state. For each origin state there are three potential destination states. Hazard regressions for transitions from the origin state to each of these three destination states are estimated from the month of commencing the origin spell until the month of exiting. The dependent variable in each hazard is a dummy variable that takes the value 0 from the month of commencing the spell. The dependent variable for a particular origin-destination hazard takes the value 1 in the month of exiting the spell to that destination. If the spell ends in a transition to a different destination or does not end at all, the dependent variable is zero throughout the spell.
The earnings equation is estimated at the start of an employment spell. Here, the hazard is the probability of earnings falling within a particular decile of the earnings distribution and the dependent variable is an indicator of the decile of earnings.
The research question relates to the impact of incarceration on subsequent outcomes and consequently the variable of main interest is the indicator of having been in custody. This is defined as follows and included in the transition equations (from origin states other than custody) and the earnings equation:
-
Whether in custody immediately before current spell (1=yes, 0=no).
Other lagged status variables are defined analogously:
-
Whether in employment immediately before current spell (1=yes, 0=no)
-
Whether NEET immediately before current spell (1=yes, 0=no).
Duration dependence is captured using a piecewise constant baseline hazard. The nature of the baseline hazard varies with transition type. Transitions from education, for example, are heavily concentrated at the end of school year 11 (the final year of compulsory schooling, by which time pupils are 15 years of age) so hazards of education exit are specified to be constant but allow for a jump at the end of school year 11. With other transition types, the granularity of the segmentation depends on the frequency of observed transitions at particular durations. For earnings, the baseline hazard is also piecewise constant, with one segment for each decile of the distribution.
Estimation controls also for a range of other characteristics:
-
Age – dummy variables for each age from 13 to 19 indicating whether the individual is that age (1=yes, 0=no)
-
Whether ethnically white (1=yes, 0=no)
-
Whether English is an additional language (1=yes, 0=no).
Gender is not included since results are estimated separately for males and females.
A number of time-varying variables are included:
-
Local authority unemployment rate
-
Seasonal dummies – whether quarter 1 (January-March), quarter 2 (April-June) or quarter 3 (July-September)
-
Monthly dummies – specifically, hazards from education to work or NEET were specified to allow a change in transition rates towards the end of the academic year (June, July, August) and for this to further alter at ages 15 and 17 (standard examination ages). Hazards into education were allowed to peak at the start of the academic year (September)
-
Qualifications – hazards after school leaving age were allowed to vary (relative to the base category of having no qualifications) according to whether the individual had qualifications at level 1 or lower (1=yes, 0=no) or level 2 or higher (1=yes, 0=no).
Other variables included in the regressions indicate whether a characteristic applied previously. These are also time-varying variables, taking the value 0 for those months prior to being ‘switched on’ and 1 thereafter:
-
Previously having SEN status:
-
○ ‘School Action’ (1=yes, 0=no)
-
○ ‘School Action Plus’ (1=yes, 0=no)
-
○ ‘Statemented’ (1=yes, 0=no)
-
-
Previously having SEN type:
-
○ ‘Behavioural, emotional, social difficulties’ (1=yes, 0=no)
-
○ ‘Moderate learning difficulties’ (1=yes, 0=no)
-
-
Previously identified as a child in need (1=yes, 0=no)
-
Previously looked after (1=yes, 0=no)
-
Previously in non-mainstream schooling:
-
○ pupil referral unit (1=yes, 0=no)
-
○ special school (1=yes, 0=no)
-
○ alternative provision (1=yes, 0=no)
-
-
Previously permanently excluded from school (1=yes, 0=no).
As recommended by Gaure et al. (Reference Gaure, Røed and Zhang2007), the number of points of support used to characterise unobserved heterogeneity was chosen to minimise the Akaike Information Criterion. For both males and females, this was with M = 3 points of support.
There are two complications that the specification addresses. First, for females, transitions between custody and employment (in both directions) are too infrequent to model. Such transitions are therefore omitted. Second, custody is only observed as a distinct state up to age 17 in the data. This is consistent with the definition of a child within the youth justice system and so allows the impact of child incarceration – the focus of this paper – to be estimated. However, it does mean that, post-18, the NEET category includes custody while, pre-18, it does not. Practically, we deal with spells of incarceration that are ongoing when turning 18 by right-censoring at 18 and including a new NEET spell from age 18 onwards (which is regarded as having lasted since the start of the custody spell).
Using simulation to summarise results
Simulation was used to show how the estimated coefficients translate into predicted outcomes.
Simulating goodness of fit
To assess model fit, the estimated model was used to simulate transitions between states from age 13 up to age 21. This was done 1,000 times for every child, with each simulation based on a different draw from the distribution of estimated parameters. A confidence interval for the simulated outcomes was calculated using percentiles 2.5 and 97.5 of the simulated distribution.
Simulating impacts
Overall impacts were generated by simulating outcomes 1,000 times under different scenarios. Each replication used a single draw from the joint distribution of estimated coefficients to simulate outcomes from ages 18 to 21 for the population of individuals observed to be in custody at some point. The observed states and characteristics at age 18 were used as initial conditions. Each draw generated a pair of simulated histories; one under the restriction that individuals were in education immediately prior to their initial (age 18) state, the other under the restriction that they were in custody immediately before. These restrictions were imposed by appropriately setting the initial conditions of the variables indicating status in the preceding spell. To achieve a simulated impact of prior custody relative to education on, for example, employment, the proportion simulated to be in employment under the first restriction can be subtracted from the corresponding proportion under the second restriction. Impact was calculated as the mean difference across replications, with confidence intervals calculated using percentiles 2.5 and 97.5 of the simulated distribution.
Results
Looked after children
Full estimation results are provided in Appendix B of the Supplementary Material. In this section, the key findings are highlighted and discussed. We consider males and females separately. There are two reasons for this. First, there are likely to be important gender differences in the influence on labour market transitions. Second, a pooled analysis would be dominated by males due to the fact that they account for the majority of incarcerated children.
Goodness of fit
Figure 1 provides a visualisation of model fit, as captured by how well the estimation results can replicate observed trends in the data. In each of the charts, the lines depict the observed proportions in each state from age 13 up to age 21. The shaded areas are the confidence intervals of the simulated outcomes. The proportions in each state fall within the simulated confidence interval in most cases indicating that the estimated model successfully allowed the main features of the observed trends to be reproduced. This is true even where there are rapid changes, such as reaching the end of compulsory schooling (towards the end of academic age 15) when there is a substantial movement from education to NEET. Overall, there is good model fit.
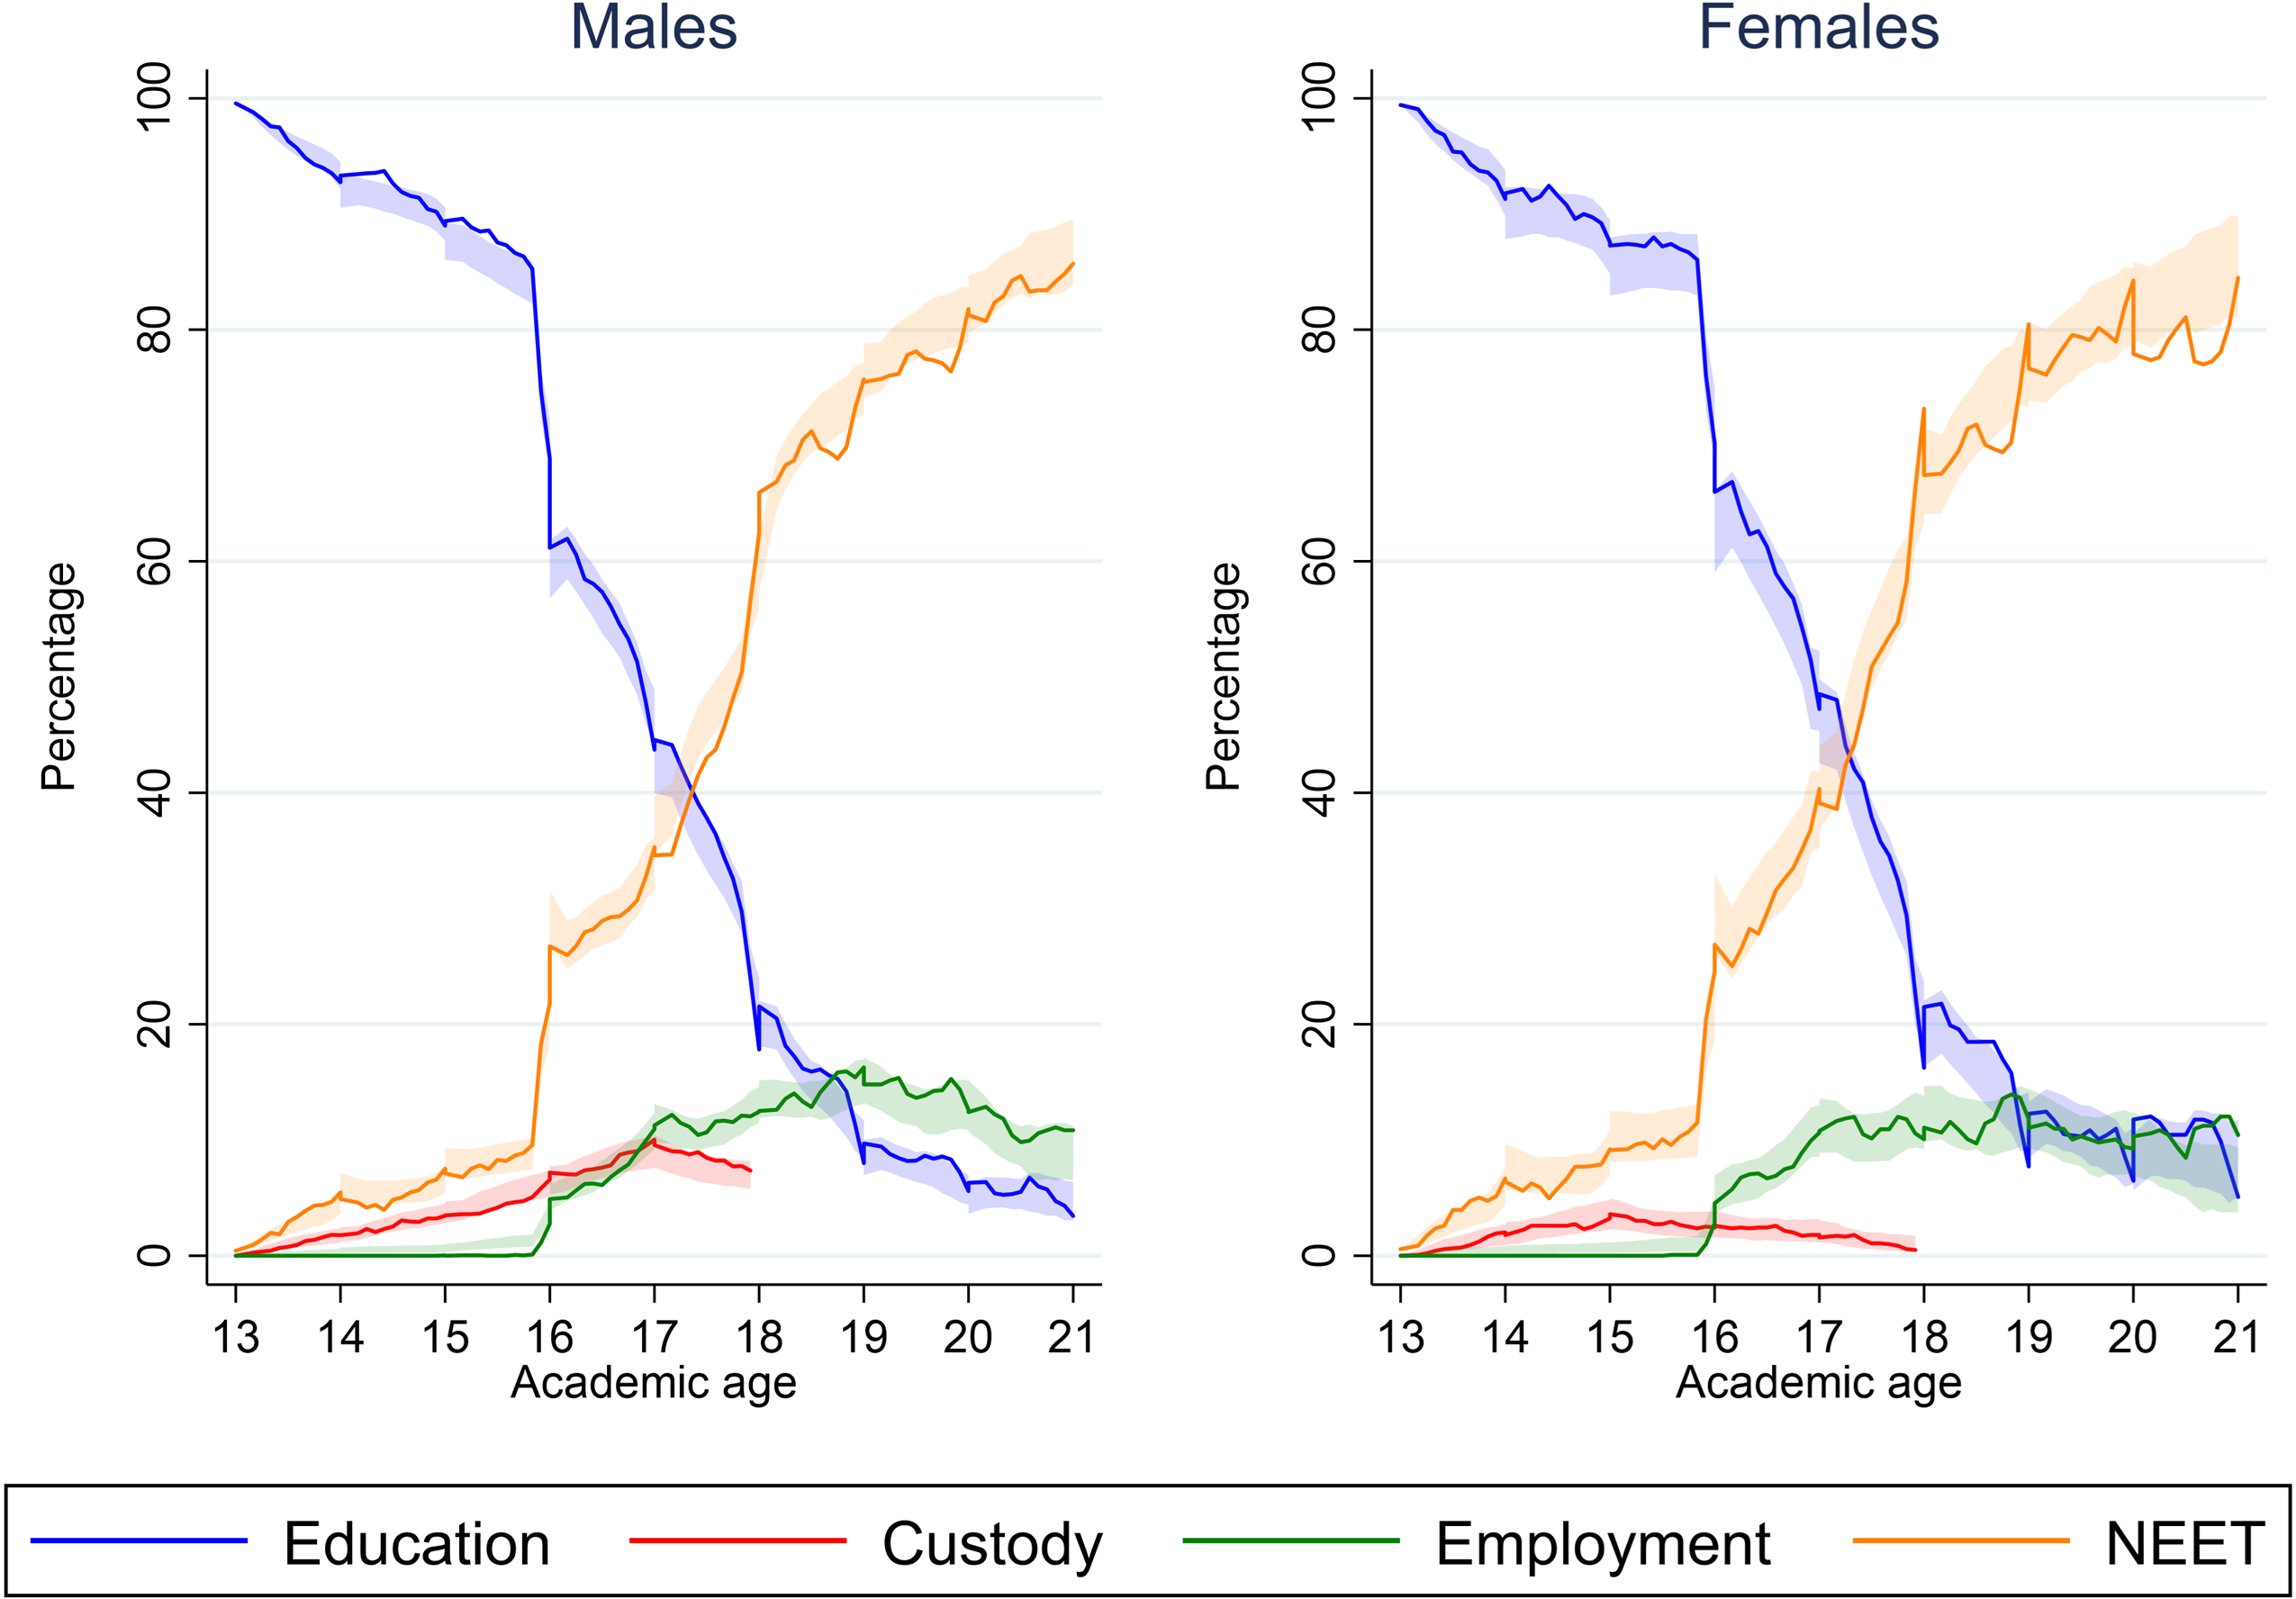
Figure 1. Observed and modelled levels of education, custody employment and NEET for convicted looked after children.
Notes: The lines in these charts depict the rates of Education, Custody, Employment and NEET from age 13 up to age 21 observed in the data. The shaded areas represent percentiles 2.5 and 97.5 of the simulated distribution of states using the results of the estimated model. Simulation involved 1,000 replications and the shaded areas correspond to percentiles 2.5 and 97.5 of the simulated distributions.
Estimation results
The key coefficient relates to the indicator of whether the individual was in custody immediately prior to the current spell. The top panel of Table 4 presents this coefficient for each equation for children in care. For males, prior custody increases transitions from any state back into custody. It reduces transitions into education, increases transitions from education into NEET and reduces transitions from NEET into work. Broadly, prior custody appears to increase flows towards either further custody or NEET. There is some suggestion of a negative impact on earnings (a positive coefficient implies ‘failing’ in the lower reaches of the earnings distribution), although this falls short of the conventional level of statistical significance.
Table 4. Key coefficient: the impact of preceding spell being custody

For females, the results suggest instead that custody begets further custody but there is no suggestion that, for those who avoid further custody, there is a channelling towards NEET, nor a reduction in moves from NEET to employment. As with males, there is a negative impact on wages (a positive impact on the earnings hazard); this time though it is significant at the conventional level.
The estimated coefficients are informative of the sign and statistical significance of the effects of prior custody. Simulation can show how they combine to influence outcomes. Figure 2 summarises the main results for males (first column) and females (second column). Each row relates to a different outcome: education (row 1), employment (row 2), NEET (row 3) and earnings for those in employment (row 4). Graphs show estimated impacts between 18 and 21 as lines, with shaded areas depicting confidence intervals.

Figure 2. The impacts of having been in custody immediately before current spell for looked after children.
Notes: These charts show the simulated impacts (1,000 replications) of being in custody rather than education immediately prior to the spell underway on turning 18. Impacts on Education/training, Employment, NEET and earnings (respective row order) are presented for males (left column) and females (right column). The lines in the charts show mean impacts estimated across all replications. The shaded areas show percentiles 2.5 and 97.5 of the simulated distribution.
Figure 2 suggests the effect of prior custody is very different for males and females. For males, prior custody reduces education and employment, and so correspondingly increases NEET. These impacts are often significant, as indicated by the confidence intervals excluding zero. This significance is most evident up to age 20 in the case of education and employment but is sustained in the case of NEET. The bottom graph shows the impact on earnings for those simulated to be in work. Here the impact is not significant and quite quickly gravitates towards zero.
For females, the simulations suggest no significant impact of prior custody on education, employment or NEET. Not only do the confidence intervals span zero, but the impact estimates are also close to zero throughout the 18-21 age range. For those in work, the impact on earnings resembles that seen for males. While the confidence intervals include zero, they do not span zero. In fact, the distribution of earnings impacts is heaped at zero, and less than 1% of the distribution of simulated impacts exceeds zero. Hence, while the results cannot reject the null hypothesis of zero earnings impact of prior custody among those in work, they would reject the null hypothesis of a positive effect. In other words, the estimated impacts are non-positive. In fact, for females entering work, prior custody reduces earnings by 25%, significant at the 95% significance level.
Moving beyond visualisation, Table 5 quantifies the simulation results, showing impacts on number of months spent in each state or, for earnings, the total amount earned, at ages 18, 19, 20 and 21. It also shows the baseline number of months worked (or total earned) each year. This allows a qualitative assessment of how meaningful the estimated impacts are.
Table 5. Estimates of annual impacts for looked after children

Notes: For education, employment and NEET, the mean simulated baseline (no prior custody) number of months in that state during the specified age is shown along with the impact of prior custody and the confidence interval around this estimate (percentiles 2.5 and 97.5 of the simulated impact distribution). Unlike Figure 2 , earnings are not conditional on someone with prior custody being employed, so the earnings impact reflects both the employment impact and the impact on amount paid for those in work. 1,000 replications.
For males, annual impacts on education, employment and NEET are statistically significant at all ages. Focusing on employment, prior custody reduces months worked while 18 by 0.157 months. This is from a baseline of 1.239 months worked in that year on average, a reduction of approximately 13%. The reduction peaked at age 19 (14%) before falling slightly to 10% at age 21. Overall, this points to a sustained employment penalty arising from custody. The impact on NEET is smaller in percentage terms due to the larger proportion of the population that is neither studying nor in work. Prior custody increases the number of months spent NEET by 5% at age 18, falling to 2% at age 21. Lastly, earnings are significantly reduced by prior custody. Unlike Figure 2, earnings here are not conditional on employment. Instead, earnings are set to zero for those not working so the impact in Table 5 reflects both the employment impact and the impact on amount paid for those in work. Prior custody is estimated to reduce earnings at age 18 by 16%. This falls to 10% at age 21, by which point the impact is no longer statistically significant. For females, by contrast, none of the results is statistically significant, consistent with the impression from Figure 2.
All children
For this broader group, interaction with the criminal justice system is not recorded in the data. We cannot therefore follow the same approach as with children in care since there is no way to identify a comparison group of children with a conviction that did not lead to a custodial sentence. This raises a concern around whether estimates that are not based on the convicted sub-sample can adequately control for selection bias. To explore this, we begin by examining whether it is possible to replicate the results for children in care without using the convicted variable.
Replicating the results for children in care without the convicted variable
The replication approach involves two steps. First, propensity score matching is used to identify a group of looked after children who did not experience custody but who look similar to the group of looked after children who did experience custody. This is with the aim of identifying a comparison group that, without using the convicted variable, looks similar to the custody group. Footnote 5 Second, the econometric model is re-estimated on the subset of looked after children who experienced custody plus the matched comparison group identified in the first step.
Table 6 shows the simulated annual impacts resulting from this estimation. This was only possible for boys. For girls, it was not able to identify a matched comparison group with similar characteristics to those of girls in care who experienced incarceration. Footnote 6 Hence, when looking beyond the population in care, the analysis is limited to boys.
Table 6. Estimates of annual impacts for male convicted children in care using matched comparators

Notes: See Table 5.
A comparison of Table 6 to Table 5 shows a degree of similarity. The estimated impacts on education and NEET are particularly close. The estimated impacts on employment are also similar to those using the convicted variable although they are less precisely estimated and hence appear less statistically significant. This is also the case with the estimated impacts on earnings.
Overall, it appears that the replication approach described above can provide broadly similar estimates to those that use the convicted variable, although there is reduced precision. This provides some reassurance that it is possible to estimate impacts for boys as a whole.
Estimation results
The key coefficients from estimating the model for boys as a whole are presented in the bottom panel of Table 4 (for full results, see Table B3 in the Supplementary Material). The impacts of a prior custody spell on transitions from education are similar (in respect of sign and significance) to those for looked after boys (top panel of Table 4). The impact on transitions from employment to either education or custody also look similar but, unlike for boys in care, prior custody significantly increases the probability of a transition from employment to NEET. The impacts on transitions from NEET to education or custody are again similar to those for looked after boys but, whereas prior custody reduced transitions from NEET to employment for those in care, for boys as a whole there was no such impact. Lastly, there was no impact on earnings for boys as a whole.
Table 7 presents impacts (in the same way as Table 5). As with looked after boys, there is a sustained negative impact on education. However, the impacts are somewhat larger. For example, a reduction of 0.87 months at age 18 compared to 0.33 months for boys in care. The employment impacts are very similar. Relative to the baseline, prior custody reduces the number of months in employment at ages 18, 19, 20 and 21 by 10, 15, 11 and 7%, respectively. For NEET, however, the impact of prior custody for boys is roughly double that for looked after boys. Lastly, the impacts on earnings are comparable to those for boys in care. Reflecting the lack of a significant earnings impact for those in work (Table 4), the overall impacts on boys’ earnings expressed relative to their baseline are very similar to the percentage point impacts on employment.

Conclusion
This paper reports estimates of the early labour market impacts of incarcerating a child. For looked after children, we find impacts that differ by gender. Among males, the main impact of custody was to reduce employment by more than 10%. For females, there was no employment effect but custody reduced pay among those in work by 25%. Estimates for boys as a whole were broadly similar to those for boys in care, although the impact on the probability of being NEET was greater.
This is the first study we are aware of that has produced separate impact estimates for males and females. Since they account for only a small proportion of incarcerated children, girls have sometimes not featured prominently in policy discussions (Genders and Player, Reference Genders and Player1986). Nevertheless, their experience of incarceration and the challenges they face on leaving the secure estate are sufficiently distinct from boys’ that it is of clear interest to consider them separately.
The finding of a negative causal effect of custody suggests a number of policy implications. Relevant policy can be family-oriented, childhood-oriented or child-oriented (Daly, Reference Daly2020). The focus in this paper on the transition into work means that policy oriented towards young adults is also important. The remainder of this paper considers how policy may improve children’s life chances at four specific points and again in young adulthood.
First, there is the imperative to deter delinquent behaviour in the first place. The strong association between disadvantage and offending suggests that part of the answer lies in tackling children’s deep-rooted and complex needs (Jacobson et al., Reference Jacobson, Bhardwa, Gyateng, Hunter and Hough2010). Children in care are heavily over-represented among those incarcerated so understanding the nature of the pathway from care to custody is important for identifying appropriate policy responses. The Taylor Review, for instance, noted that minor incidents that would otherwise be dealt with by parents are more likely to be brought to the attention of the police when the child involved is instead in a care home (Taylor, Reference Taylor2016). Identifying a suitable way of replicating the parental role could help avoid unnecessary police involvement.
Second, a natural aim is to reduce the extent to which offenders are sentenced to custody. Evidence suggests most children will naturally age out of offending (Mulvey, Reference Mulvey2011). Formal involvement with the criminal justice system can inhibit this tendency and reduce the likelihood of positive adult outcomes (Lambie and Randell, Reference Lambie and Randell2013; Petrosino et al., Reference Petrosino, Turpin-Petrosino and Guckenburg2010). One way to keep children out of the courts is to increase the age of criminal responsibility. Goldson (Reference Goldson2013) suggests that an argument for doing so would be compliance with international human rights standards and points out that the age of criminal responsibility is the lowest of any European Union state. Bateman (Reference Bateman2012) identifies a trend in other countries to increase the age of criminal responsibility. The 1998 abolition for children aged 10-13 of doli incapax – the requirement for the prosecution to convince that the child both committed a crime and was aware at the time of its seriousness – moved England and Wales in the opposite direction, bringing to bear the full weight of criminal responsibility from age 10.
Increased use of diversion of young offenders away from the courts has caused the number of under-18s in custody to decline steadily since 2008. A consequence of this is that those incarcerated increasingly constitute a ‘hard core’ with complex needs. The proportion incarcerated for violence against the person has increased from 21 per cent in 2012 to 61 per cent in 2021 (Youth Justice Board, 2022). While diversion is appealing as a means of avoiding the negative effects of incarceration, it cannot work in all cases and has to be balanced against the need to protect the public from the risk of serious harm. For those at risk of becoming involved in violent crime, other interventions are relevant. A recent example includes taskforces (comprising mental health professionals, family workers, and speech and language therapists) to encourage re-engagement with education among young people at risk of truancy and exclusion and, for those who are excluded, to encourage education or an otherwise positive transition into the labour market.
The third point at which there is a role for policy is when the child is incarcerated. The Taylor Review promoted the need for a ‘child first, offender second’ principle. This was not explicitly recognised in the government’s response (Hart, Reference Hart2017) but was later adopted by the Youth Justice Board. The relevance of this is in formalising the aim of providing tailored support to achieve pro-social self-identity and encourage education and active participation while deterring criminality (Youth Justice Board, 2019). Tailoring of support is likely to be important (Fox et al., Reference Fox, Fox and Marsh2013) but must reflect a diverse range of needs. For example, girls who experience incarceration are a highly vulnerable group, with a set of challenges requiring gender-specific support that also reflects their often high levels of prior trauma (Khan et al., Reference Khan, Harris and Sinclair2022).
There has long been a view that the secure estate for children is not fit for purpose (Wood et al., Reference Wood, Bailey and Butler2017). Secure Children’s Homes have been held up as a model of effective secure accommodation (Bateman, Reference Bateman2016). However, with the cost of a place nearly three times that of a place in a Young Offender Institution (the most common accommodation), achieving this standard more generally would require a substantial financial commitment. The Youth Custody Improvement Board suggested the whole of the current education and training offer should be reviewed and re-provided (Wood et al., Reference Wood, Bailey and Butler2017). The introduction of Secure Schools provides an opportunity to trial a new offer. However, progress has been slow; the planned opening for 2020 was pushed back to 2023. Furthermore, only two such schools are currently planned. Nevertheless a tailored and well-resourced education offer remains an opportunity that could minimise the disruption to learning, engage and develop young minds, improve prospects on release and thereby pay for itself in whole or in part.
The fourth point where policy can help is in the transition from incarceration. In written evidence to the House of Commons Justice Select Committee, the government’s Chief Inspector of Prisons reported significant gaps in meeting children’s needs both before and after release and a lack of coordination between agencies delivering support.Footnote 7 The Committee identified the need for effective joint working and singled out accommodation as a particularly important focus. Resettlement support has in the past been criticised for not acknowledging the difficulties arising from poverty and socio-economic disadvantage, instead attributing the challenges young people face on release from incarceration as reflecting perceived personal deficits (Gray, Reference Gray2011).
As a young adult, other policies become relevant. One interpretation of the gender-differences in employment impacts is that employer discrimination is more of an obstacle for young men than for young women. This might reflect differences in the nature of the offences perpetrated by young men. Denver et al. (Reference Denver, Pickett and Bushway2017) provide evidence that the public views individuals with violent convictions – who are disproportionately male – as being the most likely to re-offend and is more supportive of excluding such individuals from employment.
The existence of discrimination raises issues for policy around disclosure of criminal records. However, measures to address this need to be carefully designed if they are to avoid having unintended adverse consequences. Assessments of U.S. policies that prevent employers from asking about criminal records have found that they are harmful to young, low-skilled black men (Doleac and Hansen, Reference Doleac and Hansen2020) and can thereby exacerbate the racial gap in employment opportunities (Agan and Starr, Reference Agan and Starr2018). This finding can be explained by employers using available information to predict who might have a criminal record and, in so doing, relying on race-based assumptions. More broadly, such policies can have the effect of entrenching disadvantage among any demographic groups that are over-represented among offenders.
Incarceration may cause young men to disengage from the formal labour market to a greater degree than young women. The negative estimated impact on employment could then reflect either a greater tendency not to work at all or to work informally (only formal employment is recorded in the available data). The challenge for policy is then to stem disengagement. Resettlement support could usefully extend beyond the immediate transition from custody to instead form the basis for a relationship with the young person, offering a means by which engagement can be encouraged on an ongoing basis. This may be particularly relevant for those not in care where there may otherwise be no formal agency support (and for whom the results suggest custody has a stronger effect on disengagement).
An ongoing support relationship of this type is equally important for males and females. However, the focus of the support is likely to differ. For males, one element of the challenge to retain engagement is to help overcome employer discrimination. This may involve job-brokering, something that can begin while still in custody, along the lines of the New Futures Network available for adult prisoners (Ministry of Justice, 2018), but could continue post-release. Directing individuals to jobs in the intermediate labour market (working in charity shops, for example) may be an important stepping-stone.
For females, the results suggests that, rather than discrimination and disengagement, the wage penalty of custody is a key issue, bringing with it the risk of in-work poverty. A tailored policy response would require understanding the reasons behind this. Appropriate support might involve signposting to appropriate training, helping with confidence to apply for better-paid jobs or advising on how to negotiate pay rises. Young women may also face specific challenges such as managing childcare.
Supplementary material
To view supplementary material for this article, please visit https://doi.org/10.1017/S0047279423000235
Acknowledgements
The authors thank the editor and two anonymous referees for helpful comments and the Department for Education for providing access to the data. An earlier version of this paper was presented at the Royal Economic Society conference. The project has been funded by the Nuffield Foundation, but the views expressed are those of the authors and not necessarily the Foundation. Visit www.nuffieldfoundation.org. The usual disclaimer applies.
Competing interests
The authors declare none.


 Open access