


Introduction
Breakthroughs have been made on our understanding of the genetic basis of psychosis, with 287 genomic loci for schizophrenia and 64 loci for bipolar disorder discovered (Mullins et al., Reference Mullins, Forstner, O'Connell, Coombes, Coleman, Qiao and Andreassen2021; Trubetskoy et al., Reference Trubetskoy, Pardiñas, Qi, Panagiotaropoulou, Awasthi, Bigdeli and van Os2022), as well as rare variants affecting 10 genes associated with schizophrenia (Singh et al., Reference Singh, Poterba, Curtis, Akil, al Eissa, Barchas and Daly2022). Nevertheless, more research is still needed to explain how such genetic risk is conferred on the clinical phenotypes of psychosis. One possible approach is the use of endophenotypes for psychosis, which are intermediate phenotypes that bridge the gap between the genetic variants and clinical phenotypes of psychosis (Gottesman & Gould, Reference Gottesman and Gould2003; Gottesman & Shields, Reference Gottesman and Shields1973; Gould & Gottesman, Reference Gould and Gottesman2006). Although the concept was initially proposed to aid gene discovery, the goal of endophenotype research now has shifted to understanding the neurobiological mechanisms linked to the genetics and phenotypes of psychosis (Hall & Smoller, Reference Hall and Smoller2010). Endophenotype deficits observed in both patients and their unaffected relatives could serve as biomarkers of genetic predisposition toward the disease and provide mechanistic insights (Gottesman & Gould, Reference Gottesman and Gould2003; Gottesman & Shields, Reference Gottesman and Shields1973; Gould & Gottesman, Reference Gould and Gottesman2006).
Event-related potentials (ERPs) are changes in the electroencephalogram (EEG) triggered by stimuli such as perception or cognitive tasks and constitute promising endophenotypes for psychosis. This technology is ubiquitous, non-invasive, and due to its millisecond temporal resolution, allows the real-time investigation of perception and cognition. Since deficits in auditory processing (e.g. auditory hallucinations) are core features of psychosis (Waters et al., Reference Waters, Allen, Aleman, Fernyhough, Woodward, Badcock and Laroi2012), research on auditory ERPs is important to unravel their underlying mechanisms. A few auditory ERPs, such as the mismatch negativity and the P300 (Blakey et al., Reference Blakey, Ranlund, Zartaloudi, Cahn, Calafato, Colizzi and Bramon2018; Bramon et al., Reference Bramon, McDonald, Croft, Landau, Filbey, Gruzelier and Murray2005; Earls, Curran, & Mittal, Reference Earls, Curran and Mittal2016; Erickson et al., Reference Erickson, Ruffle, Gold, Earls, Curran, Mittal and Gold2016), are considered endophenotypes for psychosis as they are impaired in both patients with psychosis and their relatives. However, compared to other ERPs, the N100 waveform has been relatively less researched as a potential endophenotype for psychosis. The N100 is a change in EEG that occurs very consistently at about 100 ms following any kind of auditory stimulus and is related to the processing of auditory information at an early stage.
The N100 is mainly generated from the primary and association auditory cortices (Liasis, Towell, Alho, & Boyd, Reference Liasis, Towell, Alho and Boyd2001; Näätänen, Reference Näätänen1992; Näätänen & Picton, Reference Näätänen and Picton1987), and was found to be altered in patients with psychosis. It is commonly measured by three paradigms: the passive listening paradigm (where a series of identical stimuli are presented), the auditory oddball paradigm (where a few target stimuli are randomly embedded in a series of standard stimuli), and the paired-click paradigm (where pairs of two consecutive stimuli are presented). A review by Rosburg, Boutros, and Ford (Reference Rosburg, Boutros and Ford2008) concluded that patients had reduced N100 amplitudes compared to controls, but such deficits were more robust in studies that employed longer interstimulus intervals (>1 s) (Rosburg et al., Reference Rosburg, Boutros and Ford2008). When focusing on the paired click paradigm, Rosburg (Reference Rosburg2018) found that patients with psychosis had reduced N100 amplitudes to the first stimulus (S1), but no significant differences between patients and controls were found for N100 amplitudes to the second stimulus (S2) (Rosburg, Reference Rosburg2018). This important observation challenged the view that patients had N100 sensory gating impairment measured by the S2/S1 ratio, but is in line with findings from the passive listening and auditory oddball paradigms. By contrast, relatively few studies examined the N100 latency, an EEG correlate of reaction time, with some reporting N100 delays in patients compared to controls (Adler & Gattaz, Reference Adler and Gattaz1993; Adler, Adler, Schneck, & Armbruster, Reference Adler, Adler, Schneck and Armbruster1990; Ahveninen et al., Reference Ahveninen, Jaaskelainen, Osipova, Huttunen, Ilmoniemi, Kaprio and Cannon2006; Frangou et al., Reference Frangou, Sharma, Alarcon, Sigmudsson, Takei, Binnie and Murray1997; Iyer, Boutros, & Zouridakis, Reference Iyer, Boutros and Zouridakis2012).
The N100 is heritable, making it a potential endophenotype indicative of genetic risk for psychosis. Twin studies showed a heritability of 60–70% for the N100 amplitude (Ahveninen et al., Reference Ahveninen, Jaaskelainen, Osipova, Huttunen, Ilmoniemi, Kaprio and Cannon2006; O'Connor, Morzorati, Christian, & Li, Reference O'Connor, Morzorati, Christian and Li1994) and 56% for the N100 latency (O'Connor et al., Reference O'Connor, Morzorati, Christian and Li1994) in the auditory oddball paradigm at the Cz electrode, while the heritability of the N100 amplitude to S1 in the paired click paradigm was estimated to be 73% at Cz (Anokhin, Vedeniapin, Heath, Korzyukov, & Boutros, Reference Anokhin, Vedeniapin, Heath, Korzyukov and Boutros2007). However, whether the N100 is impaired in the relatives of patients with psychosis remains unclear. While some studies reported a reduction in the N100 amplitude and a prolongation in the N100 latency in the relatives of patients (Ahveninen et al., Reference Ahveninen, Jaaskelainen, Osipova, Huttunen, Ilmoniemi, Kaprio and Cannon2006; Ethridge et al., Reference Ethridge, Hamm, Pearlson, Tamminga, Sweeney, Keshavan and Clementz2015; Force, Venables, & Sponheim, Reference Force, Venables and Sponheim2008; Foxe et al., Reference Foxe, Yeap, Snyder, Kelly, Thakore, Molholm and J.H.2011; Frangou et al., Reference Frangou, Sharma, Alarcon, Sigmudsson, Takei, Binnie and Murray1997; Lebedeva & Orlova, Reference Lebedeva and Orlova2001; Pokorny & Sponheim, Reference Pokorny and Sponheim2022; Simons et al., Reference Simons, Sambeth, Krabbendam, Pfeifer, van Os, Riedel and van O2011; Turetsky et al., Reference Turetsky, Greenwood, Olincy, Radant, Braff, Cadenhead and Calkins2008), others did not find such differences (Blackwood, Clair, Muir, & Duffy, Reference Blackwood, Clair, Muir and Duffy1991; Ford et al., Reference Ford, Mathalon, Roach, Keedy, Reilly, Gershon and Sweeney2013; Karoumi et al., Reference Karoumi, Laurent, Rosenfeld, Rochet, Brunon, Dalery and Saoud2000; Leicht et al., Reference Leicht, Karch, Karamatskos, Giegling, Möller, Hegerl and Christoph2011; Pokorny & Sponheim, Reference Pokorny and Sponheim2022; Simons et al., Reference Simons, Sambeth, Krabbendam, Pfeifer, van Os, Riedel and van O2011; Sumich et al., Reference Sumich, Kumari, Dodd, Ettinger, Hughes, Zachariah and E.2008; Waldo, Adler, & Freedman, Reference Waldo, Adler and Freedman1988; Winterer et al., Reference Winterer, Egan, Rädler, Coppola and Weinberger2001), and there have been no systematic reviews or meta-analyses summarizing the literature so far.
Therefore, the current study aims to examine whether the N100 meets the criteria to be an endophenotype for psychosis by comparing the N100 in patients with psychosis and their relatives with controls. To achieve this, we first analyzed EEG data from a family study conducted by our team and performed a systematic review and meta-analysis to combine our results with all available N100 literature.
Methods and materials
Family study: participants
Our family study is an international collaboration among three research institutes at two research sites: University College London (London, UK), King's College London (London, UK), and McLean Hospital at Harvard Medical School (Belmont, MA, USA). The study was approved by local ethics committees at both research sites and all participants provided written consent before assessments. Both research sites recruited patients with psychosis and controls, while the London site also recruited the unaffected relatives of patients. Patients and their relatives were recruited by clinical teams at mental health services in London and Belmont, while controls were recruited in local communities via advertisements. Psychotic disorders were diagnosed based on the Diagnostic and Statistical Manual of Mental Disorders, fourth edition (DSM-IV) (American Psychiatric Association, 1994), and validated by structured clinical interviews (Andreasen, Flaum, & Arndt, Reference Andreasen, Flaum and Arndt1992; Endicott & Spitzer, Reference Endicott and Spitzer1978; Kay, Fiszbein, & Opler, Reference Kay, Fiszbein and Opler1987; Spitzer, Williams, Gibbon, & First, Reference Spitzer, Williams, Gibbon and First1992; Williams et al., Reference Williams, Gibbon, First, Spitzer, Davies, Borus and Wittchen1992; Wing et al., Reference Wing, Babor, Brugha, Burke, Cooper, Giel and Sartorius1990). Controls in the study did not have any personal or family histories of psychosis. Unaffected relatives recruited in London were the first-degree relatives of the patients without personal histories of psychosis. Details of recruitment can be found in online Supplementary Material.
Family study: EEG recording and processing
Participants' EEG was recorded using the auditory oddball paradigm with similar parameters at both research sites. Stimuli in the paradigm were 400 binaural 80 dB tones, including 20% (London) or 15% (Belmont) target tones of 1500 Hz randomly embedded in the standard tones of 1000 Hz. The interstimulus interval was 1.8–2.2 s. Participants were instructed to press a button when they detected a target tone. EEG data were referenced to the left earlobe or an average of mastoids and bandpass filtered between 0.1 and 30 (London) or 20 (Belmont) Hz. Eye blinks and other artifacts were removed using independent component analysis (Delorme & Makeig, Reference Delorme and Makeig2004; Pion-Tonachini, Kreutz-Delgado, & Makeig, Reference Pion-Tonachini, Kreutz-Delgado and Makeig2019) in London and by a regression-based method (Gratton, Coles, & Donchin, Reference Gratton, Coles and Donchin1983) in Belmont. After baseline correction, N100 amplitudes, and latencies to the standard stimuli were measured at the Cz electrode at both research sites. N100 amplitudes were measured as the most negative peak amplitude in a window from 50 to 200 ms post-stimulus. N100 latencies were measured as the interval between the N100 peak and stimulus onset. Details of EEG recording and processing can be found in online Supplementary Material.
Family study: group comparisons
We compared the N100 amplitude and latency across three clinical groups using linear regression models. N100 amplitude or latency was included as the outcome variable in the model, and clinical group (patients/relatives/controls) was included as the main explanatory variable. Controls were set as the reference group in the model. We also added age, sex, and research site as covariates in the model, since they could be potential confounders for group differences in the N100. To minimize heterogeneity caused by experimental differences between the two sites, N100 amplitudes and latencies were standardized across groups within each site before the analysis.
Meta-analysis: literature search
As the power to detect N100 differences across groups in our family study was limited by its modest sample size, we conducted a meta-analysis to combine the results of our family study and any suitable previously published family studies. Before conducting the literature search and meta-analysis, we registered the protocol of the meta-analysis on PROSPERO (https://www.crd.york.ac.uk/PROSPERO/display_record.php?RecordID=163195).
We searched PsycINFO (Ovid interface, 1806 onward, multi-purpose search), Embase (Ovid interface, 1974 onward, multi-purpose search), and PubMed (text-word search), using the following search terms: (psychosis OR psychoses OR psychotic OR schizophreni* OR bipolar) AND (N1 OR N100) AND (relative* OR famil*). Searches were restricted to English language and human studies. The last search was conducted on January 11, 2023.
Meta-analysis: inclusion and exclusion criteria
Eligible studies should focus on participants aged 18 or above with no neurological disorders, intellectual disability, or hearing loss. Studies must be family studies involving the relatives of patients with psychosis. Patients must be diagnosed with schizophrenia, schizoaffective disorder, schizophreniform disorder, delusional disorder, psychotic disorder not otherwise specified, or bipolar disorder. As there were limited studies in this field, although we initially planned to include only unaffected relatives, studies with affected relatives were still included if the majority of the relatives were unaffected, and we excluded those studies in further sensitivity analyses. Controls should have no personal or family histories of psychosis. As we were interested in the N100 deficits related to auditory processing, studies using non-auditory paradigms were excluded.
Meta-analysis: data collection and extraction
Initial search results were exported to EndNote X9 (https://endnote.com/) for deduplication and uploaded to Rayyan (https://rayyan.qcri.org/) for screening. Three researchers (B.W., H.A., and L.V.) screened all titles and abstracts independently, and all papers were double-screened. We then downloaded the full-text articles for the studies and assessed them for final inclusion. We also checked the references of the full-text articles for additional eligible studies. Discrepancies were resolved by discussion between the three researchers, and a fourth senior researcher (E.B.) was consulted when required.
For each eligible study, we extracted the following information: (1) author(s) and year of publication; (2) sample size and characteristics; (3) paradigm (e.g. oddball, paired click, or talk-listen), electrode(s), and N100 measure (e.g. amplitude or latency); (4) means and s.d.s of N100 amplitudes and/or latencies in patients, relatives, and controls; (5) standardized mean differences (s.m.d.s) between groups when (4) was not available. Missing data were requested by emailing the authors of eligible studies.
Meta-analysis: statistical analysis
We pooled the s.m.d.s of our family study and all eligible previous studies in a meta-analysis using the metafor package in R 4.0.2 (R Core Team, 2020; Viechtbauer, Reference Viechtbauer2010). When no s.m.d.s were provided by a primary study, we calculated s.m.d.s using Cohen's d (Cohen, Reference Cohen1988) based on the mean and s.d. of each group, or from the s.d. of the outcome variable and the unstandardized regression coefficient in regression models. We used random-effects models to calculate the pooled effect sizes using the DerSimonian–Laird method (DerSimonian & Laird, Reference DerSimonian and Laird1986) and assessed heterogeneity by the I 2 statistics (Higgins & Thompson, Reference Higgins and Thompson2002; Higgins, Thompson, Deeks, & Altman, Reference Higgins, Thompson, Deeks and Altman2003).
The primary meta-analysis compared the N100 amplitude and latency between patients and controls as well as between relatives and controls. We also conducted sensitivity analyses excluding samples with affected relatives and broad clinical status (i.e. participants with other neuropsychiatric conditions, such as minor brain injuries and low IQ). Since all but two studies used the auditory oddball paradigm and its variants, we performed subgroup analyses including only those studies and excluding two studies using the paired-click paradigm.
Meta-analysis: assessment of study quality and publication bias
All studies included in the qualitative synthesis were assessed by the Newcastle–Ottawa scale (Wells et al., Reference Wells, Shea, O'Connell, Peterson, Welch, Losos and Tugwell2000). The scale has a maximum score of nine stars indicative of optimal case–control designs and appraises four domains: selection of participants (four stars), comparability across groups (two stars), and ascertainment of outcome/exposure (three stars). We also assessed publication bias in the literature by funnel plots (Light, Richard, Light, & Pillemer, Reference Light, Richard, Light and Pillemer1984).
Results
Family study: sample overview
A total of 523 participants in our family study were analyzed, including 220 from London and 303 from Belmont. In total, 243 patients, 86 relatives, and 194 controls were included in the analysis. Descriptive statistics of age, sex, N100 amplitude, and N100 latency by clinical group in the two samples are shown in Table 1.
Table 1. Sample characteristics by clinical group and research site

Family study: group comparisons
For the N100 amplitude, linear regression revealed that patients had significantly reduced N100 amplitudes compared to controls (s.m.d.: −0.21, 95% CI: −0.40 to −0.02, p = 0.027), but no significant differences were found between relatives and controls for N100 amplitude (s.m.d.: −0.06, 95% CI: −0.35 to 0.22, p = 0.664). Similarly, we found that patients had significantly prolonged N100 latencies (s.m.d.: 0.22, 95% CI: 0.03–0.41, p = 0.025), but no significant differences were found between relatives and controls for the N100 latency (s.m.d.: 0.10, 95% CI: −0.18 to 0.39, p = 0.476). We also tested the interactions between group × age, sex × age, and sex × age, but those interactions were generally not significant.
Meta-analysis: study selection
A total of 415 studies were identified from our literature search, with three additional studies identified through other resources (two by reference checking and our family study). A total of 334 studies were left after deduplication. After screening titles and abstracts, we included 31 studies for full-text screening. In total, 17 studies (including our family study) were included in the qualitative synthesis, and 14 of the 17 studies (including our family study) were included in the meta-analysis. Figure 1 shows the PRISMA flow diagram of the selection process (Moher et al., Reference Moher, Liberati, Tetzlaff, Altman, Altman, Antes and Tugwell2009).

Figure 1. PRISMA flow diagram of study selection (Moher et al., Reference Moher, Liberati, Tetzlaff, Altman, Altman, Antes and Tugwell2009).
Meta-analysis: study characteristics
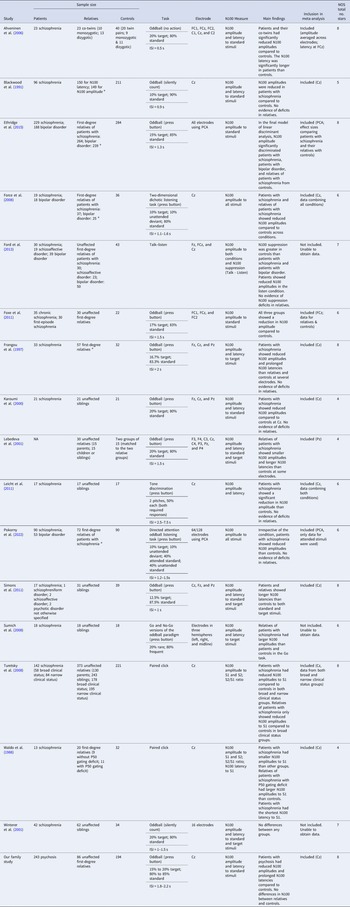
Table 2 summarizes information about the 17 studies included in the qualitative synthesis after the full-text screening. All studies included three clinical groups except Lebedeva and Orlova (Reference Lebedeva and Orlova2001), which compared relatives and controls only. All 17 studies included in the qualitative synthesis measured N100 amplitudes, and 11 studies measured N100 latencies. The N100 was measured at Cz in most studies, although some studies included more electrodes (mostly Fz and Pz) or computed the N100 based on principal component analysis. Three types of tasks were used to measure the N100: the auditory oddball paradigm or its variants, the paired click paradigm, and the talk-listen task (where the N100 response to an individual's own speech is compared with the N100 during listening).
Table 2. Summary of the 17 studies included in the qualitative synthesis

a Indicates that some relatives in the study had psychosis. ISI, interstimulus interval; S1 and S2, stimulus 1 and 2 in the paired click paradigm; PCA, principal component analysis; NOS, Newcastle-Ottawa Scale.
Note. This table summarizes the 17 studies included in the qualitative synthesis with their sample characteristics, methodology, main findings, whether they were included in the meta-analysis, and study quality assessed by the Newcastle-Ottawa Scale. A maximum of nine stars can be awarded by the Newcastle-Ottawa Scale, indicating optimal case-control designs.
Meta-analysis: results
N100 data were available for meta-analysis from 14 studies including our family study. The pooled sample for meta-analysis included 999 patients, 1192 relatives, and 1253 controls. All 14 studies provided data for N100 amplitude, while data for N100 latency were also available from eight studies. N100 data measured at Cz to the standard stimuli in the oddball paradigm or to S1 in the paired click paradigm were used when available in the meta-analysis. Otherwise, N100 data at different electrodes or in other conditions were also used, and the specific data used for each study in the meta-analysis are specified in Table 2.
We identified one outlier study with unusually small s.d.s for the N100 latency (Frangou et al., Reference Frangou, Sharma, Alarcon, Sigmudsson, Takei, Binnie and Murray1997). We calculated new corrected s.d.s treating the original s.d.s as s.e.s, and used the corrected s.d.s for the meta-analysis. We also performed separate analyses using the uncorrected data and sensitivity analyses excluding this outlier study for the primary meta-analysis. Those analyses yielded consistent results with the primary meta-analysis (online Supplementary Material; Figs S1 and S2).
For the primary meta-analysis comparing patients with psychosis and controls in family studies, we found very strong evidence that patients had reduced N100 amplitudes compared to controls with a medium effect size (s.m.d.: −0.48; 95% CI −0.59 to −0.36; p < 0.001; I 2 = 31%; Fig. 2a). Similarly, we found evidence that patients with psychosis had longer N100 latencies than controls with a medium effect size (s.m.d.: 0.43; 95% CI 0.03–0.82; p = 0.034; I 2 = 86%; Fig. 2b). The sensitivity analysis excluding participants with broad clinical status showed consistent results with the primary analysis (online Supplementary Fig. S3).

Figure 2. Forest plots comparing the N100 amplitude between 999 patients and 1216 controls (a) and the N100 latency between 466 patients and 585 controls (b). s.m.d., standardized mean difference.
Figure 3 shows the forest plots of the primary meta-analysis comparing relatives and controls. For the N100 amplitude, we found evidence that relatives had significantly smaller N100 amplitudes than controls with a small effect size (s.m.d.: −0.20; 95% CI −0.35 to −0.05; p = 0.011; I 2 = 60%; Fig. 3a). The meta-analysis also revealed that relatives had significantly longer N100 latencies than controls with a small effect size (s.m.d.: 0.33; 95% CI 0.16–0.50; p < 0.001; I 2 = 25%; Fig. 3b). However, in the sensitivity analysis excluding samples with affected relatives and with broad clinical status, we found that the difference in N100 amplitudes between unaffected relatives and controls became no longer significant (s.m.d.: −0.27; 95% CI −0.62 to 0.08; p = 0.129; I 2 = 74%; online Supplementary Fig. S4A). Nevertheless, the sensitivity analysis excluding samples with affected relatives showed consistent results with the primary analysis for the N100 latency (s.m.d.: 0.40; 95% CI 0.19–0.61; p < 0.001; I 2 = 23%; online Supplementary Fig. S4B).

Figure 3. Forest plots comparing the N100 amplitude between 1192 relatives and 1253 controls (a) the N100 latency between 402 relatives and 585 controls (b). s.m.d., standardized mean difference.
As all but two studies used the oddball paradigm or its variants to measure the N100, we conducted subgroup analyses excluding two studies using the paired click paradigm (Turetsky et al., Reference Turetsky, Calkins, Light, Olincy, Radant and Swerdlow2007; Waldo et al., Reference Waldo, Adler and Freedman1988). All subgroup analyses comparing the N100 and latency across the three clinical groups yielded consistent results with the primary analyses (online Supplementary Material; Figs. S5–S6).
Meta-analysis: risk of bias assessment
The number of stars scored by each study on the Newcastle-Ottawa Scale is presented in Table 2. No studies scored nine stars as experimental EEG studies typically do not report no-response rates (commonly recorded in epidemiological studies), but it is an item in the Newcastle-Ottawa Scale. Other common sources of potential bias identified by the scale included no independent validation of cases apart from record linkage or self-report, no description of case or control ascertainment (whether participants were recruited from hospitals or communities), and no controlling for age or sex in statistical analysis.
Funnel plots assessing publication bias for the primary meta-analysis are shown in online Supplementary Fig. S7. Studied in most analyses showed a relatively symmetrical pattern, which is typically interpreted as no evidence of publication bias. However, publication bias may still exist, especially for the meta-analysis of N100 amplitude comparing patients and controls, since studies with smaller samples reported slightly bigger effect sizes than the larger studies.
Discussion
In the current study, we examined the N100 amplitude and latency as potential endophenotypes for psychosis. Our multi-center family study and the meta-analysis confirmed that patients with psychosis had reduced N100 amplitudes and prolonged N100 latencies compared to controls of moderate severity. The meta-analysis including our family study with previously published data found that the relatives of patients with psychosis also had similar, yet milder deficits in the N100 amplitude and latency, although only delays in the N100 latency remained significant after excluding affected relatives.
Our findings are in line with previous studies that reported reduced N100 amplitudes in patients consistently (Rosburg, Reference Rosburg2018; Rosburg et al., Reference Rosburg, Boutros and Ford2008), and suggest that patients with psychosis may also have prolonged N100 latencies, which has been less researched in previous literature. We also provided further evidence that the N100 might not only be a biomarker associated with psychosis status (altered in patients with psychosis), but also an endophenotype that indicates psychosis genetic risk (altered in relatives). Our sensitivity analyses suggest that of the two biomarkers, the N100 latency is more robust as an endophenotype of genetic predisposition to psychosis since its results remained unchanged after excluding studies with affected relatives. Such prolongation in the N100 latency observed in patients and unaffected relatives may reflect delays in auditory processing, which is related to the genetic risk of psychosis.
There are several theories explaining the underlying mechanisms of N100 deficits in psychosis. First, as the N100 and P200 constitute the N1-P2 complex that can be clinically used to measure hearing thresholds (Lightfoot, Reference Lightfoot2016), the N100 deficits may be an indicator of subclinical hearing impairment, given how hearing impairment is associated with an increased risk of psychosis in epidemiological studies (Linszen, Brouwer, Heringa, & Sommer, Reference Linszen, Brouwer, Heringa and Sommer2016). Moreover, the N100 deficits are more commonly observed at longer interstimulus intervals (>1 s) in previous studies, possibly due to the larger N100 amplitudes induced by longer interstimulus intervals, which provide more power to detect group differences. This might indicate that patients take longer to recover from the previous N100 response than controls (Hari, Kaila, Katila, Tuomisto, & Varpula, Reference Hari, Kaila, Katila, Tuomisto and Varpula1982; Imada, Watanabe, Mashiko, Kawakatsu, & Kotani, Reference Imada, Watanabe, Mashiko, Kawakatsu and Kotani1997; Rosburg, Reference Rosburg2018; Rosburg, Zimmerer, & Huonker, Reference Rosburg, Zimmerer and Huonker2010; Shagass & Schwartz, Reference Shagass and Schwartz1963). This explanation might be better illustrated by the paired click paradigm, which can be viewed as a series of auditory stimuli presented with two different interstimulus intervals (usually about 0.5 s v. 10 s) (Rosburg, Reference Rosburg2018). Although the N100 occurs at a relatively early stage of auditory processing, the involvement of higher functions of the brain cannot be ruled out, since previous research suggests that the N100 might be modulated by attention (Hillyard, Hink, Schwent, & Picton, Reference Hillyard, Hink, Schwent and Picton1973; Rosburg et al., Reference Rosburg, Boutros and Ford2008). As most included studies measured the N100 triggered by standard rather than target stimuli, our meta-analysis indicates that patients with psychosis and their relatives have impaired responses to external sounds generally, possibly reflecting deficits in early auditory perception and/or attention. Future studies using dynamic causal modeling may help further unravel the role of the N100 in auditory processing in psychosis, and the method has been successfully applied to other ERPs, such as the mismatch negativity (Garrido, Kilner, Kiebel, & Friston, Reference Garrido, Kilner, Kiebel and Friston2009; Ranlund et al., Reference Ranlund, Adams, Díez, Constante, Dutt, Hall and Bramon2016).
The underlying neurobiology of the N100 deficits in psychosis remains unclear. Since N-methyl-D-aspartate (NMDA) glutamate receptors are implicated in the etiology of psychosis (Kantrowitz, Reference Kantrowitz2019), a few studies investigated the effect of NMDA receptor antagonists on the N100 in animal models and human participants but reported mixed results (Connolly et al., Reference Connolly, Maxwell, Liang, Kahn, Kanes, Abel and Siegel2004; Ehrlichman, Maxwell, Majumdar, & Siegel, Reference Ehrlichman, Maxwell, Majumdar and Siegel2008; Javitt, Jayachandra, Lindsley, Specht, & Schroeder, Reference Javitt, Jayachandra, Lindsley, Specht and Schroeder2000; Umbricht et al., Reference Umbricht, Schmid, Koller, Vollenweider, Hell and Javitt2000). There is also evidence suggesting a link between the N100 amplitude and the CHRNA4 gene, which encodes the nicotinic acetylcholine receptor alpha4 subunit (Espeseth, Endestad, Rootwelt, & Reinvang, Reference Espeseth, Endestad, Rootwelt and Reinvang2007; Mobascher et al., Reference Mobascher, Diaz-Lacava, Wagner, Gallinat, Wienker, Drichel and Winterer2016). However, two candidate gene studies examining this association between the N100 and CHRNA4 reported results in opposite directions (Espeseth et al., Reference Espeseth, Endestad, Rootwelt and Reinvang2007; Mobascher et al., Reference Mobascher, Diaz-Lacava, Wagner, Gallinat, Wienker, Drichel and Winterer2016).
A limitation of the meta-analysis is the different definitions of relatives across studies. Some studies included a few relatives affected by psychosis, which could have led to bias. Additionally, the N100 measured in different generations of participants could be confounded by potential yet not fully characterized age-related decline (Gmehlin, Kreisel, Bachmann, Weisbrod, & Thomas, Reference Gmehlin, Kreisel, Bachmann, Weisbrod and Thomas2011; Lijffijt et al., Reference Lijffijt, Moeller, Boutros, Burroughs, Lane, Steinberg and Swann2009). Moreover, as some patients and affected relatives included in the meta-analysis were on psychotropic medication, the N100 changes in patients and relatives might be confounded by medication effect. However, since we conducted sensitivity analyses on exclusively unaffected relatives and the results remained unchanged for the N100 latency, the N100 latency might be a trait marker independent of psychosis state and medication effect. Another limitation of the meta-analysis is that the methods used to measure the N100 varied greatly across studies. Two different paradigms (oddball and paired click) were employed by studies included in the meta-analysis, which reflect different underlying constructs reflected by the N100 (early auditory processing and sensory gating). Such methodological differences could also explain the high heterogeneity revealed by I 2 in some of our analyses. Since the N100 is often measured as a by-product in the oddball and paired-click paradigms, more studies comparing relatives and controls which employ standardized tasks specifically designed for the N100 (e.g. containing only standard tones with long interstimulus) are still needed and would advance reproducibility.
Our family study with 523 participants is one of the largest investigations of EEG in psychosis. However, potential confounders might exist in our family study as participants were recruited from two sites. To reduce heterogeneity, we measured the N100 using the same time window with similar collection and processing procedures, while also controlling for study site as a covariate in the regression model. We only had 86 relatives, which limited the power to detect deficits in this group, and therefore we conducted the meta-analysis combining ours and all previous family studies. With 999 patients, 1192 relatives, and 1253 controls, this is the first meta-analysis on the N100 in psychosis comparing all three clinical groups and one with a substantial size.
We conclude that both patients with psychosis and their relatives have reduced N100 amplitudes and prolonged N100 latencies. This makes the N100, especially the N100 latency (prolonged even in unaffected relatives), a promising endophenotype for psychosis. Neurophysiology offers a non-invasive imaging method well suited to multi-systems and cross-species comparisons. We need further cellular, animal, and human investigations of the N100 as a biomarker of perception and cognition and to elucidate the aetiological mechanisms in psychosis.
Supplementary material
The supplementary material for this article can be found at https://doi.org/10.1017/S0033291723003409
Funding statement
Baihan Wang is supported by the China Scholarship Council-University College London Joint Research Scholarship. Noushin Saadullah Khani is supported by a studentship co-funded by the Economic and Social Research Council (ESRC) and Mental Health Research UK. Jennifer F. Linden is supported by the NIHR Biomedical Research Centre at UCLH NHS Foundation Trust and University College London (Deafness and Hearing Problems Theme). Mei-Hua Hall is supported by the National Institute of Mental Health, Grant/Award Number: R01MH109687. Elvira Bramon is supported by Medical Research Council (G1100583, MR/W020238/1); National Institute of Health Research (NIHR200756); The British Medical Association's Margaret Temple Fellowship; Medical Research Council New Investigator and Centenary Awards (G0901310, G1100583); NIHR Biomedical Research Centre at University College London Hospitals NHS Foundation Trust and University College London.
Competing interests
None.


 Open access