


Introduction
Tea is an important product for putting resources into good use, creating employment, supplying raw materials to other industries and providing high added value. Tea production affects the lives of many people and farmers in the Eastern Black Sea Region of Turkey socially, economically and environmentally. As in other countries that cultivate tea, it is a significant source of income for the producers in Turkey. Because the tea plant grows in mountainous and hilly areas with steep slopes, it has a significant economic impact on these regions. It is also a strategic plant with a great potential for creating added value. In Turkey, tea is grown in the provinces of Rize, Trabzon, Artvin, Giresun and Ordu. 20% of all tea production areas in Turkey are in Trabzon, 11% in Artvin and 2% in Giresun and Ordu. As the most important province for tea cultivation, Rize has a 68% share in Turkey's total fresh tea production (ÇAYKUR, 2019; FAO, 2019). A crucial problem for Turkish tea plantations is the decreased soil fertility and quality. Rehabilitation of soils is an important problem for tea cultivating lands around the world. If precautions are not taken, extreme weather events with climate change can further reduce soil quality (Yazıcı, Reference Yazıcı2021).
To meet the needs of people with fewer costs and higher quality and to plan agricultural practices, institutions are asked to produce solutions. Measuring and reporting the response of individual soil parameters to a particular problem is no longer sufficient for producing solutions (Karlen et al., Reference Karlen, Doran, Weinhold and Andrews2003). As the main object of sustainable use, the soil should be considered associated with land management under changing natural conditions. Determining and monitoring the destruction of environmentally important components, that are water, soil and air, with reliable methods is a key step to ensure that the necessary measures can be taken in a timely manner. In this context, soil quality is its capacity to fulfil its physical, chemical and biological duties continuously and adequately for plants. Continuously fulfilling these physical, chemical and biological duties indicates that the soil is a dynamic living system. This system is explained by a unique balance and interaction between biological, physical and chemical components (Karlen et al., Reference Karlen, Mausbach, Doran, Cline, Harris and Schuman1997). Creating a sustainable agricultural ecosystem and meeting the needs without adversely affecting the environmental components of the present or the future depends on the reliability of methods of determining soil quality and the applicability of these methods in large areas.
Soil quality is the ability of soil to perform its functions and deliver multiple ecosystem services, such as maintaining crop productivity, preserving and maintaining water availability and supporting human activities (Tahat et al., Reference Tahat, Alananbe, Othman and Leskovar2020). Therefore, the main purpose of soil quality research is to monitor and assess the effects of tillage and other applications on physical, chemical and biological properties, use this assessment as a tool and examine the potentials of soils that indicate their past and present conditions. Moreover, soil quality is determined by dynamic variability and soil properties. For example, the texture is a natural property and cannot change easily. Soil quality is affected by dynamic properties and changes based on soil use and management. Hence, soil quality is a function of agro-climatic factors, hydrogeology and production techniques, and it is determined by many properties like soil depth, water holding capacity, bulk density, available nutrients, organic matter, microbial biomass carbon (MBC), carbon and nitrogen content, soil structure, infiltration rate and crop yield. Because of the correlations between these properties, very few of them have been identified as soil quality indicators, and research on soil quality and its numerical expression has been insufficient (Askari and Holden, Reference Askari and Holden2015). The concept of soil quality was first introduced in the 1990s due to the inadequacy of erosion control activities and the increasing interest in sustainability (Karlen et al., Reference Karlen, Doran, Weinhold and Andrews2003). To explain this concept, we need to know the multiple functions of the soil and better understand the relationship between agricultural activity and soil quality. Recently, soil quality has been associated with soil's role in plant production and environmental health (Gil-Sotres et al., Reference Gil-Sotres, Trasar-Cepeda, Leiros and Seoane2005). Today, there are two concepts about soil quality (Karlen et al., Reference Karlen, Mausbach, Doran, Cline, Harris and Schuman1997; Seybold et al., Reference Seybold, Mausbach, Karlen, Rogers, Stewart and Lal1997). The first is the capacity of the soil as a function of its properties (Doran and Parkin, Reference Doran, Parkin and Doran1994), and the second is the concept of fitness for use (Pierce and Larson, Reference Pierce, Larson and Kimble1993; Acton and Gregorich, Reference Acton, Gregorich, Acton and Gregorich1995). Capacity includes the properties that the soil contains like climate, topography, vegetation and parent material. These properties are indicated by other concepts like texture, slope, structure and colour as measured by soil surveys. Fitness for use is a dynamic concept and is affected by human activity and management. This concept is also often referred to as soil health. Though the boundary between these two concepts is not clear, soil quality is defined as a function of soil properties and soil health is considered the soil's ability to support, protect and develop sustainable plant and animal production, water and air quality and human and animal health.
The tea plant has a major place in herbal production in the Eastern Black Sea Region of Turkey because the most important factors that affect its growth are the climate and soil characteristics. The tea plant can grow in some regions under hot and rainy climatic conditions (Özyazıcı et al., Reference Özyazıcı, Özyazıcı and Dengiz2011). Regions with minimum annual precipitation of 1250 mm, temperatures ranging from 10–30°C, altitudes up to 2000 m, and a slope of 5–10% are ideal for tea plants. Hence, tea production is limited to a few regions around the world and is extremely sensitive to changes in conditions. Climate change puts the conditions of these limited tea cultivation areas at risk. The Eastern Black Sea region is surrounded by steep and high mountains, disallowing the use of mechanization and hampering the growth of agriculture and animal husbandry at the desired level. Therefore, being very adaptable to the region, the tea plant has great importance for the financial gains of the people in the region. In fact, tea cultivation is carried out in 82 247 ha land in the Eastern Black Sea Region (TUIK, 2021). With a high share in total tea cultivation fields, Rize has more than 125 thousand producers who carry out tea agriculture. So, Rize is a key province for its contribution to both employment and the economy (TUIK, 2020).
Although to the best of our knowledge, despite the economic and strategic significance of tea cultivation for Turkey, there is no detailed soil quality model for it. Agricultural soil quality has recently become an interesting topic for research with increased awareness in agricultural sustainability, reduced agricultural lands due to urbanization and rapid population growth and negative environmental effects. In the current study, the main motivation was to determine the soil quality in the micro-catchment lands with intensive long term tea cultivation in Rize province in the Eastern Black Sea Region under humid ecosystem conditions. So, we determined the soil quality properties of intensive tea cultivation lands in micro-catchment using spatial multi-criteria analysis (SMCA) and standard scoring function (SSF) integrated with the GIS and geostatistic considering the physical, chemical, productivity, biological and erosion susceptibility detailed soil indicators. Therefore, this study can be considered the first peer-reviewed article based on the detailed bio-physical-chemical properties of soil and environmental analyses for tea farming. Besides, the present study contributes to the literature on tea production by outlining the information that will enable the planning of future initiatives that integrate sustainable soil and land management in tea production.
Materials and methods
General study area description
Rize province is located between longitudes 40° 21′ and 41° 25′ E and latitudes 40° 33′ and 41° 20′ N (Fig. 1). The province has an area of 3920 km2, being mostly mountainous. Rize province is surrounded by Trabzon in the west, Erzurum and Bayburt in the south, Artvin in the east and the Black Sea in the north.
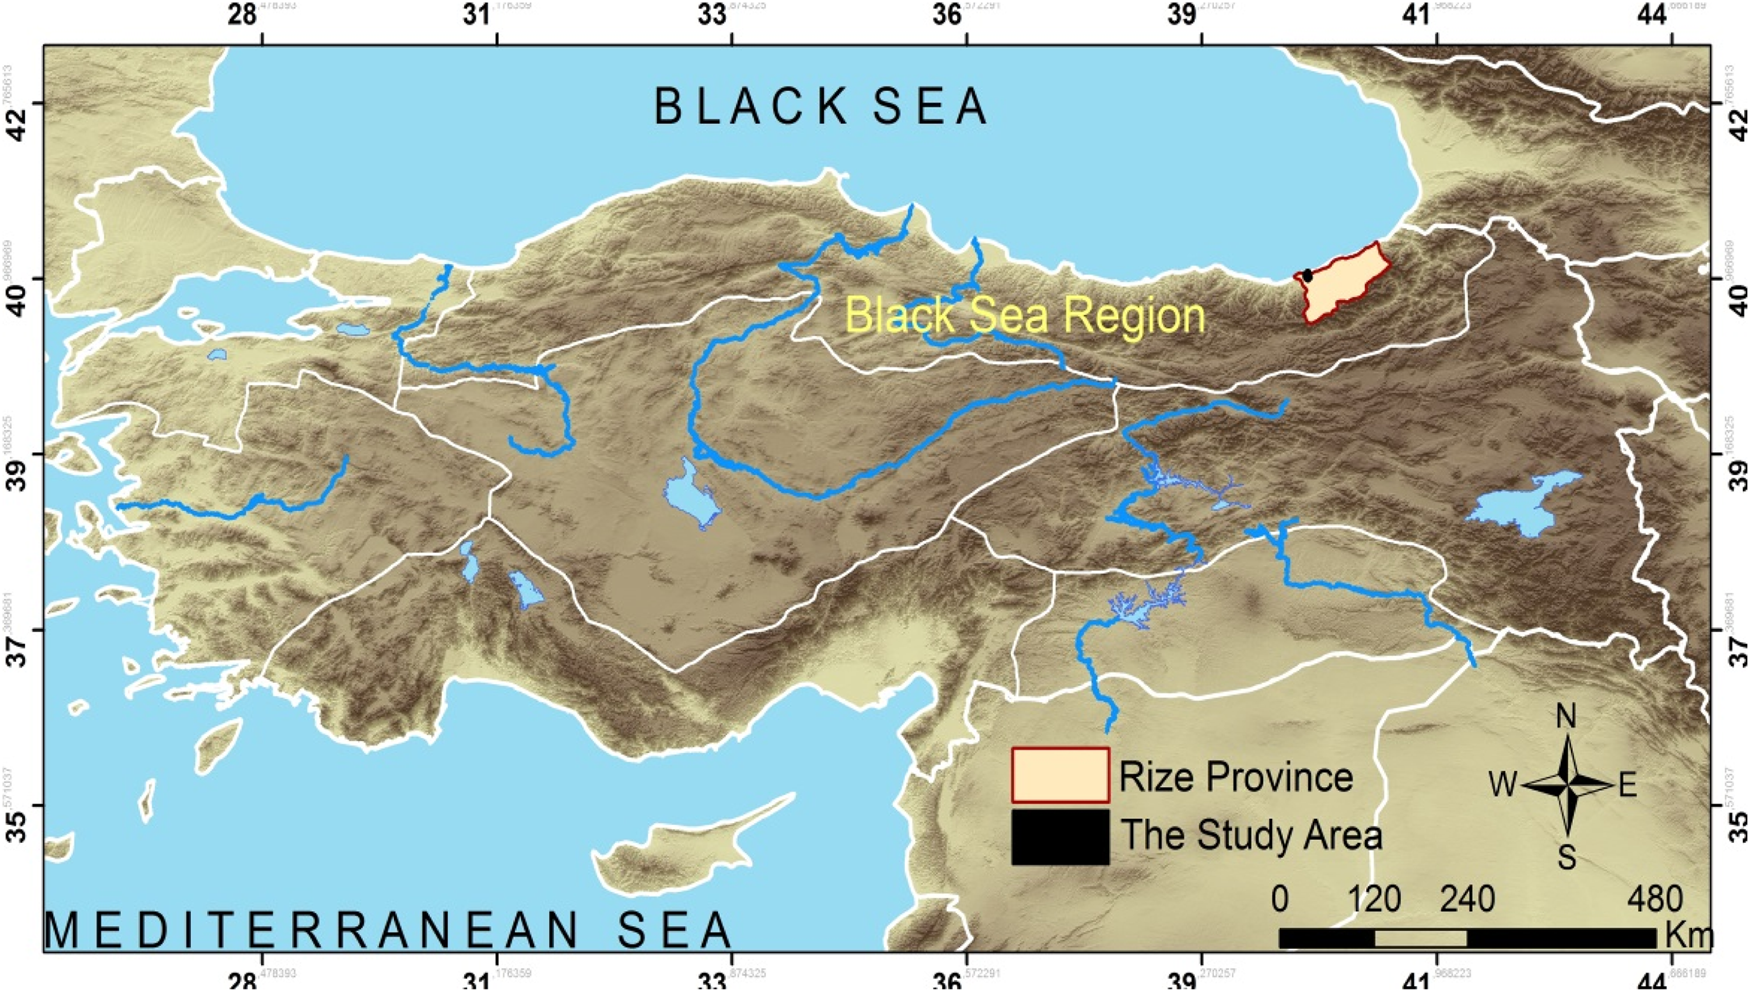
Fig. 1. Location map of the study area.
The study area was a micro-catchment in Rize province with an area of approximately 1671.8 ha and an altitude between 0 and 862 m above sea level. The micro-catchment has a mountainous and rugged topography and the slope varies widely (Fig. 2). The south-western parts of the area have lands with gentle to moderate (6–12%) slopes. However, most of the south-eastern and northern regions have steeper slopes, turning into a steep topography further these directions. Also, the slope exposure is toward the northeast and east in most of the area. The areas to the northeast and east of the riverbed have an exposure toward the north-west and east.
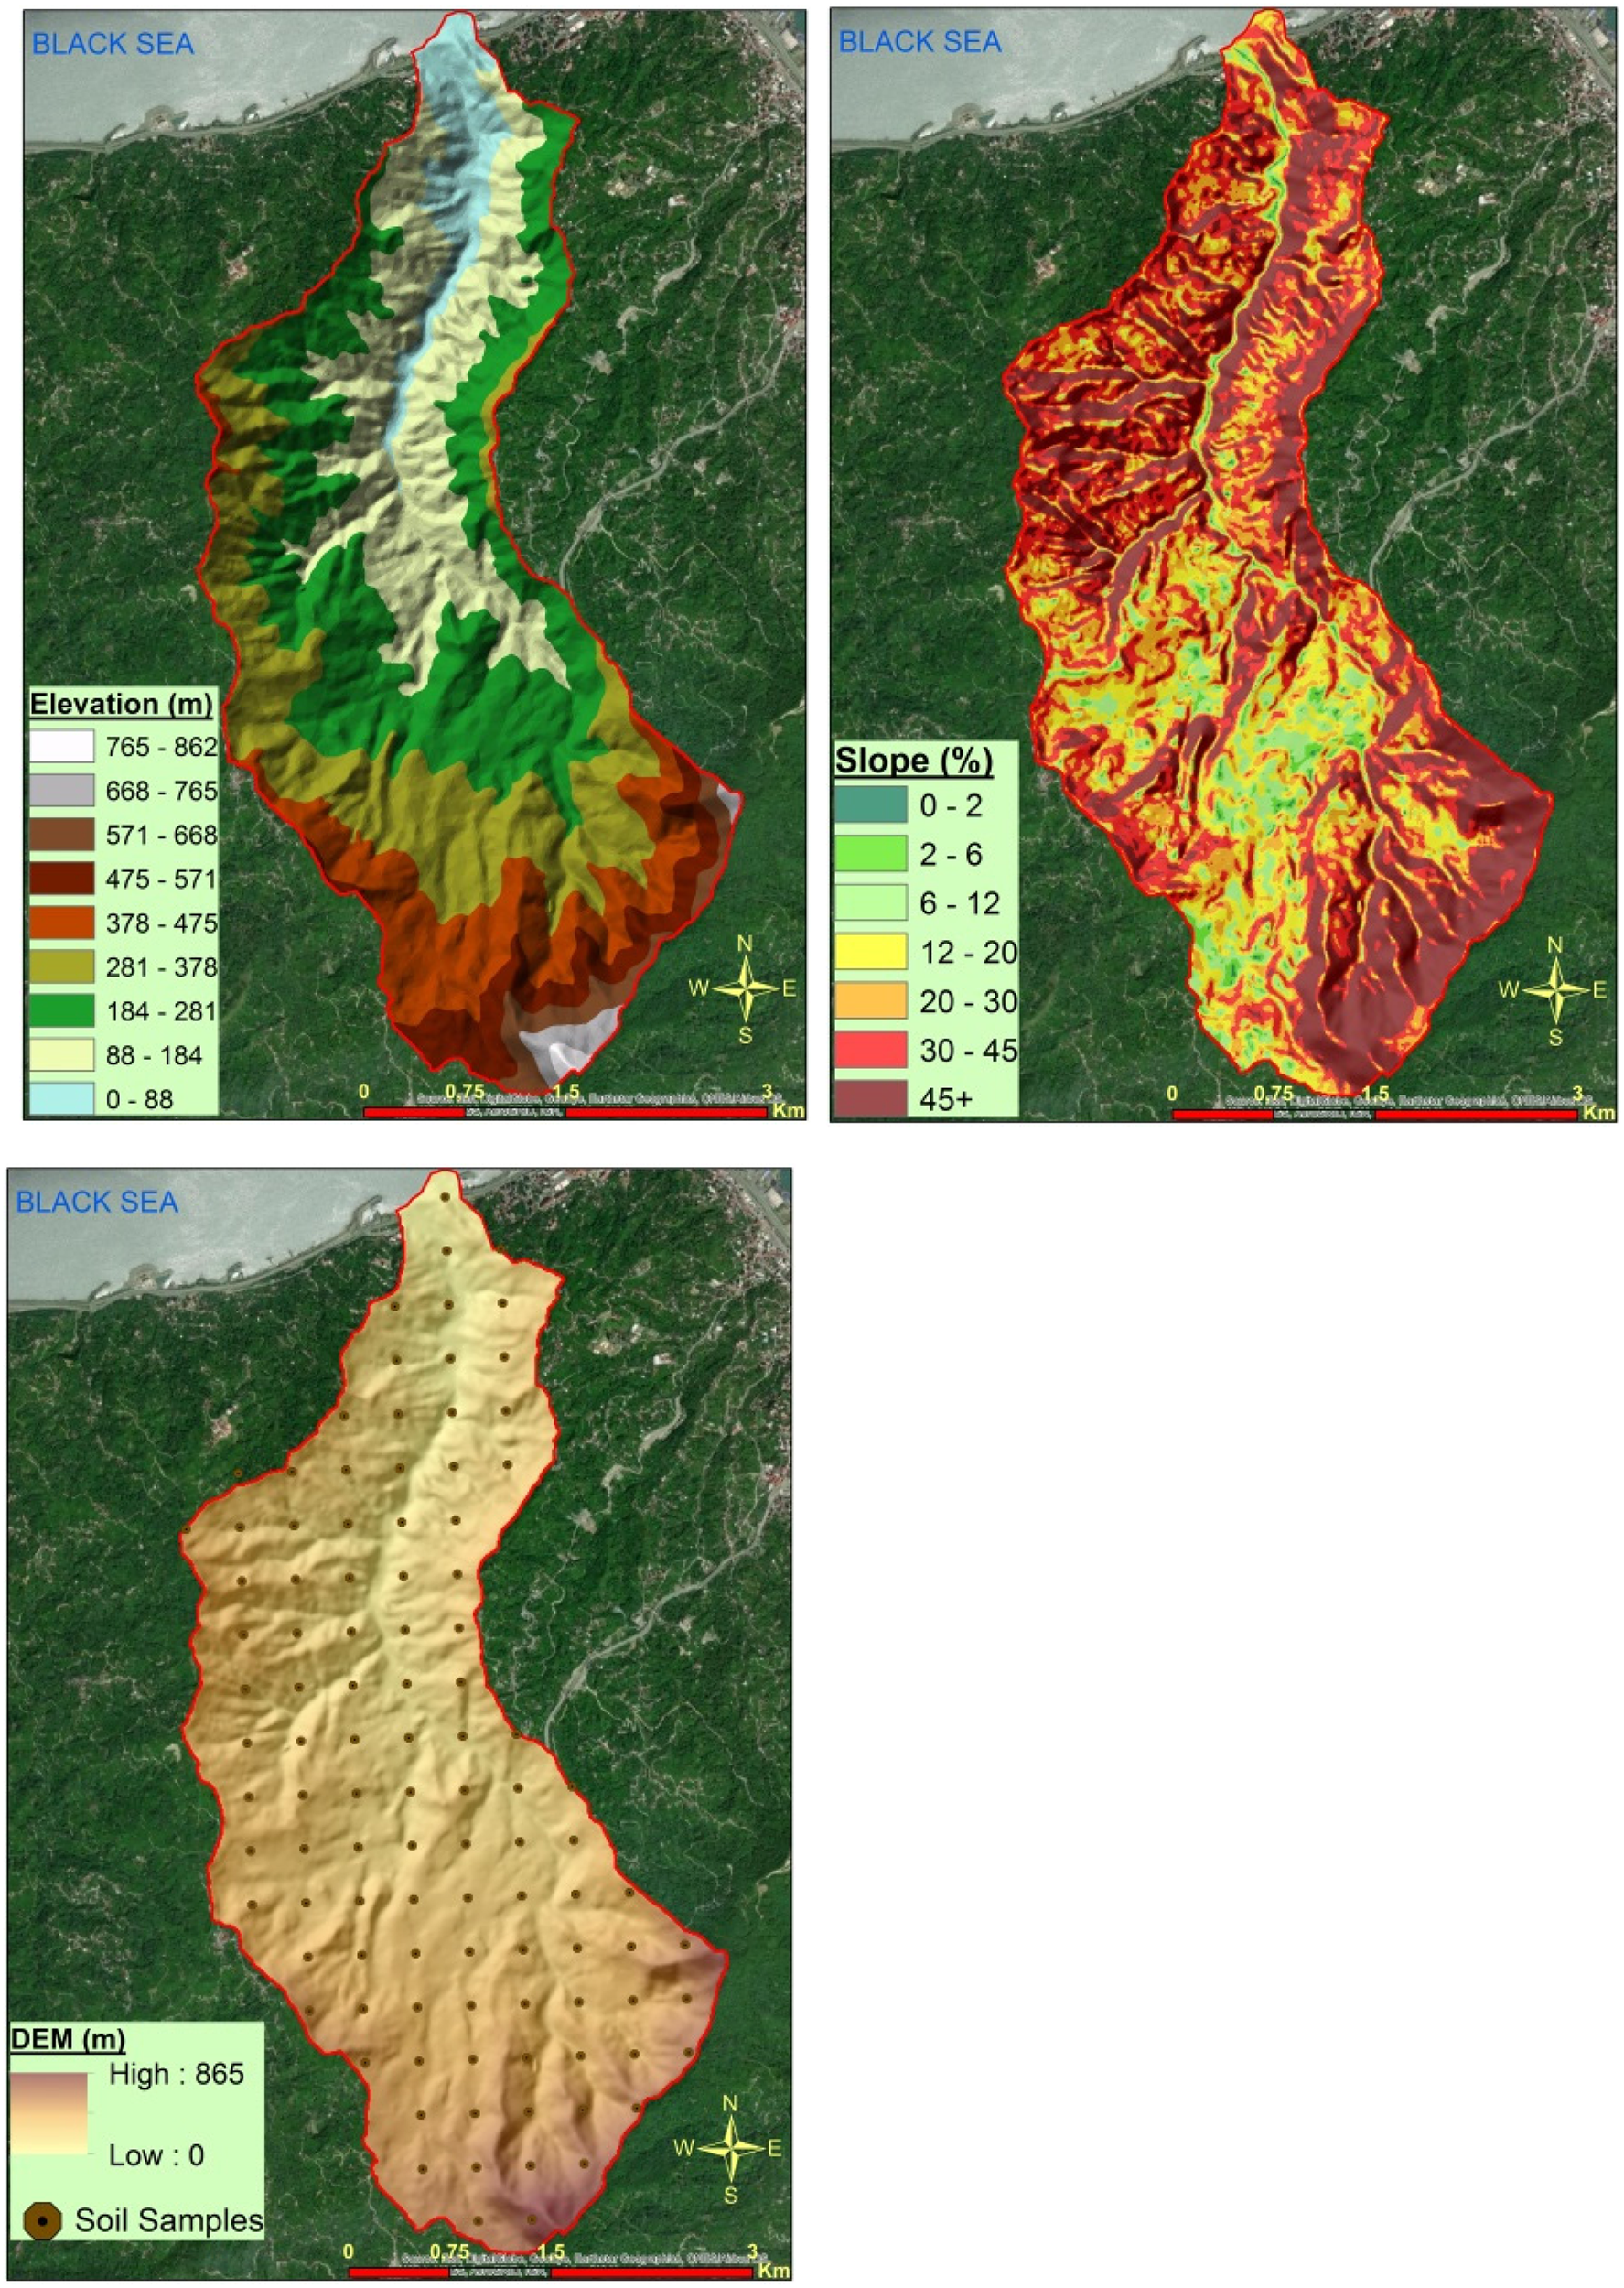
Fig. 2. Elevation, slope and soil sample maps of the study area.
Considering geological content, most of the micro-catchment consists of volcanic sedimentary rocks, with a mixture of sandstone-mudstone-limestone in the southeast. Red yellow podzolic soils are distributed throughout the area. These soils are classified as Alisol-Acrisol according to FAO-WRB (2014). Most of the micro-catchment is used for tea cultivation and few lands have forest and pasture areas.
The Black Sea climate is dominant in Rize province. Based on the general characteristics of this climate, the region is cool during summer, mild during winter and rainy in almost every season. The biggest factor here is that the mountains extend parallel to the coast. Meteorological data for long term periods show that Rize province has an annual average temperature of 14.3°C, the lowest temperature of 6.5°C and the highest temperature of 23.1°C. The coldest month is January and the warmest is August. Annual precipitation is more than 2300 mm, making Rize the rainiest province in Turkey. Precipitation is evenly distributed across all seasons and there is no dry season. The least precipitation occurs during spring and the most during autumn. Humidity is always above 75%. According to the Newhall simulation model (Van Wambeke, Reference Van Wambeke2000), the soil temperature regime is Mesic, and the soil moisture regime is Perudic.
Soil sampling and analysis
In order to get the most uniform distribution possible, we collected 102 soil samples from the surface depth (0–20 cm) (Fig. 2). Soil sampling was carried out in 2020 and after the tea harvest, to make sure other applications like fertilization did not affect the soil properties. Besides, we took into account different topographic locations and land use/land cover (tea plant) types when collecting the soil samples.
The soil samples were separated from coarse particles, air-dried under laboratory conditions and sieved through a 2 mm sieve. Soil quality status can be evaluated through primary indicators of soil quality that are integrated with soil's physical, chemical and biological properties (Anup and Ghimire, Reference Anup, Ghimire, Panpatte and Jhala2019). After they were ready for analysis, we analysed 35 soil quality parameters including physical, chemical and biological properties, plant nutrients and erodibility which indicate susceptibility to erosion. In the soil quality index for Tea Cultivation (TSQI), the indicators are grouped under five categories:
• Physical indicators: sand, clay, silt, bulk density (BD), saturated hydraulic conductivity (HC), field capacity (FC) and permanent wilting point (PWP)
• Chemical indicators: organic matter (OM), CaCO3, electrical conductivity (EC), soil reaction (pH), hydrogen ion content (H) and cation exchange capacity (CEC)
• Nutrient indicators: available phosphorus (AvP), total nitrogen (TN), exchangeable potassium (ExK), exchangeable magnesium (ExMg), exchangeable calcium (ExCa), exchangeable sodium (ExNa), available iron (AvFe), available manganese (AvMn), available copper (AvCu) and available zinc (AvZn)
• Biological indicators: MBC (Cmic), basal respiration (CO2), Cmic/CO2 ratio and metabolic quotient (qCO2)
• Soil erodibility factors: Aggregate stability (AS), Dispersion ratio (DR), Erodibility ratio (ER), Structure stability index (SSI), Clay ratio (CR) and Crust Formation (CF).
Table 1 shows the analyses of the physical, chemical, biological, productivity and erodibility indicators for determining the soil quality indices of tea cultivation soils.
Table 1. Protocol measurements for indicators selected in the study
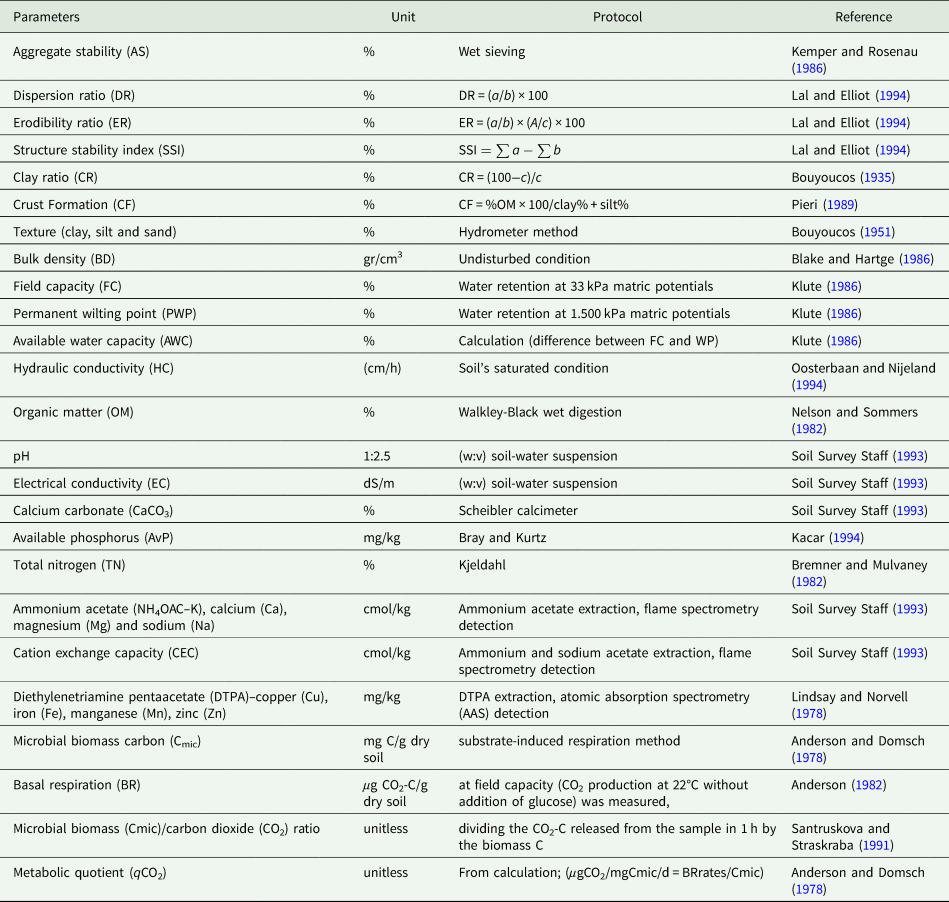
a is the percentage of silt plus clay in suspension, b is the percentage of silt plus clay dispersed with chemical agent, A is the field capacity, c is the percentage of clay dispersed with chemical agent.
Structure and stages of the soil quality index model
This study was performed to evaluate the variation in soil quality in tea cultivation fields. To overcome the complex ecological structure of nature, we integrated various methodologies like geographic information system (GIS) techniques, multi-criteria decision analyses (MCDA), SSF, geostatistics, analytical hierarchical processes and principal component analyses. Figure 3 shows the modelling architecture and the correlations between the methods. A soil quality index (SQI) study consists of four stages. The first is modelling the structure and data collection for the database. The second step is selecting soil quality indicators. The third is to gather, score and weight these indicators, obtain total and minimum datasets (TDS-MDS) and process this data to obtain a spatial distribution for SQI changes using GIS and geostatistical techniques. The final step involves evaluating the results of the data analysis.
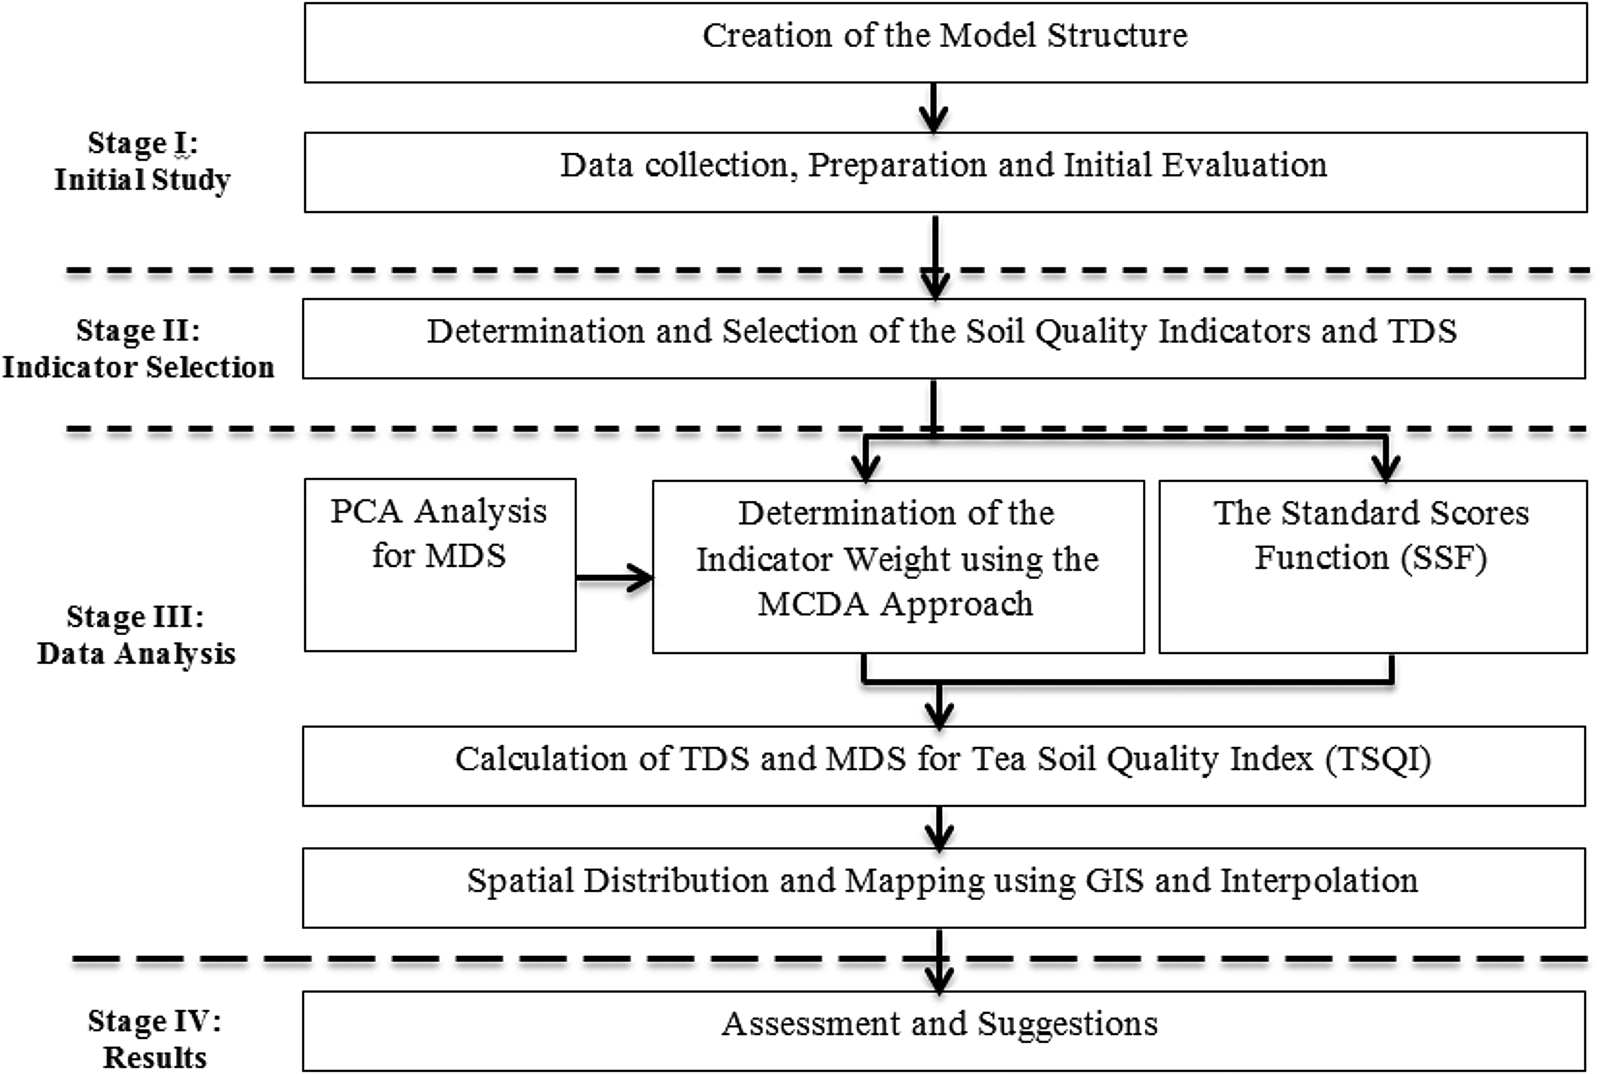
Fig. 3. Modelling architecture designed for the tea soil quality index (TDS: total data set; PCA: principal components analysis; MSD: minimum data set; MCDA: multi criteria decision analysis; SSF: standard scores function; TSQI: tea soil quality index; GIS: geographical information system).
Weighting process- multi-criteria decision-making analysis and soil quality scoring-SSF
Multi-criteria decision-making analysis (MCDA) methods offer numerous methodologies to effectively help decision-makers in complex problems with multiple, conflicting criteria. Analytical Hierarchy Process (AHP) is a mathematical MCDA method developed by Saaty (Reference Saaty2008) and frequently used in the literature (Dengiz et al., Reference Dengiz, İç, Saygın and İmamoğlu2020; Özkan et al., Reference Özkan, Dengiz and Turan2020; Karaca et al., Reference Karaca, Dengiz, Demirağ Turan, Özkan, Dedeoğlu, Gülser, Sargin, Demirkaya and Ay2021). It considers the priorities of the group or the individual and evaluates qualitative and quantitative variables together with pairwise comparisons (Saaty, Reference Saaty2008). Saaty (Reference Saaty1977) suggested a comparison consisting of values ranging from 1 to 9 that described the degree of importance. Using these comparison matrices, we weighted the soil properties with AHP according to their importance level.
Depending on the correlation level of each factor of the criteria with the soil quality processes, the weight scores were determined using the SSF. When selecting the physical, chemical, productivity and biological indicators of soil quality index for tea cultivation, we took into account many of the previous studies (Kacar, Reference Kacar1984; Özyazıcı et al., Reference Özyazıcı, Özyazıcı, Özdemir and Sürücü2010, Reference Özyazıcı, Dengiz and Aydoğan2013; Saygın et al., Reference Saygın, Gürsoy, Demirağ Turan and Dengiz2017; Dengiz et al., Reference Dengiz, İç, Saygın and İmamoğlu2020; Karaca et al., Reference Karaca, Dengiz, Demirağ Turan, Özkan, Dedeoğlu, Gülser, Sargin, Demirkaya and Ay2021). We also considered some physical quality factors that indicate erosion susceptibility like dispersion ratio, erodibility ratio and structural stability index, as suggested by Dengiz et al. (Reference Dengiz, İç, Saygın and İmamoğlu2020). Because of the high precipitation and the steep slopes in the area, the destruction of the surface soil by the vegetation can cause the soil to be replaced by erosion. To convert the soil quality indicators for tea cultivation to unitless values and to obtain scores between 0–1, we used SSF as given in Table 2. Generally, there are 3 scoring functions (Karlen and Stott, Reference Karlen, Stott, Doran, Coleman, Bezdicek and Stewart1994; Wymore, Reference Wymore1993). Here, a high score for the parameter indicates a positive relationship between the soil quality and the parameter (more is better-MB), so positive SSF is used. In the other case, negative SSF is used to indicate a lower parameter for better soil quality (less is better-LB). Besides, the parameters that are positively related to soil quality are determined by the optimum SSF scoring formula (Armenise et al., Reference Armenise, Redmile-Gordon, Stellacci, Ciccarese and Rubino2013). Here, it was considered as the positive and negative scoring function for parameters presented in Table 2.
Table 2. Standard scoring functions (SSF) and selected parameters for soil indicators

FT, function type; MB, more is better; LB, low is better; OR, optimal range; SSF, standard scoring function.
a In these three equations, x is the monitoring value of the indicator, f(x) is the score of indicators ranged between 0.1 and 1, and L and U are the lower and the upper threshold value, respectively.
While performing an agricultural soil quality analysis for plants, it is appropriate to approach the problem as a multi-criteria evaluation or a multi-criteria decision-making problem. When determining the soil quality status of the land for the tea plant, we used 35 soil and land quality criteria and evaluated them in a hierarchical order in four main groups: physical, chemical, productivity and biological. The AHP was applied both in determining the weight of the main factors and the weight of their sub-criteria. Below is the hierarchical order of these parameters.
If the values of the soil for the determined criteria and their relative importance levels are known, using the weighted linear combination (WLC) method to analyse the soil quality classes is appropriate. WLC is also known as simple additive weighting (SAW), weighted sum, weighted linear average or weighted overlay (Malczewski and Rinner, Reference Malczewski and Rinner2015). This method is based on the weighted average, and an index is created by summing the contributions of each criterion. Using WLC, soil quality for the tea plant is calculated using the formula below.

where TSQI is the soil quality index of sample i for tea cultivation, w k is the degree of importance of criterion k, a ik is the standard value of sample i under criterion k, and l is the total number of criteria (Elalfy et al., Reference Elalfy, Elhadary and Elashry2010). Given the frequency distribution of the index values and statistical information, we deemed it appropriate to show each tea total dataset soil quality index (TSQITDS) and tea minimum dataset soil quality index (TSQIMDS) in 5 classifications according to the Natural Breaks Jenks method (Jenks, Reference Jenks1967). This method is used when the data are not distributed evenly and there are large differences between the values, requiring classifications (Özkan et al., Reference Özkan, Dengiz and Turan2020).
Principal components analysis and creating spatial distribution maps
The purpose of principal components analysis (PCA) is data reduction and interpretation (Johnson and Wichern, Reference Johnson and Wichern2007). It reduces many variables to a smaller group without losing information and increases the power of interpretation. PCA is a linear analysis. Algebraically, the principal components are expressed as a linear combination of random variables (x1, x2, …, xp), where p is the number of variables; geometrically, linear combinations reveal a new coordinate system by rotating the original axes. These new axes represent the aspects of the highest variability (Johnson and Wichern, Reference Johnson and Wichern2007). The rotation is applied after the components are revealed by PCA. The aim of this rotation is to ensure a better interpretation of the structure by the factors. Whichever method is used to reveal the factor or the components, a good dataset yields similar results. In case of obvious correlations, different rotation methods tend to produce similar results.
We applied a PCA to the data to create the minimum dataset from the selected indicators for determining soil quality for tea cultivation. When determining the parameters that can be included in the minimum dataset, we took into account the component loads determined by PCA, correlation weight sums and correlation analysis methods. We compared the soil quality index values for both the total dataset and the minimum dataset using the T test (Alpar, Reference Alpar2017). The descriptive statistics of the soils were determined by PCA using the IBM SPSS 23 package software. Also, the relationship between the total dataset and the minimum dataset was statistically revealed by a Taylor diagram. The images were created using the libraries ‘chron,’ ‘lattice,’ ‘ggplot2,’ ‘plotrix,’ and ‘graphics’ on the ‘R’ software. The Taylor diagram evaluates the similarity, correlations, centripetal root mean squares and the magnitudes of variation between two datasets (Taylor, Reference Taylor2001). We evaluated different interpolation models of soil quality indices for both the total and minimum datasets (Inverse distance weighting-IDW, Radial basis functions, Kriging). We created distribution maps for the fittest model using the ArcGIS 10.5v software. We also used the method that gave the lowest root mean square error (RMSE) when selecting the fittest distribution model. RMSE was calculated by the following equation:

where; Zi is the estimated point value, Z i* is the measured point value, and n is the number of samples.
Results
Physical-chemical, productivity and biological properties of soils
To determine their quality indices, we examined 35 physical, chemical, productivity and biological properties in 102 soil samples in a micro-catchment for tea cultivation. Table 3 gives the basic descriptive statistics of these properties. 13 of these properties were physical quality indicators of tea cultivation soils. The soils were often medium to coarse-textured, their sand ratios ranged from 41.7 to 79.8% and clay ratios ranged from 4.8 to 36.2%. This change in the structure also affected the bulk density (BD) and hydraulic conductivity (HC), and these factors have 1.3 gr/cm3 and 5.2 cm/h mean values within the area. Clay and organic matter contents are important factors that affect water retention in the soil. The field capacity of the soils ranged from 12.0 to 34.6% and available water-holding capacity ranged from 6.6 to 20.6%.
Table 3. Descriptive statistics of some physical-chemical and biological properties of soil sample
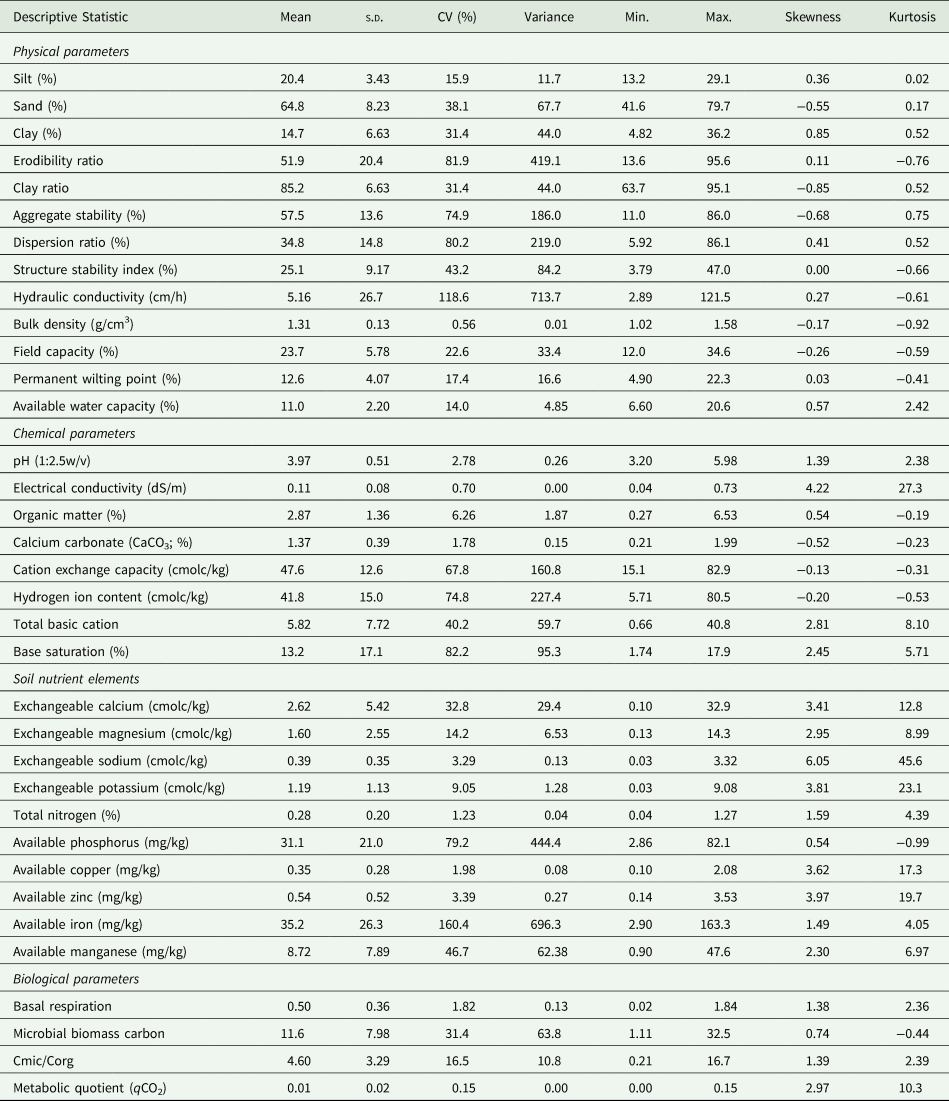
s.d., standard deviation, CV, coefficient of variation.
Most of the lands in the micro-catchment had slopes, and the tea gardens were located on these lands. Also, because the micro-catchment had very high precipitation, the sensitivity of the soils to replacement was increased. In this context, we investigated the erosion susceptibility factors of some soils. Erosion ratio (ER) ranged from 13.7 to 95.7% and clay ratio (CR) ranged from 4.82 to 36.2%. Besides, the soils had average aggregate stability (AS) of 57.5%, dispersion ratio (DR) of 34.8% and structural stability index (SSI) of 25.1%. Considering the skewness coefficients of these parameters, silt, ER, DR, SSI, HC, BD, FC and PWP showed normal distribution, but the other properties showed non-normal distribution. Among the properties with non-normal distribution, sand, CR and AS were negatively skewed, while the others were positively skewed (right). Many researchers accept the coefficient of variation (CV) as an important indicator for changes in soil properties (Dengiz et al., Reference Dengiz, İç, Saygın and İmamoğlu2020; Şenol et al., Reference Şenol, Alaboz, Demir and Dengiz2020; Karaca et al., Reference Karaca, Dengiz, Demirağ Turan, Özkan, Dedeoğlu, Gülser, Sargin, Demirkaya and Ay2021) and classify it as low (<15%), moderate (15–35%) or high (>35%) based on the value (Wilding, Reference Wilding, Nielsen and Bouma1985; Mulla and McBratney, Reference Mulla, McBratney and Sumner2000). Accordingly, in our study area, sand, ER, AS, DR, SSI and HC had high variability; silt, FC and PWP had moderate variability; the other soil properties had low variability.
We selected 12 parameters as chemical quality indicators. The micro-catchment soils ranged between strongly acid and slightly acid reactions, with an average pH of 3.9. There was no salinity problem in the soils, and EC ranged from 0.04 to 0.7 dS/m. The lime content was quite low at an average of 1.4%. The dominant cation was the hydrogen ion, with an average of 41.8 cmolc/kg, as the soil mostly had a mild to strongly acid reaction. The total basic cation contents ranged from 0.7 to 40.8 cmolc/kg, and the base saturation ranged from 1.7 to 83.9%. Also, the skewness coefficients and the CEC showed normal distribution, while the other properties showed non-normal distribution. In the study area, CEC, total basic cation, base saturation, and H ion had high variability and all the other soil properties showed low variability. Considering the macro and micronutrient properties, total nitrogen (TN) ranged from 0.04 to 1.27% and available phosphorus (AvP) ranged from 2.8 to 82.1 mg/kg. Among available micronutrients, average AvCu, AvZn, AvFe and AvMn contents were 0.3, 0.5, 35.2 and 8.7 mg/kg, respectively. The skewness coefficients of the properties showed non-normal distribution. AvP, AvFe and ExMn had high variability, and all the other soil properties showed low variability.
Today, there are numerous methods and approaches for determining microorganisms and their activities in a micro-habitat (Karaca et al., Reference Karaca, Dengiz, Demirağ Turan, Özkan, Dedeoğlu, Gülser, Sargin, Demirkaya and Ay2021). Table 3 shows the descriptive statistics of the four indicators considered for the biological soil quality properties. Soil respiration (CO2) ranged from 0.02 to 1.8 and averaged 0.5. MBC showed significant variability, as in soil respiration, ranging from 1.1 to 32.6 mgC/g dry soil. The average metabolic quotient (qCO2) was 0.01, and the average Cmic/Corg was 4.6. Besides, the soils showed non-normal distribution, and all were positively skewed (right). In terms of coefficient of variability, MBC and Cmic/Corg showed moderate variability, while all the other soil properties showed low variability.
Creating a minimum dataset
To ensure sustainability in tea cultivation soils and determine the soil quality index, one of the most important steps is to select the most appropriate soil indicators. In this study, we evaluated 35 factors in a total dataset (TDS) to best represent the physical, chemical, biological, productivity and erosion susceptibility properties of soils. We used the PCA to generate this minimum dataset (Doran et al., Reference Doran, Parkin and Doran1994; Qi et al., Reference Qi, Darilek, Huang, Zhao, Sun and Gu2009; Nabiollahi et al., Reference Nabiollahi, Taghizadeh-Mehrjardi, Kerry and Moradian2017). Before creating the minimum dataset, we performed a normality test on the dataset. We applied square root transformation on the non-normally distributed parameters: clay, OM, CF, AWC, MBC, pH, AvP, basal respiration, CEC and ExK. We also applied logarithmic transformation on the parameters of EC, TN, AvCu, AvZn, AvFe, Mn, qCO2, ExCa and ExNa. This way, the dataset was approximated to normal distribution. Then, we performed a factor analysis. According to the results, we accepted the groups with eigenvalues equal to or greater than 1 as factors, taking the critical factor load as 0.5 (Wander and Bollero, Reference Wander and Bollero1999; Andrews et al., Reference Andrews, Mitchell, Mancinelli, Karlen, Hartz, Horwath and Munk2002). For each factor, we defined variables with high factor loadings as the most representative indicators, considering that the factors had absolute values at 10% of the highest factor load (Andrews et al., Reference Andrews, Mitchell, Mancinelli, Karlen, Hartz, Horwath and Munk2002; Sharma et al., Reference Sharma, Mandal, Srinivas, Vittal, Mandal, Grace and Ramesh2005; Govaerts et al., Reference Govaerts, Sayre and Deckers2006; Nabiollahi et al., Reference Nabiollahi, Taghizadeh-Mehrjardi, Kerry and Moradian2017).
According to our findings, 79.6% of the total variation was explained by these factors (Table 3). After the Varimax transformation, sand had the highest load for factor F1, CF had the highest load for F2 and ExCa and ExMg had the highest load for F3. When multiple indicators have the highest load under a single factor, the correlation coefficient is checked for the minimum dataset (Andrews et al., Reference Andrews, Mitchell, Mancinelli, Karlen, Hartz, Horwath and Munk2002). Well-correlated variables are considered redundant and only one is considered for the minimum dataset. If there is no correlation, both indicators are selected for a single factor. Accordingly, we chose ExCa with the highest load for F3. Regarding the remaining factors, AvP had the highest load for F4, EO for F5, CEC for F6, depth for F7, AvFe for F8 and MBS for F9 (Table 4).
Table 4. Results of principal component analyses of potential soil quality parameters
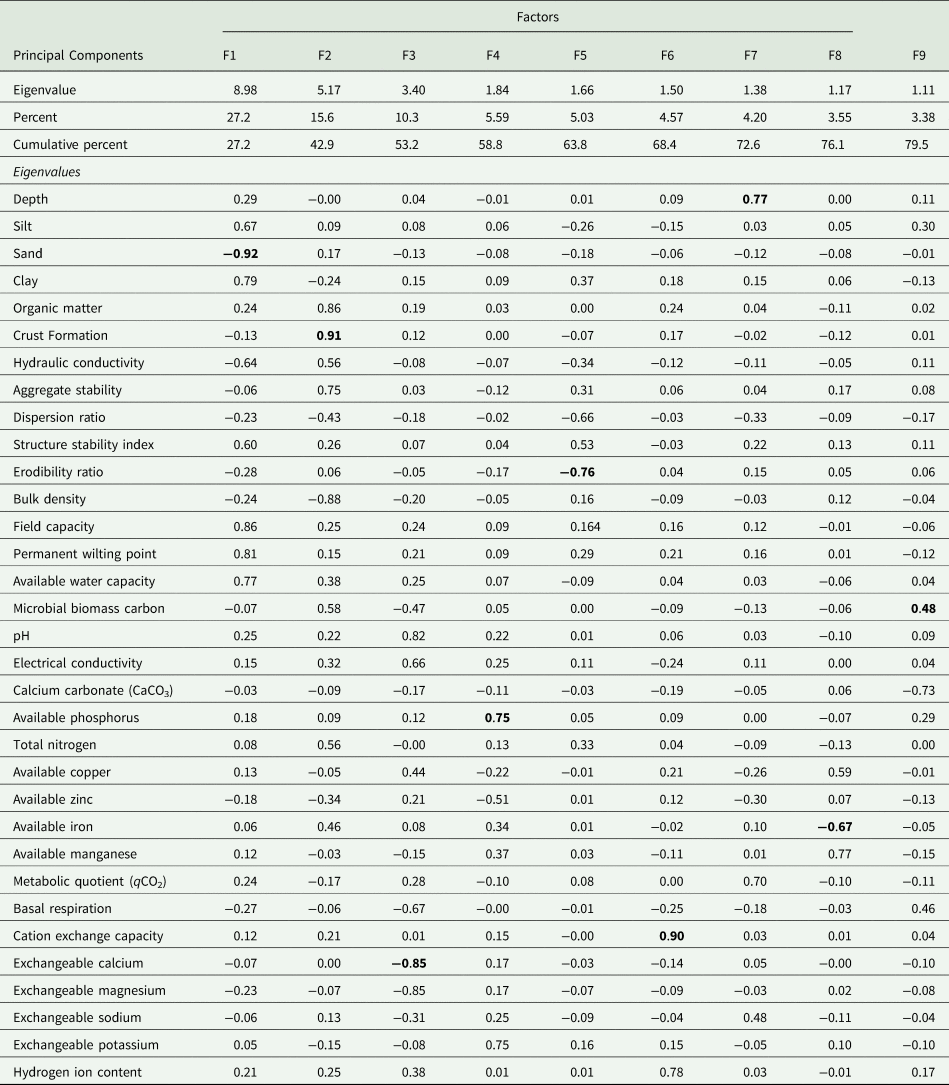
The factor loadings in bold are considered highly weighted.
Soil quality indices for total and minimum datasets with weighting
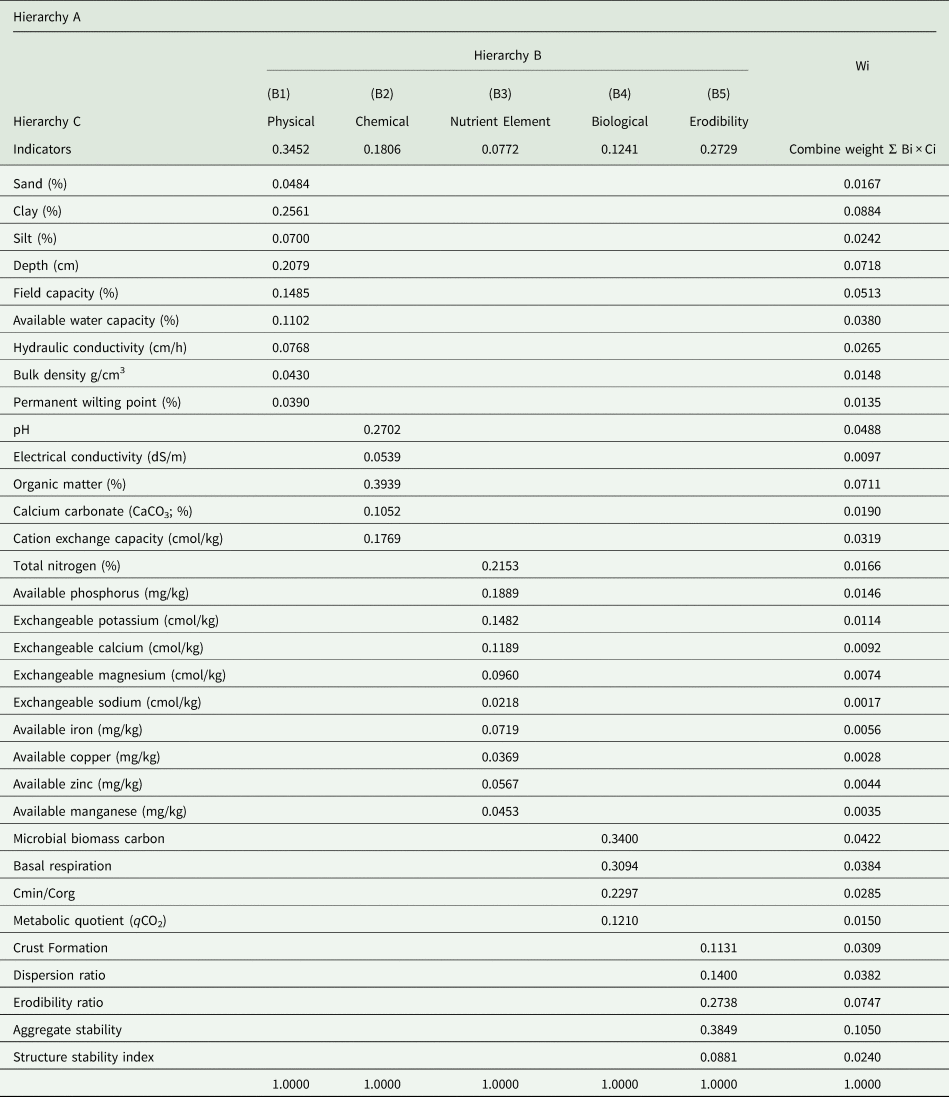
According to Doran and Jones (Reference Doran and Jones1996), to begin a TSQI calculation, soil quality indicators are first defined as soil formation processes and properties that are sensitive to variability due to natural or artificial indicators. So, soil quality indicators can be divided into two categories: natural and dynamic. Examples of natural indicators are grain size distribution or mineral composition, and an example of dynamic indicators includes soil conditions resulting from the current agro-technology. Wienhold et al. (Reference Wienhold, Andrews and Karlen2004) suggested that dynamic indicators are used to evaluate how soil management decisions affect soil properties. The 35 soil quality indicators we used here made it possible to reflect the main effects of agricultural practices and the soil properties of the tea plant. We assigned weights to each soil sample after the following procedures. First, we applied one of the most frequently used MCDA methods, the AHP technique, to determine the eigenvector values. In this step, the consistency ratio was set to 0.1. Table 5 shows the contribution weights of soil indicators to T- SQI estimated by AHP. In the hierarchy, B1 (physical indicators) had the highest value (0.35), while productivity (B3) had the lowest value (0.08). For each hierarchy (B1, B2, B3, B4 and B5), the highest indicator values were found for clay (0.26), OM (0.39), TN (0.22), basal respiration (0.34) and AS (0.39), respectively.
Table 5. Contribution weight of soil parameters to soil quality calculated by the AHP
Secondly, we determined score values for all indicators according to their function on soil quality using a SSF approach, corresponding to a value between 0 and 1, meaning high and low function. We assigned an eigenvector value to each indicator and determined the scoring values. Finally, we determined the TSQI value for each soil sample using the WLC technique. We then applied the same process to the indicators in the minimum dataset determined by PCA analysis [physical indicators: erosion ratio (ER), crust formation (CF), available phosphorus (AvP); productivity indicators: ExCa and AvFe ions; chemical indicator: cation exchange capacity (CEC); biological indicator: MBC.
To create a spatial distribution map for the soil quality indices of the tea cultivation soils in the micro-catchment, we determined the most suitable distribution models for the TSQI values of each point using different interpolation methods. The RMSE values for both the total and minimum data sets are shown in Table 6. Accordingly, the lowest RMSE was observed for the Invers Distance Weighting (IDW-1) model in the total dataset (TSQITDS) and the Spline with Tension (SWT) model of Radial Base Function (RBF) in the minimum dataset (TSQIMDS).
Table 6. Interpolation models and RMSE values of TSQITDS and TSQIMDS
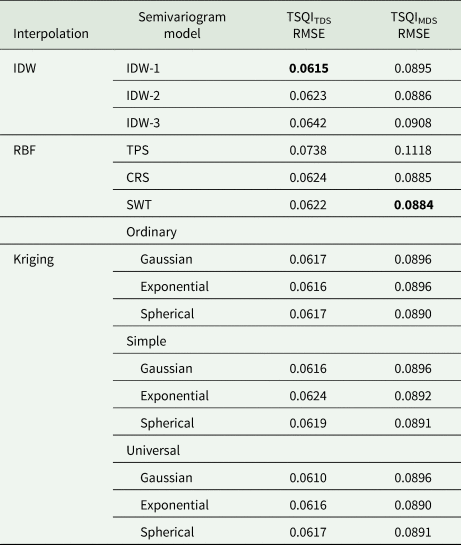
Bold number shows the lowest RMSE values for each semivariogram. RMSE, root mean squire error; IDW, invers distance weight; RBF, radial base function; TPS, thin plate spline; CRS, completely regularized spline; SWT, spline with tension; TSQITDS, tea soil quality index-total data set; TSQIMDS, tea soil quality index-minimum data set.
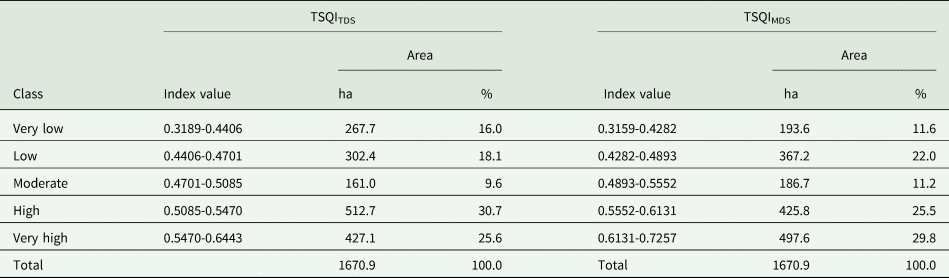
The spatial and proportional distributions of the TSQITDS and TSQIMDS indices and classes are shown in Table 7, and the maps are given in Fig. 4. Accordingly, the spatial distributions were quite similar between the TSQITDS and TSQIMDS indices. Low and very low-class areas constituted 34.1% of the total area in TSQITDS and 33.6% of the total area in TSQIMDS. Very high and high-class areas constituted 56.2% of the total area in TSQITDS and 55.3% of the total area in TSQIMDS. Also, nearly 10% of the study area had moderate class soil quality.
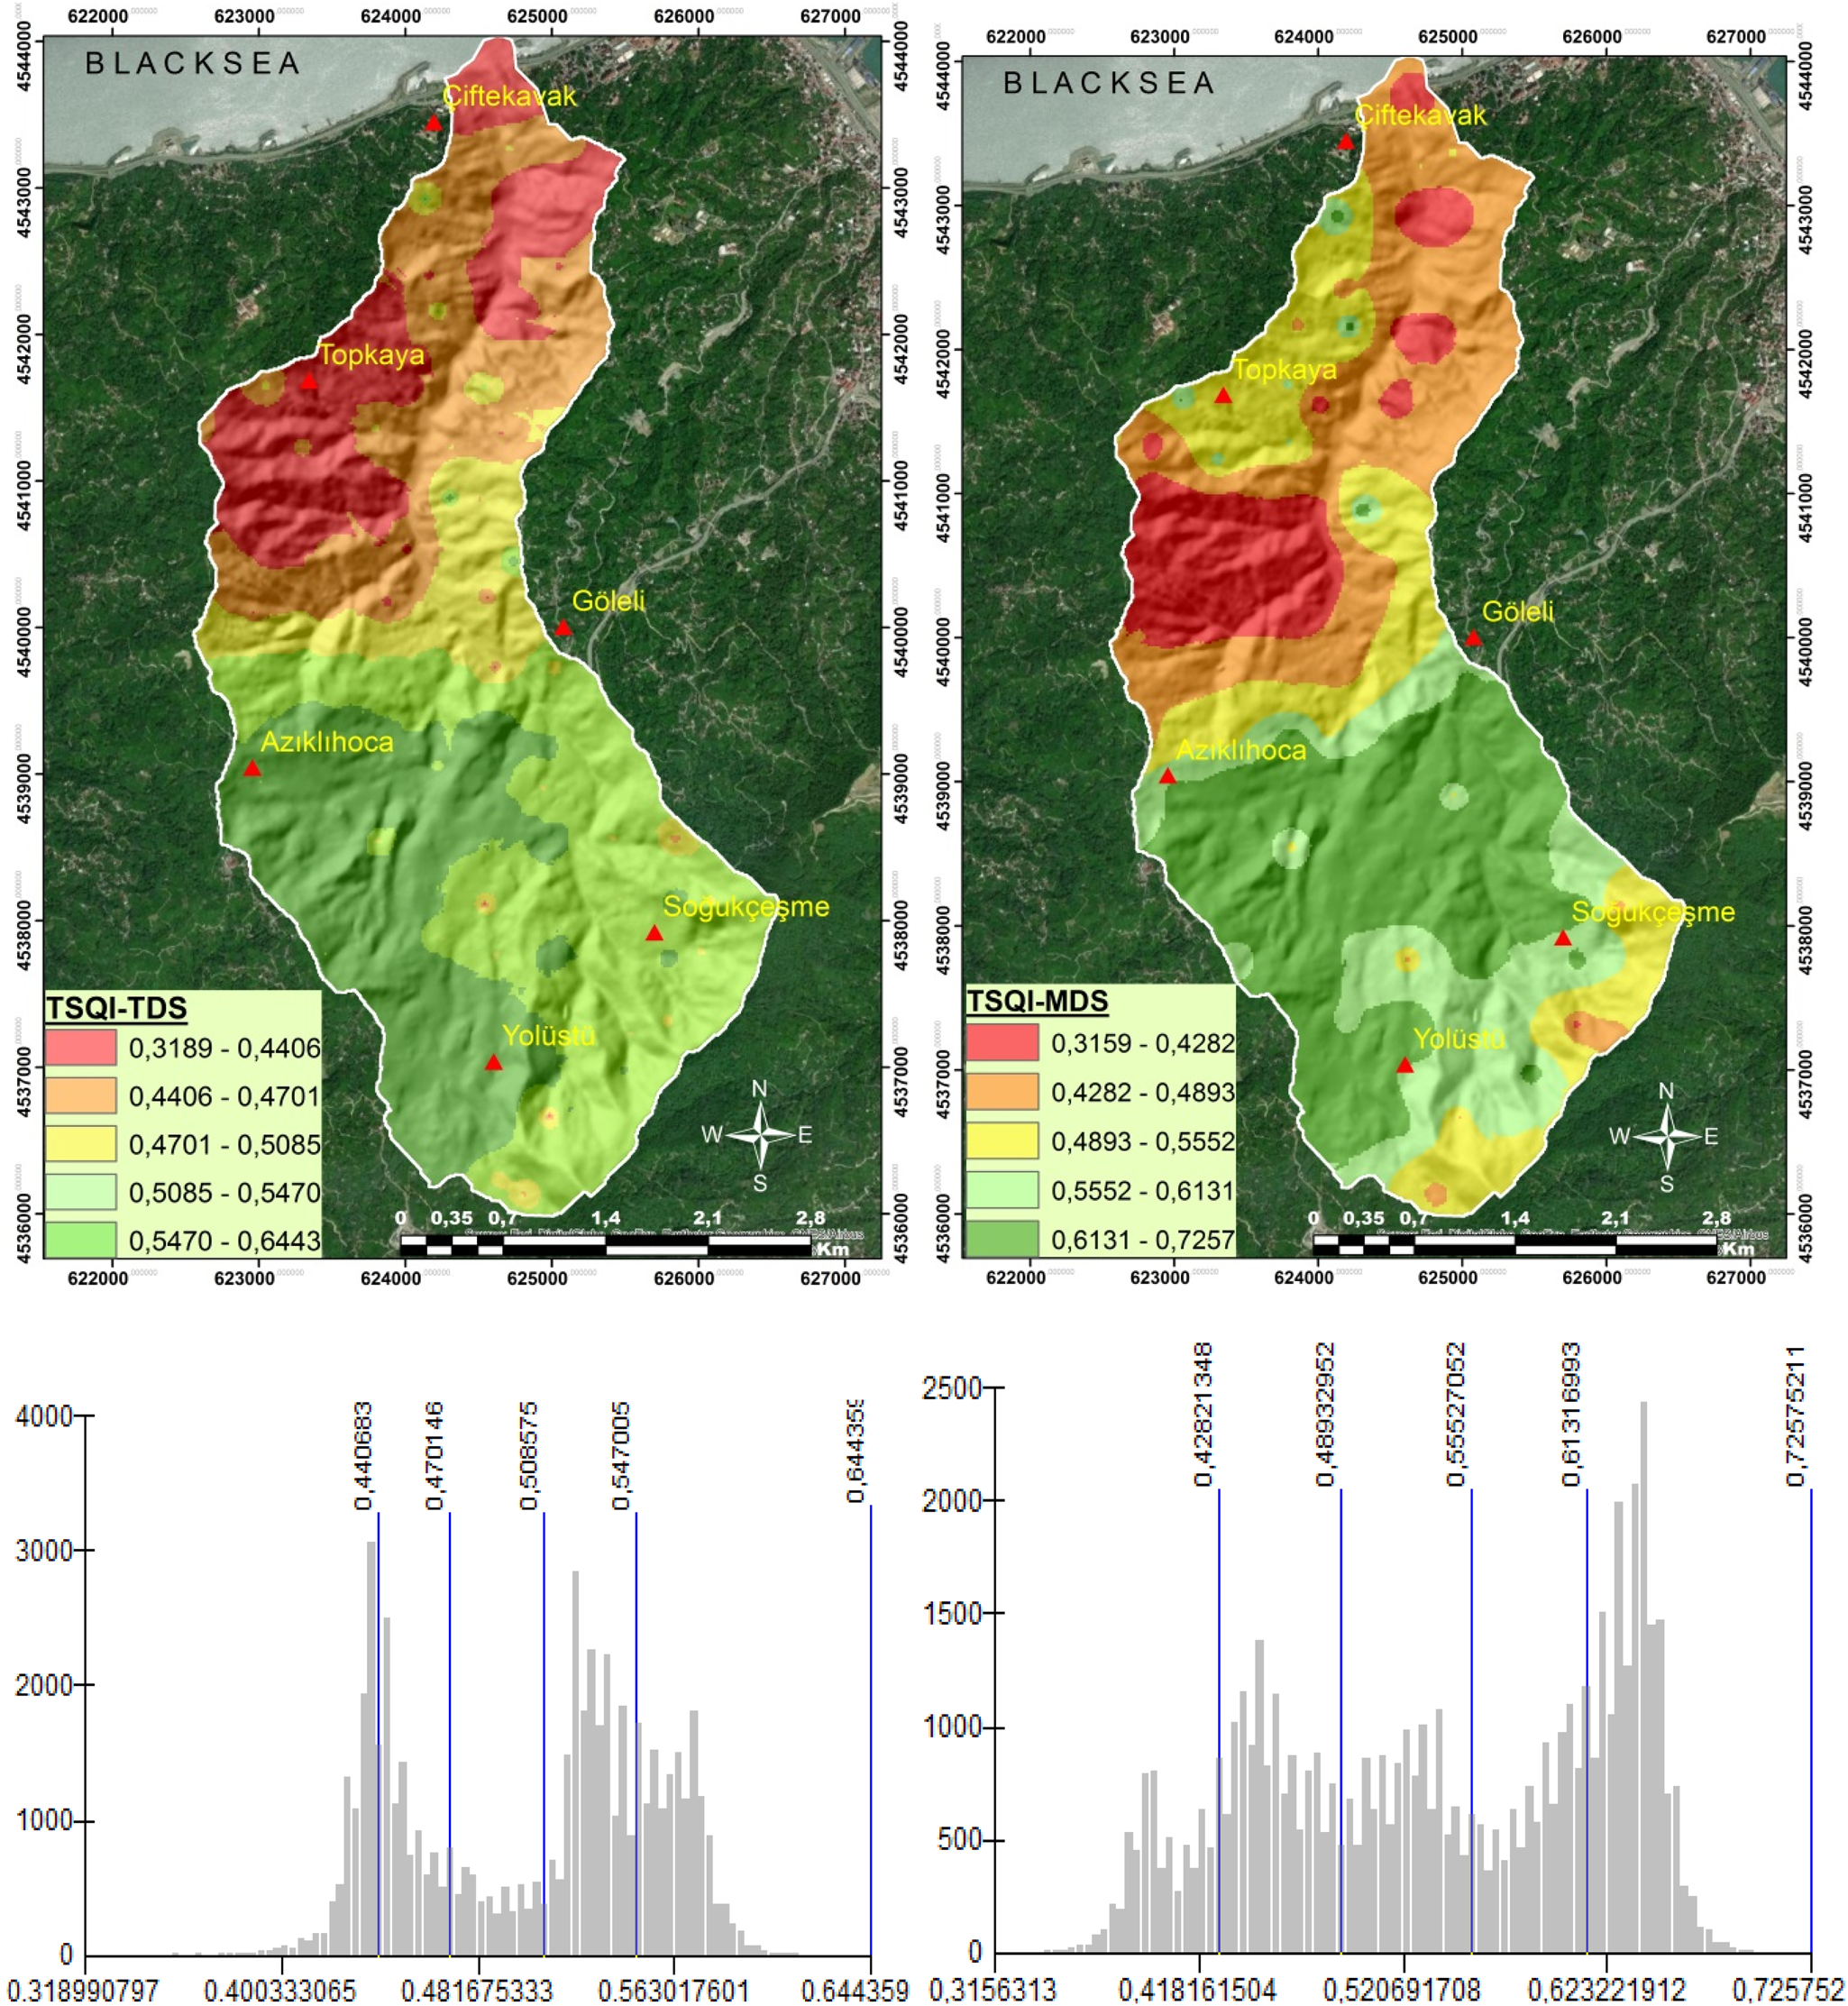
Fig. 4. Index values using natural breaks and spatial distribution maps of tea total dataset soil quality index (TSQITDS; left) and tea minimum dataset soil quality index (TSQIMDS; right).
Table 7. Spatial distribution of index values for TSQITDS and TSQIMDS in the study area
TSQITDS, Tea soil quality index-total data set; TSQIMDS, tea soil quality index-minimum data set.
Table 8 shows the descriptive statistics and T-test results for the soil quality indices obtained by assessing the two datasets. According to the total dataset with 35 indicators (TSQITDS), soil quality indices ranged from 0.3189 to 0.6443. 64.3% of the soil samples were very low and low class, and 49.0% were high and very high class. According to the minimum data set (TSQIMDS), soil quality indices ranged from 0.3159 to 0.7257. 45.1% of the soils were very low and low class, and 39.2% were very high and high class. In both datasets, nearly 16% of the total area was moderate class. The T-test performed to determine the significance of the difference between the two datasets showed a P-value of zero. Also, considering the correlation between TSQITDS and TSQIMDS by a Taylor diagram (Fig. 5), there was a statistically significant difference between the datasets, although the distribution maps showed a close pattern among the soil quality indices.
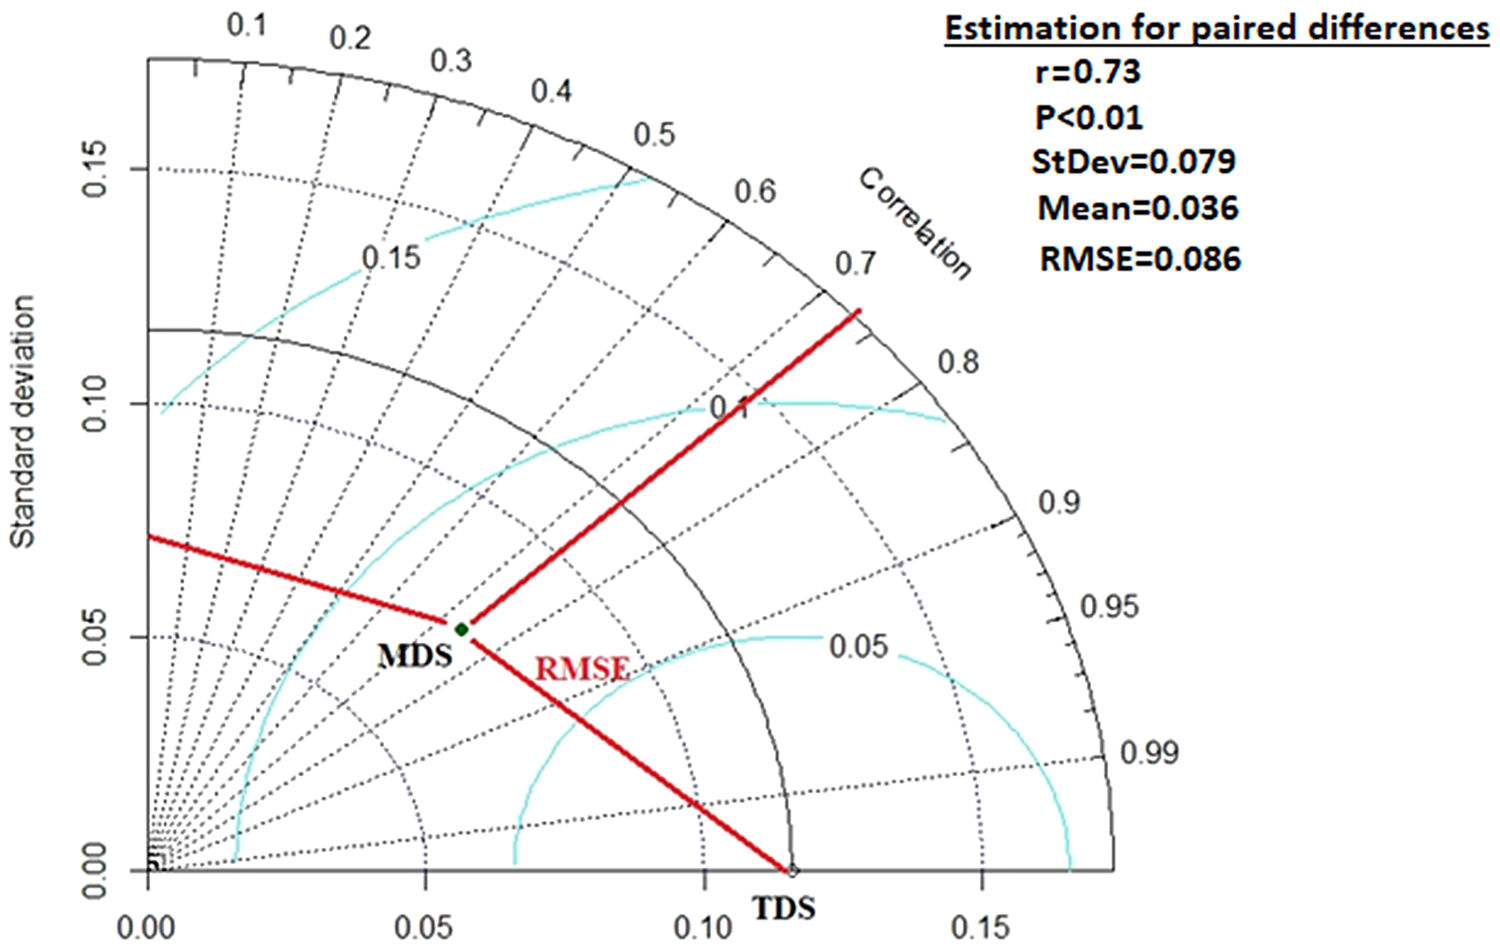
Fig. 5. Taylor diagram between total data set (TDS) and minimum data set (MDS).
Table 8. Results of T-test

TSQITDS, total data set of soil quality index for 35 indicators; TSQIMDS, minimum data set of soil quality index for 9 indicators; St. Dev., standard deviation.
Discussion
Soil is the basis of all agricultural production. Therefore, the first condition to obtain the desired amount and quality of a product is to increase soil fertility and quality. One of the most important factors for increasing soil fertility is plant nutrients; however, protecting the chemical, physical and biological content of the soil should not be ignored. In terms of soil properties, the tea plant likes acidic soils and shows optimum growth in soils with a pH of 5.0 to 6.0 and low in active lime content. It is adversely affected by acid or alkaline changes in soil pH and when it falls below 4, a product with the desired yield and quality cannot be obtained (Saygın et al., Reference Saygın, Gürsoy, Demirağ Turan and Dengiz2017). Physical and chemical properties that have been taken into consideration in the current study showed variability as a result of dynamic interactions among natural environmental factors (degree of soil development and leaching processing etc.) and human activities such as fertilization management. In the present study, soils were in the medium-fine and course texture group, and their texture classes were determined as sandy clay loam (SCL), loam (L), sandy loam (SL) and clay loam (CL). Mostly catchment soils have coarse texture therefore their FC and AWC values are low. Also, these findings are similar to those of a study conducted by Miháliková et al. (Reference Miháliková, Özyazıcı and Dengiz2016). Classification of studied soil properties was made according to Lindsay and Norvell (Reference Lindsay and Norvell1978); FAO (Reference Sillanpa1990); Arshad and Martin (Reference Arshad and Martin2002); Borůvka et al. (Reference Borůvka, Vacek and Jehlička2005); Hazelton and Murphy (Reference Hazelton and Murphy2016). The values of pH in soil samples slightly ranged between from strong acid to moderately soil reaction, whereas electrical conductivity had low values called as ‘non-saline’ soils. In addition, CaCO3 mean is less than 2% in all soil samples. Therefore, the CaCO3 content of the study area soils was classified as ‘limeless’ and ‘low limey’, OM content varied from ‘low’ to ‘high’. In addition, micro nutrient elements were found in sufficient amounts in some of the soil samples and their mean values. The pH of the soil solution maintained at acid condition showed high mobility of micro nutrient elements. Also, it could be attributed to the leaching of calcium carbonates at a very low concentration. Similar outcomes were reported in some few investigations such as Özyazıcı et al. (Reference Özyazıcı, Dengiz and Aydoğan2013), Saygın et al. (Reference Saygın, Gürsoy, Demirağ Turan and Dengiz2017), Bayraklı and Dengiz (Reference Bayraklı and Dengiz2020) carried out in the Black Sea region. As for macronutrient element of samples, available P and exchangeable K showed high variation between minimum and maximum values. Also, N contents of the soils are ‘low’, ‘sufficient’ and ‘high’, respectively and phosphorus was determined as ‘low’, ‘sufficient’, ‘high’ and ‘very high’ in the soils, respectively. Moreover, various microbial response parameters like MBC, basal respiration and metabolic quotient are often used to evaluate soil organic matter stabilization, soil aggregation and soil quality and monitor soil formation (Rogers and Li, Reference Rogers and Li1985). One of the most influential factors here is the activity of the microbial population for obtaining energy and nutrients like organic matter or organic carbon and N, P, K, Ca, Mg, etc. In the present study, MBC showed the highest variability in selected biological indicators.
To monitor soil quality status under long term cultivated tea farming, continuous monitoring of soil quality is crucial because it changes in response to environmental changes and human interventions. In addition, the tea field productivity is determined by soil fertility and management system, such as fertilization, land management, irrigation system and returning organic material from the crop residues after harvest to the field. Therefore, analysing soil quality status on tea areas in a micro-catchment of Rize province that applied the TSQI method as a viewpoint for decision-makers in soil quality and fertility management is necessary.
We investigated 35 bio-physical-chemical factors in told data set (TDS) to derive their quality indexes. It was also reported that using minimum data sets (MDS) to determine soil quality indicators gives the best results in terms of fewer costs, less workforce and higher data quality (Şenol et al., Reference Şenol, Alaboz, Demir and Dengiz2020). Hence, we created a MDS to reduce data redundancy and identify the optimal indicators. Thus, nine bio-physical-chemical properties were determined for MDS (sand, CF, ExCa, AvP, EO, CEC, soil depth, AvFe and MBS). The parameters for MDS and TDS both need to be weighted.
With multiple characteristics and a heterogeneous system, closely related physical, chemical, mineralogical and pedological properties, as well as individual characteristics, the soil is a complex system and its management should include all these aspects. Otherwise, irreversible mistakes can be made (Ferman and Skapura, Reference Ferman and Skapura1991). The efficient and sustainable use of soils is only possible by determining the limiting factors that affect productivity and the properties that affect sustainability using the appropriate methods. The traditional approach has been based on explaining or analysing certain properties and their fitness to various criteria using specific tools for each property and measuring the positive or negative dependent correlations between these properties. Even though fertilization programmes based on analysis were developed, this practice is not sufficient to maintain or improve plant productivity and production in its current form. Soil is a complex system with multiple variabilities. Evaluating the soil only in terms of nutrient content and ignoring other properties cannot ensure productivity or sustainability.
The AHP method, one of the widely used multi-criteria approaches, was considered for this operation's performance. The results explain why B1 (Physical) and B5 (Erodibility) had the highest values (Table 5). Soil texture is an unchangeable-hereditary property of soils. The amount and type of clay is a key soil property that affects the physical, chemical and even biological properties of soils. It has direct and indirect effects on the physical properties of soils like water-holding capacity, aggregate formation and permeability, as well as on their chemical properties like cation exchange capacity (Şenol et al., Reference Şenol, Alaboz, Demir and Dengiz2020). Dengiz and Sarıoğlu (Reference Dengiz and Sarıoğlu2013) also reported the amount and type of clay to be one of the main properties of soil quality criteria. Haghighi Fashi et al. (Reference Haghighi Fashi, Gorji and Sharifi2017) highlighted that this parameter had significant effects on soil compaction indicators like penetration resistance and bulk density, moisture level at field capacity and available water for the plant.
Most of the tea gardens in our study area are located on steep slopes. Also, this area has over 2300 mm of precipitation annually. Therefore, it is potentially at high risk for erosion as the soil surface is unprotected, especially during tea planting or management (regeneration-renewal). Hence, aggregate stability, dispersion ratio and other erosion susceptibility parameters were determined. Dengiz et al. (Reference Dengiz, İç, Saygın and İmamoğlu2020) reported a similar situation for the Orta Çay micro-catchment where tea cultivation is performed, using similar parameters to determine the erosion susceptibility of the soils due to the slopes and the lost or weakened vegetation due to improper practices. Karaca et al. (Reference Karaca, Dengiz, Demirağ Turan, Özkan, Dedeoğlu, Gülser, Sargin, Demirkaya and Ay2021) investigated the soil quality of pasture soils in a semi-arid ecosystem to determine erosion susceptibility due to overgrazing, especially in slopes. For this, the authors considered aggregate stability, dispersion ratio and crust formation as key indicators. Because, these factors have a more important role than other soil properties for plant growth, which is directly or indirectly affected by the risk of land degradation-desertification due to misapplications. Demirağ Turan et al. (Reference Demirağ Turan, Dengiz and Özkan2019) reported that intensive agricultural practices and improper land management, like overgrazing, particularly on slopes, were the main causes of soil degradation. The authors emphasized that such practices caused poor physical conditions: e.g., lower aggregate stability or erodibility factors like high dispersion ratio and crust formation, thus lowering resistance to erosion. Therefore, the physical soil quality indicator coded as B1 was detected the highest weighted value.
Within the B2 hierarchy (chemical), the OM content of soils has great importance and the highest value with its influence on biological and physiochemical soil properties (Table 5). This indicator is also involved in reducing erosion risks, storing and supplying nutrients, improving overall soil fertility and affecting cation exchange capacity. It can also be affected by soil and tea plant management practices. Alaboz et al. (Reference Alaboz, Işıldar, Müjdeci and Şenol2017) found that OM content was one of the most effective parameters for increasing aggregate formation, water-holding capacity, biological activity and productivity. Thus, it is well known that soil OM content is a significant indicator of both land productivity dynamics and terrestrial ecosystem functions. Another key chemical indicator within this hierarchy is soil reaction. The tea plant cannot grow well in strong acid conditions like pH<4 (Saygın et al., Reference Saygın, Gürsoy, Demirağ Turan and Dengiz2017), but some soil samples have a lower reaction than 4. Also, management practices like adding lime, regulating pH and fertilization and eliminating insufficient macronutrients or micronutrients have been applied to meet the requirements of the tea plant. EC was chosen as an indicator here as in most studies, but since there was no salinity problem in the study area, it had the lowest weight value in the B2 hierarchy (0.0539). The B1 and B5 hierarchies are more stable properties and are related to formation, but the B2, B3 and B4 hierarchies include the dynamic properties of the soil and are constantly changing. In the B3 hierarchy, the macronutrients total nitrogen and available phosphorus had the highest weight values. The tea gardens in this study were from the Acrisol-Alisol large soil group, which commonly had low base saturation capacity, with pH values less than 5. So, nitrogen fertilizers like calcium ammonium nitrate should be used as nitrogen fertilizers to prevent further increase in acidity.
In the B4 hierarchy (biology), MBC had a weight of 0.3400. Soil microorganisms are important for soil organic matter dynamics and for maintaining the pool of nutrients in the plant. Therefore, microbial properties like microbial biomass and respiration ratio are often used as sensitive indicators of ecosystem responses to soil stress and exogenous disturbance. Parameters like the ratio of biomass C to organic C (Anderson and Domsch, Reference Anderson and Domsch1989) and a metabolic fraction (qCO2) (the ratio of respiration to biomass) (Anderson and Domsch, Reference Anderson and Domsch1985) are useful when comparing different soil types because of increased soil organic ratio. The C content often increases microbial biomass C and respiratory ratio. Besides, the ratio of biomass C to organic C under steady-state conditions can be considered an indicator of C availability in soils (Insam and Domsch, Reference Insam and Domsch1988). qCO2 can indicate the relative effectiveness of soil microbes in the use of C (Anderson and Domsch, Reference Anderson and Domsch1993). A relatively low qCO2 value indicates a certain amount of metabolized organic carbon and a lower proportion of exhaled carbon so that the larger carbon is assimilated into MBC cells. Moreover, Islam and Weil (Reference Islam and Weil2000) report that in case of low qCO2, soil microorganisms wait for relatively labile carbon to exist and can allocate more resources for activities like the growth, degradation and recycling of plant nutrients, improving soil quality. Also, biological parameters are often used as indicators of microbial response to land degradation. Disturbed soils, rather than natural and undisturbed soils, are expected to display a relatively lower biomass C/organic C ratio and a higher qCO2. According to our findings, all samples had low qCO2 and high biomass C/organic C ratio, indicating that the micro-catchment was undisturbed.
After the consistency of the weighting process, we used a conventional scoring function approach to determine the score values for each indicator based on how well they relate to soil quality. Thus, weighted and scored values were combined using the WLC approach for each soil samples. In order to generate spatial distribution maps of TSQITDS and TSQIMDS geostatistical approach were applied. After this process, it was realized that the spatial distribution of TSQI values were quite similar between the TSQITDS and TSQIMDS indices. There was also a close pattern in the both maps. According to results, about one third of the total study area (TSQITDS and TSQIMDS) for has low and very low soil quality. These areas were mostly in the central and northern parts of the micro-catchment (Çifte Kavak and Topkaya). These areas had a strong acid reaction, coarse texture with very high sand content and low organic matter, resulting in low water-holding capacity, nutrient elements and poor biological activity, hence the low soil quality. Soils are a significant component of land management due to their decomposition of plant residues and their crucial role in the nutrient-water cycle (Karlen et al., Reference Karlen, Doran, Weinhold and Andrews2003). Therefore, organic waste applications (vermicompost, compost, barn manure, etc.) are suitable for increasing the organic matter levels in such areas with low quality. Many physical properties of soils are associated with texture, but some properties like bulk density and infiltration ratio can be affected by land and soil application systems (Bharati et al., Reference Bharati, Lee, Isenhart and Schults2002). On the other hand, more than half of the study area for TSQITDS and TSQIMDS is in very high and high soil quality classes. These areas were mostly in the middle and south-southeast parts. Additionally, the soil quality was in the moderate range in almost 10% of the research area.
Conclusion
The present research analysed the soil quality index of tea cultivation soils in a micro-catchment with long term intensive tea cultivation in Rize in the Eastern Black Sea Region under humid ecosystems. We took 102 representative soil samples from the micro-catchment, ensuring a near- homogeneous distribution. Considering their effects on the tea plant, 35 indicators were grouped according to 5 main criteria (physical, chemical and biological properties, nutrition status and erodibility). We applied a PCA to the soil quality index to evaluate the physical, chemical, productivity and biological parameters and then to determine the most important ones. Because, PCA is a useful tool that saves time and costs with its sampling and analysis and ensures practical, economical and reliable results under similar ecological conditions, removing certain SQI data from the list of factors and determining the most influential ones. Besides, we used the analytical hierarchical process, an important MCDA approach, to determine the contribution rates of these indicators for tea cultivation soils. In the current study, the soil quality classes were calculated using the TSQITDS and TSQIMDS approaches, and they showed statistical differences, though parallel spatial distributions. Over half of the soils in the study area had high to very high soil quality properties, and about one-third of the total area had low to very low soil quality. Low soil quality properties were particularly more common in the northern and north-western parts of the area, and soil quality tended to increase towards the south. Thus, in areas with low soil quality, some biophysical measures need to be taken to increase soil quality levels, such as creating an optimum growing environment for the tea plant by liming, applying an appropriate fertilization programme and increasing the soil's erosion resistance.
Consequentially, the following are this study's primary outcomes and strengths: (i) by combining SMCA, SSF, PCA, GIS and geostatistical approaches, the soil quality map for tea cultivation expanded the available planning possibilities, (ii) the study's facilitating the development thorough assistance for examining and evaluating soil quality for the production of tea, (iii) this present research will produce an important and practical strategic planning framework for humankind, land planning, agricultural land use planning and food security. Consideration and adoption of this strategy at the national level will result in notable enhancements in product efficiency and quality on the international market, (iv) this research can help farmers, tea growers and regional planners make better options and selection about where to plant tea and (v) The model developed in this study can be applied as a planning tool for tea cultivation in different study regions.
Furthermore, the soil quality assessment used here provides a useful decision- making approach to assist tea producers and decision-makers in evaluating soil fitness for the tea plant. In addition, socio-economic and cultural factors that allow for better decisions should also be considered when making final decisions.
Acknowledgement
This study was supported by Recep Tayyip Erdoğan University, BAP Unit as a Tea Specialization Project (Project No: CHIP 2020-1180). We would like to thank Recep Tayyip Erdoğan University for their support.
Author contributions
All authors contributed to the study conception and design. Methodology, Conceptualization and Resources were done by Fikret Saygın, Orhan Dengiz and Yusuf Şavşatlı. Supervision was performed by Orhan Dengiz, Kezban Yazıcı, Ayten Namlı. Material preparation, investigation and analysis were performed by Sena Pacci, Belkız Karapiçak, Abdurrahman Ay and Salih Demirkaya. All maps created by Fikret Saygin and Orhan Dengiz. The first draft of the manuscript was written by Orhan Dengiz, Yusuf Şavşatlı, Kezban Yazıcı, Nergiz Dila Şenol and Muhittin Onur Akça. All authors read, reviewed and approved the final manuscript.
Financial support
This research did not receive any specific grant from funding agencies in the public, commercial or not-for-profit sectors.
Conflict of interest
The authors declare that they have no known competing financial interests or personal relationships that could have appeared to influence the work reported in this paper.
Ethical standards
Not applicable.


