The metabolic syndrome is a cluster of interrelated symptoms including insulin resistance, central adiposity, hypertension, dyslipidaemia and hyperglycaemia(Reference Eckel, Alberti and Grundy1). These metabolic abnormalities are associated with an increased risk of developing type 2 diabetes mellitus(Reference Ford, Li and Sattar2) and poorer CVD outcomes(Reference Gami, Witt and Howard3,Reference Mottillo, Filion and Genest4) . An association between the metabolic syndrome and cognitive decline has also been suggested, although the evidence supporting this is weaker(Reference Atti, Valente and Iodice5). The global prevalence of the metabolic syndrome is estimated to be three times that of type 2 diabetes mellitus, with 1 billion people estimated to have the metabolic syndrome(Reference Ogurtsova, da Rocha Fernandes and Huang6).
Age is one risk factor for the metabolic syndrome(Reference DiBello, McGarvey and Kraft7–Reference Hassannejad, Kazemi and Sadeghi17). There is also a graded association between area-based deprivation and poorer health outcomes(Reference Exeter, Zhao and Crengle18) including the metabolic syndrome and its components(Reference Keita, Judd and Howard19). More modifiable risk factors include diet and physical activity(Reference Eckel, Alberti and Grundy1,Reference Rodriguez-Monforte, Sanchez and Barrio20) . The impact of dietary intake on the risk of non-communicable disease is well known. Accordingly, a low intake of whole grains, nuts and seeds, and fruit is one of the main dietary risk factors to which non-communicable disease in the Australasian region may be attributed(Reference Afshin, Sur and Fay21). Specifically, evidence also points to a diet high in fibre, and MUFA and PUFA, being protective against the metabolic syndrome(Reference Chen, Chen and Wang22,Reference Esposito, Marfella and Ciotola23) . However, diets contain combinations of foods and a dietary pattern approach can identify additive or synergistic effects of foods and nutrients on health outcomes in a way that a measurement of a single food or nutrient cannot(Reference Hu24).
Several meta-analyses have explored associations between a posteriori dietary patterns (determined using factor or cluster analysis, or reduced rank regression) and the metabolic syndrome. These meta-analyses had slightly different selection criteria but consistently found a posteriori dietary patterns containing food groups that would be considered unhealthy, had a pooled OR for the metabolic syndrome between 1·18 (95 % CI 1·08, 1·30) and 1·28 (95 % CI 1·17, 1·40) in cross-sectional studies(Reference Rodriguez-Monforte, Sanchez and Barrio20,Reference Fabiani, Naldini and Chiavarini25) or a relative risk of 1·29 (95 % CI 1·09, 1·52), representing moderate quality evidence, in cohort studies(Reference Jayedi, Soltani and Abdolshahi26). While associations between a posteriori dietary patterns containing healthy food groups and the metabolic syndrome reported a pooled OR for the metabolic syndrome between 0·83 (95 % CI 0·76, 0·90) and 0·86 (95 % CI 0·79, 0·91) in cross-sectional studies(Reference Rodriguez-Monforte, Sanchez and Barrio20,Reference Fabiani, Naldini and Chiavarini25) , the pooled evidence in cohort studies had a relative risk of 0·76 (95 % CI 0·50, 1·15) but was graded as low quality(Reference Jayedi, Soltani and Abdolshahi26). Meta-analyses further stratifying the data by geography and sex did not find associations between dietary patterns containing healthy food groups and the metabolic syndrome in Western cultures(Reference Rodriguez-Monforte, Sanchez and Barrio20,Reference Fabiani, Naldini and Chiavarini25) or in males(Reference Rodriguez-Monforte, Sanchez and Barrio20).
There has been only one study exploring dietary patterns and the metabolic syndrome in adults in the Australasia region – in Australia (n 2415, aged 45+ years)(Reference Bell, Edwards and Grieger27). A ‘healthy’ (whole grains, fresh and dried fruit, low-fat dairy products; and low in fried potatoes, alcohol and soft drinks) dietary pattern was positively associated with a metabolically healthy profile (OR = 1·16 (95 % CI 1·04, 1·29))(Reference Bell, Edwards and Grieger27). No associations were seen for ‘red meat and vegetable’ (OR = 0·99 (95 % CI 0·89, 1·10)) or ‘refined and processed’ (OR = 0·92 (95 % CI 0·81, 1·04)) dietary patterns and the metabolic syndrome(Reference Bell, Edwards and Grieger27).
Moreover, few studies internationally have been undertaken that were specific to the higher risk, older population. Studies have been conducted with adults older than 50 years (China, n 1006)(Reference Sun, Buys and Hills28) and populations with a mean age greater than 60 years(Reference Barbaresko, Siegert and Koch10,Reference Hailili, Chen and Tian29,Reference di Giuseppe, Plachta-Danielzik and Koch30) . These studies reported inverse associations between dietary patterns with healthy food groups and the metabolic syndrome. For example, a pattern containing red dates, gouji berries, dried fruit, nuts and grains in a Chinese population (Urumqi cohort, n 4265) was protective(Reference Hailili, Chen and Tian29), as was one high in fruit and vegetables and low in red and processed meats in a German cohort (n 853)(Reference di Giuseppe, Plachta-Danielzik and Koch30). In contrast, the metabolic syndrome was positively associated with dietary patterns containing milk tea but not yogurt in the Urumqi cohort(Reference Hailili, Chen and Tian29); legumes, beef, processed meat and bouillon in a German population (n 905)(Reference Barbaresko, Siegert and Koch10); and a ‘Western’ cluster (n 343) compared with a ‘healthy’ cluster (n 353) in an older Chinese population(Reference Sun, Buys and Hills28).
A posteriori dietary patterns are unique to a particular population. While dietary patterns have been identified in a representative sample of New Zealand adults(Reference Beck, Jones and Ullah31,Reference Steele, Eyles and Te Morenga32) , research is also needed to explore dietary patterns within specific subgroups of the population. Older adults living in New Zealand are likely to have different dietary patterns than younger adults due to cohort effects(Reference Beck, Jones and Ullah31) but will also differ from older adults in other countries due to the unique food supply and cultural elements of New Zealand. Moreover, it is necessary to examine associations between dietary patterns and diet-related health outcomes particularly as the risk of the metabolic syndrome increases with age. This study aims to examine associations between a posteriori dietary patterns and the metabolic syndrome in an older New Zealand population.
Methods
Study design and participants
This cross-sectional study includes participants from the REACH study (Researching Eating, Activity, and Cognitive Health) where the primary aim was to explore associations between dietary patterns and cognitive function(Reference Mumme, Conlon and von Hurst33). This secondary outcome explores the associations between those same dietary patterns and the metabolic syndrome in the older adult. A protocol and the methods describing the REACH study methodology were published earlier(Reference Mumme, von Hurst and Conlon34,Reference Mumme, Conlon and von Hurst35) . A convenience sample of community-dwelling adults (aged 65–74 years) throughout the wider Auckland region, New Zealand, were invited to participate. Exclusions were based on the primary outcome of the REACH study, that is, any factors affecting cognitive function(Reference Mumme, von Hurst and Conlon34). In addition, people were excluded if they came from the household of another REACH participant or had experienced any event in the past 2 years which had a substantial impact on dietary intake or cognitive function, for example, death or illness of a family member.
Signing of informed consent forms and data collection took place at the Human Nutrition Research Unit, Massey University, Auckland, New Zealand, from April 2018 to February 2019. During a single study visit, researchers collected health, demographic, lifestyle, physical activity, blood pressure, and anthropometric data, and a fasted blood sample. A FFQ was completed by participants at this visit(Reference Mumme, Conlon and von Hurst36). The sample size of 366 was based on the primary REACH outcome of cognitive function and not specifically this metabolic syndrome outcome(Reference Mumme, Conlon and von Hurst33). Funding was provided by the Health Research Council of New Zealand, Grant 17/566. Ethical approval was granted by Massey University Human Ethics Committee: Southern A, Application 17/69.
Anthropometric data and blood pressure
For the height, weight, and hip and waist circumference measurements, participants wore light clothing and no shoes. Height and weight were measured using a calibrated stadiometer and Tanita Electronic Scales. Waist and hip circumference were measured using a Lufkin W600PM flexible steel tape measure. Two measurements were taken for hip and waist. The mean value was used unless the second measurement differed by 1 cm or more from the first measurement. In this instance, a third measurement was taken and the median value used. The International Society for the Advancement of Kinanthropometry (ISAK) methods(Reference Marfell-Jones, Stewart and De Ridder37) were followed. Blood pressure was measured using a Digital Automatic Blood Pressure Monitor (Omron HEM-907). Participants rested quietly (seated) for 5 min before the first measurement, and there was a 1-min rest period before the second measurement. The mean blood pressure measurement was used unless either systolic or diastolic measurements differed by more than 5 mmHg from the first measurement. In this instance, a third measurement was taken, and the median value used. A whole-body scan using a dual energy X-ray absorptiometry (Hologic, Discovery QDR series) calibrated daily, measured muscle and fat mass, and calculated body fat %(Reference Hiol, von Hurst and Conlon38).
Blood sampling and analysis
A qualified phlebotomist drew a fasted blood sample at the research facility. Whole blood was used to measure fasting blood glucose (HemoCue Glucose 201RT), lipid profile (total cholesterol, TAG and HDL-cholesterol) and HbA1c (both using Cobas b101 system(39)).
Health, demographic and physical activity data
Health, demographic, lifestyle and physical activity information were obtained by written questionnaires during the study visit. Data were checked for completeness and plausibility. Any queries were followed up on the research day or within a few days by phone or email. Demographic data included age, sex, ethnicity, education (secondary, post-secondary and university), living situation (with others and alone), first language and residential address (for index of multiple deprivation score). Health data included past and current disease (acute and chronic), medication (list) and daytime sleepiness (how often are you excessively sleepy during the day? (never, rarely, frequently and often))(Reference Jaussent, Bouyer and Ancelin40). Lifestyle data included physical activity level, smoking history (no and yes (current and past)) and supplement use (list).
The New Zealand Indices of Multiple Deprivation and participant’s residential address determined the area deprivation score based on seven domains(Reference Exeter, Zhao and Crengle18). Polypharmacy was considered as five or more daily medicines(Reference Masnoon, Shakib and Kalisch-Ellett41). The International Physical Activity Questionnaire – short form(Reference Craig, Marshall and Sjöström42) was used to assess physical activity levels. A physical activity score was calculated using metabolic equivalent of a task (MET minutes) where1 min of activity is 3·3, 4·0 or 8·0 MET depending on an exercise level of walking, moderate or vigorous activity, respectively. One MET is equivalent to the rate of energy expended while at rest(Reference Craig, Marshall and Sjöström42).
The metabolic syndrome
The National Cholesterol Education Program Adult Treatment Panel III (NCEP-ATP III)(Reference Grundy, Cleeman and Daniels43,44) definition determined the metabolic syndrome within the REACH population. Based on this definition, the metabolic syndrome was present where three of the following five criteria were met: waist circumference ≥ 88 cm for women and ≥ 102 cm for men; a TAG level of ≥ 1·7 mmol/l; HDL-cholesterol level of < 1·03 mmol/l in men or < 1·3 mmol/l in women; blood pressure ≥ 130/85 mmHg; and fasting blood glucose ≥ 5·6 mmol/l or where medication was taken to control blood pressure, elevated TAG or low HDL-cholesterol(Reference Grundy, Cleeman and Daniels43).
Collection of dietary data
An online, validated 109-item FFQ(Reference Mumme, Conlon and von Hurst36) collected frequency and serving size data for foods eaten during the previous month. The FFQ had ten food categories and ten frequency response options ranging from ‘I never eat this food’ to ‘6 plus times per day’. For each participant and for each food item, a daily consumption quantity (g/d) was calculated. Missing values (< 1 % of all FFQ items) were imputed using the multiple imputation chained equations method and the mice package(Reference van Buuren and Groothuis-Oudshoorn45) with five imputations and twenty iterations (dietary pattern scores from each imputation were checked for robustness i.e. z-scores within 0·1 sd, and five imputed data sets were averaged for final dietary data set). Predictors used in the multiple imputation chained equations method were food items, age, sex, education and living situation. Each FFQ food item had a representative food allocated, so energy intake could be calculated using the New Zealand FOODfiles 2016 food composition database(46). Average daily energy intake was considered implausible if < 2100 kJ or > 14 700 kJ for women and < 3360 kJ or > 16 800 kJ for men(Reference Willett47). While data on supplement use were collected, it was not included in the data for dietary patterns.
Construction of dietary patterns
The food items from the FFQ were reduced to fifty-seven groups based on similarity of foods, culinary usage and a possible association with the primary outcome of the REACH study i.e. cognition(Reference Mumme, Conlon and von Hurst33) (online Supplementary Table 1). The Bartlett’s test of sphericity measured the presence of relationships within the data (P < 0·001), and the Kaiser–Meyer–Olkin (KMO) measured the sampling adequacy (KMO = 0·66). Both demonstrated the dietary data set was suitable for principal component analysis which reduces the diet components based on their correlations with one another while retaining as much variation within the diet as possible(Reference McCann, Marshall and Brasure48).
Using R, version 3.6.1(49), the psych package(Reference Revelle50) and varimax rotation, the data matrix of food groups (g/d, n 57) was analysed. Three dietary patterns (factors) were retained based on the scree plot, eigenvalue (> 1) and interpretability of the factors. Factor loadings measure the relative contribution (correlation) of a food group to a dietary pattern. Positive loadings contribute to a dietary pattern, while negative loadings have an inverse association with the dietary pattern. Food groups with factor loadings ≥ 0·30 or ≤ –0·30 are considered significant contributors to a pattern from a sample size of 300(Reference Stevens51). A standardised dietary pattern score was calculated per participant per dietary pattern using the regression method. Labelling of dietary patterns was based on highly correlated food groups and the type of dietary pattern those food groups characterised.
Statistical analysis
Statistical analysis was performed using R Studio(52), R version 3.6.1(49) and tidyverse (Reference Wickham, Averick and Bryan53). No data were transformed prior to statistical analysis.
Participant data, with a roughly symmetric distribution, were described with mean and standard deviation for continuous data or frequency summary statistics for categorical data. The Welch two-sample t test or Pearson χ 2 test was used to examine differences between the sexes and between participants with and without the metabolic syndrome for characteristic variables. Where categorical variables did not have adequate samples in each category, the Fisher’s exact test was applied. BMI and body fat % were categorised as follows: BMI (normal = 18·5–24·9, overweight = 25·0–30·0 and obese > 30·0 kg/m2)(54) and body fat % (obese is ≥ 30 % males and ≥ 42 % females)(Reference Gallagher, Heymsfield and Heo55).
Logistic regression analysis was used to examine the association between each dietary pattern score (independent variable) and the prevalence of the metabolic syndrome (dependent binary variable) while considering key confounding factors: age, sex, physical activity, index of multiple deprivation and energy intake. With an older population, an index of multiple deprivation was considered a better option to represent socio-economic status than income or education. The REACH population was homogenous in terms of ethnicity (primarily European), and this variable was excluded from further analysis. The first model was unadjusted and contained the metabolic syndrome and the dietary pattern scores (model 0). The second model included the confounding variables: age, sex, physical activity level, index of multiple deprivation, energy intake and other dietary pattern scores (model 1). OR and 95 % CI were calculated. Variables in the final regression model were checked for collinearity using the variance inflation factor(Reference Fox and Sanford56). The model showed no multicollinearity as no variables were above 5·0 (range 1·0 to 2·6).
To check for effect modifiers, interactions between dietary pattern scores (sex-specific tertiles where appropriate) and sex, index of multiple deprivation, BMI, body fat % and energy intake, and between sex and index of multiple deprivation, BMI, body fat % and energy intake were tested.
Results
Participant characteristics
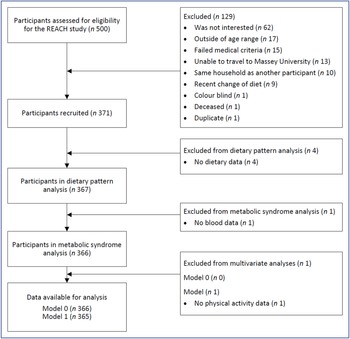
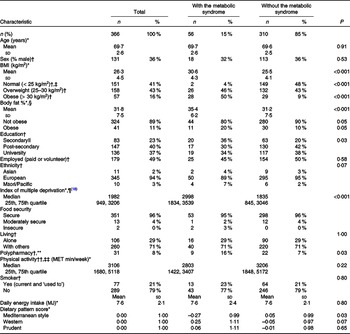
The REACH study recruited 371 participants. Fig. 1 describes the flow of participants through the study. All participants had plausible energy intakes. Five participants were removed from the analysis due to no dietary data (n 4) or no blood data (n 1). The characteristics of the remaining 366 participants are presented in Table 1. The prevalence of the metabolic syndrome was 15 % and not different between the sexes (males 14 %, females 16 %, P = 0·64). Those with the metabolic syndrome (n 56) had a higher BMI, a higher percentage of body fat, a higher level of deprivation, a lower ‘Mediterranean style’ dietary pattern score, a lower education (secondary level) and were more likely to take five or more medications per day than participants without the metabolic syndrome (Table 1). Differences between the sexes in participants with the metabolic syndrome were apparent. In those with the metabolic syndrome, females (when compared with males) who had a higher percentage of body fat (mean (sd) %, females 39 (4), males 28 (3), P < 0·001), though not a higher BMI (mean (sd) kg/m2, females 30 (5), males 31 (3), P = 0·55), were more likely to live alone (females 39 %, males 6 %, P = 0·02) and had a lower ‘Western’ dietary pattern score (P = 0·007). Overall, 16 % (n 57) were considered obese by BMI categories (> 30 kg/m2) and 11 % (n 41) by body fat % categories (≥ 30 % body fat (males) or ≥ 42 % body fat (females)) (Table 1).

Fig. 1. Flow chart of participants in the REACH (Researching Eating, Activity, and Cognitive Health) study.
Table 1. Characteristic of the REACH cohort and participants with and without the metabolic syndrome including differences
(Numbers and percentages; mean values and standard deviations; median values and 25th, 75th quartile)

REACH, Researching Eating, Activity, and Cognitive Health; MET, metabolic equivalent of task.
* Mean (standard deviation) or median (25th, 75th quartile), differences between those with and without the metabolic syndrome calculated using the Welch two-sample t test (continuous variables).
† n (%) differences between those with and without the metabolic syndrome calculated using Pearson χ 2 test or Fisher’s exact test (categorical variables).
‡ Includes three participants (one male, two female) with BMI < 18·5 kg/m2.
§ One value missing from female participant with the metabolic syndrome. Obese is body fat % ≥ 30 % (males) and ≥ 42 % (females)(Reference Gallagher, Heymsfield and Heo55).
|| For education, ‘no qualification’ (n 9) and ‘secondary’ (n 74) were aggregated, due to small numbers.
¶ Low score = least deprived, study range 11–5636, index of multiple deprivation range = 1–6181.
** Five or more medicines/d(Reference Masnoon, Shakib and Kalisch-Ellett41).
†† one value missing from participant without the metabolic syndrome.
‡‡ MET minutes/week based on 3·3 MET for walking, 4·0 MET for moderate activity and 8·0 MET for vigorous activity.
Of the fifty-six participants with the metabolic syndrome, fifty-five participants were identified based on physical criteria and one participant was identified based on medication to control lipids and a high waist circumference. All five metabolic syndrome criteria were seen in five participants, four criteria in eighteen and three criteria in thirty-three participants. The most prevalent metabolic criterion was high waist circumference (96 %), followed by high blood pressure (91 %), high TAG (74 %), low HDL-cholesterol (63 %) and high fasting blood glucose (26 %).
Dietary patterns
Three dietary patterns were derived from the 109-item FFQ which explained 18 % of the variation in dietary intake. Supplementary Table 2 displays the dietary pattern loadings, range of dietary pattern scores, eigenvalues and the variance explained by each dietary pattern.
Dietary pattern 1, named ‘Mediterranean style’, was characterised by salad vegetables, leafy cruciferous vegetables, other vegetables, avocados and olives, alliums, nuts and seeds, white fish and shellfish, oily fish, berries, water, salad dressings, cruciferous vegetables, eggs, cheese, tomatoes, and all other fruits. The ‘Mediterranean style’ dietary pattern scores were associated with higher β-carotene equivalents, vitamin E and folate intake (all P < 0·001, all R2 ≥ 0·26)(Reference Mumme, Conlon and von Hurst35).
Dietary pattern 2, named ‘prudent’, was characterised by dried legumes, soya-based foods, fresh and frozen legumes, whole grains, carrots, and spices. The ‘prudent’ dietary pattern scores were associated with higher fibre and carbohydrate intake (both P < 0·001, both R2 ≥ 0·25)(Reference Mumme, Conlon and von Hurst35).
Dietary pattern 3, named ‘Western’, was characterised by processed meats, sauces and condiments, cakes, biscuits, and puddings, meat pies and chips, processed fish, confectionery, vegetable oils, beer, chocolate, salad dressings, cheese, and sweetened cereal. The ‘Western’ dietary pattern scores were associated with higher daily energy intake (P < 0·001, R2 = 0·43)(Reference Mumme, Conlon and von Hurst35).
These dietary patterns have been validated with a subset of the REACH study participants (n 294)(Reference Mumme, Conlon and von Hurst36). The dietary pattern loadings obtained from the validation study subset were comparable to the full REACH cohort reported here. Tucker’s congruence coefficient (phi) between the loadings of the FFQ-derived dietary patterns (REACH validation subset v. REACH full cohort) were 0·96, 0·91 and 0·88 for ‘Mediterranean style’, ‘Western’ and ‘prudent’ patterns, respectively.
The metabolic syndrome and dietary pattern associations
No interactions between dietary patterns scores and sex, index of multiple deprivation, BMI, body fat %, and energy intake, and between sex and index of multiple deprivation, BMI, body fat % and energy intake were observed. In the base model (logistic regression analysis, model 0), the metabolic syndrome was inversely associated with the ‘Mediterranean style’ pattern score (OR = 0·71 (95 % CI 0·51, 0·96), P = 0·03), not associated with the ‘prudent’ pattern (OR = 1·08 (95 % CI 0·80, 1·40), P = 0·59) and positively associated with the ‘Western’ pattern score (OR = 1·32 (95 % CI 1·00, 1·73), P = 0·05) (Table 2).
Table 2. Results of logistic regression examining associations between the metabolic syndrome and dietary patterns
(Odds ratio and 95 % Confidence intervals)

* n 366.
† n 365, adjusted for dietary pattern scores, age, sex, physical activity, deprivation and energy intake; missing data: physical activity score (n 1, without the metabolic syndrome).
Model 1 included age, sex, physical activity, multiple deprivation and energy intake as confounders. The inverse association (model 0) between the ‘Mediterranean style’ pattern and the metabolic syndrome was attenuated in model 1 (P = 0·11). On further examination, this association was attenuated when either the multiple deprivation score or energy intake was added independently into model 1. The ‘prudent’ dietary pattern was not associated with the metabolic syndrome in model 1. However, the positive association between the ‘Western’ pattern and the metabolic syndrome strengthened (OR = 1·67 (95 % CI 1·08, 2·63), P = 0·02). Model 1 showed a higher deprivation predicted the metabolic syndrome, although the association was small (OR = 1·04 (95 % CI 1·02, 1·06), P < 0·001) (Table 2).
Sensitivity analysis
One outlying participant following the ‘prudent’ pattern had a standardised dietary pattern score of 8·31 (‘prudent’ score range of −2·49 to 8·31 (online Supplementary Table 2)). This participant consumed significant servings of carrots, peas, canned beans, brown rice and couscous each day but remained within our energy intake boundaries. A sensitivity analysis recalculated the OR of the association between the metabolic syndrome and the dietary patterns after removing this one participant. This had no effect on model 0 or model 1.
Discussion
A cross-sectional study of healthy, older (65–74 years), community-dwelling adults in Auckland, New Zealand, identified three a posteriori dietary patterns and explored their associations with the metabolic syndrome. The three valid(Reference Mumme, Conlon and von Hurst36) dietary patterns explained 18 % of the variation in the diet of the REACH cohort – ‘Mediterranean style’, ‘prudent’ and ‘Western’. The ‘Mediterranean style’ dietary pattern was inversely associated with the metabolic syndrome, but the association was no longer significant when confounders (age, sex, index of multiple deprivation, energy intake and physical activity) were added in model 1. The ‘prudent’ pattern was not associated with the metabolic syndrome in any statistical models. The ‘Western’ dietary pattern was positively associated with the metabolic syndrome, with age, sex, index of multiple deprivation, energy intake and physical activity included as possible confounders (model 1). Having a higher level of deprivation was positively associated with the metabolic syndrome.
The ‘Mediterranean style’ pattern shared similar components with the traditional Mediterranean diet, with foods such as vegetables, avocados, olives, tomatoes, nuts, seeds, oily fish, white fish, shellfish and berries(Reference Bach-Faig, Berry and Lairon57). The word ‘style’ was included in the name because New Zealand is not a Mediterranean country and not all elements of a Mediterranean diet are represented in this one pattern for example, olive oil is included in the food group ‘vegetable oils’ because of its similar culinary uses to other vegetable oils. The ‘Mediterranean style’ pattern was also similar to ‘healthy’ dietary patterns (consisting of vegetables, fruit, fish, poultry and whole grains) identified in recent meta-analyses(Reference Rodriguez-Monforte, Sanchez and Barrio20,Reference Fabiani, Naldini and Chiavarini25) . Mixed results, in both cross-sectional and cohort studies, are reported when it comes to associations between dietary patterns with these components and the metabolic syndrome(Reference Rodriguez-Monforte, Sanchez and Barrio20,Reference Fabiani, Naldini and Chiavarini25,Reference Jayedi, Soltani and Abdolshahi26) . The current study suggested that an increase of 1 sd in the ‘Mediterranean style’ dietary pattern score decreased the odds of having the metabolic syndrome by 29 %. However, the effects of multiple deprivation and energy intake independently attenuated the dietary pattern’s association in model 1, and it was difficult to separate the interplay between these variables and the ‘Mediterranean style’ pattern. This weak ‘Mediterranean style’ dietary pattern finding is still of value as it directs focus to associations between the metabolic syndrome, higher deprivation, higher energy intake (diet quantity) and the ‘Mediterranean style’ pattern (diet quality). Further observational studies should consider these variables.
Interestingly, the ‘prudent’ dietary pattern had no association with the metabolic syndrome, even though it shared components of the ‘healthy’ dietary patterns covered by meta-analyses, for example, vegetables and whole grains, though it lacked fruits, fish and poultry(Reference Rodriguez-Monforte, Sanchez and Barrio20,Reference Fabiani, Naldini and Chiavarini25) . This was surprising considering the high levels of fibre associated with this pattern and the protective effects of fibre on the metabolic syndrome(Reference Chen, Chen and Wang22,Reference McKeown, Meigs and Liu58) . However, this ‘prudent’ pattern did contain only a limited range of foods (legumes, carrots, whole grains and spices), and some of these food groups included processed foods such as canned baked beans, refried beans (dried legumes food group) and vegetarian sausages and burgers (soya-based foods food group) which may have blunted the beneficial effects of these food groups on health outcomes.
This study’s ‘Western’ pattern showed similarities to the ‘Western’ dietary patterns in other studies(Reference Rodriguez-Monforte, Sanchez and Barrio20,Reference Fabiani, Naldini and Chiavarini25) with common components such as processed meats, confectionery, chocolate, puddings and refined grains, though it also contained vegetable oils which may have been used for cooking, for example, frying red and processed meat. Unlike the ‘Mediterranean style’ dietary pattern, the ‘Western’ pattern maintained an association with the metabolic syndrome even when multiple deprivation and energy intake were held constant (model 1).
Cross-sectional and cohort studies support a positive association between a dietary pattern with components of unhealthy food groups and the metabolic syndrome(Reference Rodriguez-Monforte, Sanchez and Barrio20,Reference Fabiani, Naldini and Chiavarini25,Reference Jayedi, Soltani and Abdolshahi26) . In this current study, an increase of 1 sd in the ‘Western’ dietary pattern score increased the odds of the metabolic syndrome by 67 %. Of note was the wide CI which is consistent with an association as small as 8 % or as large as 163 %.
Other studies in older populations have found associations between dietary patterns and the metabolic syndrome. In a German population (n 853, mean age = 61 years), a ‘SELONOP’ dietary pattern (containing fruit, vegetables and antioxidant beverages) was inversely associated with the metabolic syndrome (OR = 0·54 (95 % CI 0·40, 0·73))(Reference di Giuseppe, Plachta-Danielzik and Koch30). ‘Traditional’ (containing rice, beans and oils)(Reference Noel, Newby and Ordovas59) and ‘legumes, beef, processed meat and bouillon’(Reference Barbaresko, Siegert and Koch10) dietary patterns were positively associated with the metabolic syndrome in Puerto Rican (n 1165, mean age of about 60 years, (OR = 1·70 (95 % CI 1·04, 2·70))) and German (n 905, mean age = 61 years, (OR = 1·71 (95 % CI 1·04, 2·79))) populations, respectively.
The prevalence rate for the metabolic syndrome in the current study was 15 %. This is in line with an earlier New Zealand study (35–74 years) that reported a prevalence rate of 16 % in an ‘Others’ (excludes Māori and Pacific but includes New Zealand European) population(Reference Gentles, Metcalf and Dyall8), although another New Zealand study found the prevalence of the metabolic syndrome in Europeans aged 60–79 years to be 22 % for males and 31 % for females(Reference Simmons and Thompson60). Both studies used the NCEP-ATP III definition. The differences in prevalence between this current study and that of Simmons and Thompson(Reference Simmons and Thompson60) may be due to markedly different deprivation levels – Simmons and Thompson(Reference Simmons and Thompson60) based their study in South Auckland which has higher levels of deprivation(61) than North Auckland where the current study was based. This again highlights the complex interplay between deprivation and the metabolic syndrome.
In the current study, the odds of the metabolic syndrome increased with deprivation. In the final model, holding all other variables constant, for each 100-point increase in deprivation (score range 1 to 6181) the odds of the metabolic syndrome increased between 2 and 6 %. This is not surprising; deprivation and chronic diseases such as the metabolic syndrome (and its components) are related(Reference Keita, Judd and Howard19,Reference Mirmiran, Bakhshi and Hosseinpour-Niazi62,Reference Matheson, White and Moineddin63) due to food insecurity, increased psychological stress(Reference Kuo, Bratzke and Oakley64), a healthy diet having a higher financial cost(Reference Darmon and Drewnowski65) and reduced access to primary medical care when cost is a barrier(Reference Jatrana and Crampton66), for example, in New Zealand, primary health care is subsidised but not fully paid for by the government. It is important to note that the index of multiple deprivation did not interact with any of the dietary patterns; therefore, living in an area of higher deprivation increased the risk of the metabolic syndrome regardless of the dietary pattern eaten.
The current study used a multiple deprivation index, an approach that is not commonly used in other studies examining the association between a posteriori dietary patterns and the metabolic syndrome. Sometimes, a socio-economic status indicator (based on combinations of education, income, occupation and household assets) have been included in other studies(Reference Hailili, Chen and Tian29,Reference Deshmukh-Taskar, O’Neil and Nicklas67,Reference Heidemann, Scheidt-Nave and Richter68) . While associations between the dietary patterns and the metabolic syndrome were reported in these studies, it is not known how the socio-economic status affected the association other than as a confounding variable. Our deprivation score is based on residential address, but this has limitations within our cohort, as several participants were living with family which may not accurately reflect their true socio-economic status.
In this current study, age, sex, physical activity and energy intake were not significant predictors of the metabolic syndrome. The narrow age range (10 years) in this study may not have provided sufficient variation to detect an association with the metabolic syndrome. The prevalence of the metabolic syndrome is steeper in females than males(Reference Pucci, Alcidi and Tap69). The driver behind this difference is an increase in abdominal obesity and a decrease in HDL-cholesterol levels in females after menopause(Reference Pucci, Alcidi and Tap69). Even so, there were no sex differences in the prevalence or as a predictor of the metabolic syndrome in this current study. Adding energy intake to the model attenuated the association between the ‘Mediterranean style’ dietary pattern and the metabolic syndrome to the point that it was no longer statistically significant. However, the association observed with the ‘Western’ pattern was retained, and in fact strengthened, suggesting the association resulted from the composition of the foods eaten, beyond just their energy content. Including energy intake as a possible confounder is important, though it is common for energy intake to be excluded from analyses(Reference Rodriguez-Monforte, Sanchez and Barrio20) leaving ambiguity about any true effect of a dietary pattern itself.
Two mechanisms with dietary patterns are strongly associated with the metabolic syndrome. The first acts through a persistent state of inflammation which is responsible for tissue and cell damage(Reference Nasef, Mehta and Ferguson70). Evidence suggests the diet is able to influence inflammation either through a positive effect of a Mediterranean diet(Reference Schwingshackl and Hoffmann71) or a negative effect of a Western dietary pattern(Reference Barbaresko, Koch and Schulze72). The second mechanism is through oxidative stress(Reference Liguori, Russo and Curcio73). Here, reactive oxygen species, a by-product of normal biochemical processes, are not neutralised due to insufficient antioxidants thus resulting in increased levels of plasma glucose, insulin and TAG(Reference Furukawa, Fujita and Shimabukuro74). The current study did not observe an association between the ‘Mediterranean style’ or ‘prudent’ pattern and the metabolic syndrome. However, the ‘Western’ dietary pattern consisted of pro-inflammatory food groups (including processed foods) and was low in fruit and vegetables (which provide antioxidants), which could contribute to the metabolic syndrome as described above.
Though BMI is recommended as an important confounder due to it being a well-defined risk factor for developing the metabolic syndrome(Reference Rodriguez-Monforte, Sanchez and Barrio20), BMI (and body fat %) were excluded as confounders in this study. Both BMI and body fat % were highly correlated with waist circumference which was one (of five) measure used to define the metabolic syndrome and considered to be in the causal pathway(Reference Hardy, Racette and Garvin75). In this older population, waist circumference was the most prevalent component of the metabolic syndrome followed closely by hypertension, as has been reported by others(Reference Barbaresko, Siegert and Koch10,Reference Simmons and Thompson60) . This can be expected as increasing central obesity and hypertension are both associated with age(Reference Jayedi, Soltani and Zargar76,Reference Lloyd-Jones, Evans and Larson77) .
This study has several strengths. To our knowledge, this is the first study in an older New Zealand population to explore associations between dietary patterns and the metabolic syndrome. A full set of confounders was used in the analyses. Validated tools were used to collect physical activity and dietary data which produced robust dietary patterns(Reference Mumme, Conlon and von Hurst36) specific to our study population.
However, the findings of this current study also have limitations. First, the New Zealand has population groups with high prevalence of the metabolic syndrome – 32 % of Māori and 39 % of Pacific people(Reference Gentles, Metcalf and Dyall8). Our sampling did not capture these population groups; hence, our findings are not representative of the New Zealand population overall. In addition, our participants were self-selecting and more likely to be ‘health motivated’. This study reports a secondary outcome of the REACH study, and an a priori power calculation was not calculated for a metabolic syndrome outcome; therefore, our findings may not have statistical power. Despite the FFQ being validated, there remains inherent measurement errors associated with assessing dietary intake with any method used. It was also assumed that the current dietary data collected was the usual diet for our participants. Finally, this study is cross-sectional and while known potential confounders were adjusted for, we cannot infer a particular dietary pattern has a causal effect on the metabolic syndrome.
Conclusion
In an older New Zealand population group of primarily European adults, the ‘Western’ dietary pattern, explaining 6 % of the variation in the diet, was positively associated with the metabolic syndrome. Also, of importance, was the observed positive association between higher deprivation and the metabolic syndrome, and future research should consider deprivation as a confounder. However, these results cannot be applied to the New Zealand population in general. Further observational studies in a larger representative sample of the New Zealand older population, including Māori and Pacific people, and those with higher deprivation may identify further associations with a dietary pattern with healthy or unhealthy food groups. The current study provides further support for a Western dietary pattern being a risk factor for the metabolic syndrome in older people, an understudied population group.
Acknowledgements
We thank the REACH participants and the REACH team, including Nicola Gillies, Harriet Guy, Anne Hiol and Angela Yu for assistance with data collection.
This work was supported by the Health Research Council of New Zealand (Grant 17/566). The Health Research Council had no role in the design, analysis or writing of this article.
The authors’ contributions were as follows: K. L. B., C. C., P. R.von H., B. J., C. F. H-R., W. S., A-L. H. and J. C. conceived, designed and acquired funding for the research; K. L. B., C. C., P. R. von H., K. D. M., C. S. and O. M. conducted the research and collected data; K. D. M., K. L. B., J. V. de S. and B. J. performed analyses and interpreted the results; K. D. M. wrote the first draft of the manuscript; K. L. B., C. C., P. R. von H. and K. D. M. critically reviewed and edited for final content. All authors have read and approved the final manuscript.
The authors declare no conflict of interests.
Supplementary material
For supplementary material/s referred to in this article, please visit https://doi.org/10.1017/S0007114521004682