


Globally, mental illness is a significant cause of disability and represents a major component of healthcare cost, and the personal and economic impacts are projected to increase substantially over the next 15 years(Reference Bloom, Cafiero and Jané-Llopis1). The global cost of mental illness in 2010 was estimated to be US$2·5 trillion. These costs are expected to more than double by 2030 to over US$6 trillion. In 2012, the WHO estimated that 350 million people globally suffered from depression(2). In Australia, poor mental health is also a significant public health issue. In 2007, the prevalence of depressive episodes was estimated at 4·1 % in Australian men and women(Reference Slade, Johnston and Oakley Browne3), and anxiety and depression represented 4·8 % of the burden of disease for men and 10 % for women(4). In women, anxiety and depression was the primary burden of disease and in men it ranked third(4).
The world’s population is ageing, and the WHO estimated that the number of people aged over 60 years will increase from 900 million in 2015 to over 2 billion in 2050(5). This together with the projected doubling of health costs associated with mental illness in the general population makes understanding the causes of diseases such as depression in older adults increasingly important(Reference Bloom, Cafiero and Jané-Llopis1). Cross-sectionally, depression has been shown to have a significant association with self-rated successful ageing(Reference Jeste, Depp and Vahia6,Reference Jeste, Savla and Thompson7) .
Epidemiological studies have identified that diet may play an important role in mental health and depression(Reference Martínez-González and Sánchez-Villegas8). Increasingly, dietary patterns are being used to examine the association between diet and health and disease. This approach acknowledges that food are consumed in complex combinations and that it is important that a balance is maintained across the total intake of food(Reference Hu9,Reference Kant10) . A number of cross-sectional and longitudinal studies have previously reported that a healthy dietary pattern has been associated with lower levels of depressive symptoms in the general adult population aged from 21 years(Reference Akbaraly, Brunner and Ferrie11–Reference Suzuki, Miyaki and Tsutsumi20). Two cohort studies focused specifically on older adults (age 65+ years) and reported mixed findings(Reference Skarupski, Tangney and Li12,Reference Chan, Chan and Woo13) . In a sample of community-dwelling adults aged 65+ years, adherence to a Mediterranean diet was associated with a reduced likelihood of developing depressive symptoms after 7 years’ follow-up(Reference Skarupski, Tangney and Li12). In a sample of community-dwelling elderly Chinese aged 65+ years, no association was found between the three dietary patterns (‘vegetables–fruits’, ‘snack–drinks–milk products’, ‘meat–fish’) and development of depressive symptoms after 4 years(Reference Chan, Chan and Woo13). In Denmark, a longitudinal study of over 30 years conducted among adults aged 50–80 years found an increase in depressive symptoms from age 60 years(Reference Barefoot, Mortensen and Helms21). The studies that have only examined a population aged 65+ years may have missed the period when changes to depressive symptoms occur. Examining a population prior to age 65 years may therefore be important as it may include the age when changes to depressive symptoms occur.
Findings from recent systematic reviews of observational studies examining association between dietary patterns and depression have been mixed, with two systematic reviews reporting evidence of an association between a healthy or Mediterranean dietary pattern and reduced prevalence of depression(Reference Rahe, Unrath and Berger22,Reference Sanhueza, Ryan and Foxcroft23) , while another systematic review reported limited evidence for an association(Reference Quirk, Williams and O’Neil24). Additional studies are required to determine whether dietary patterns are associated with depressive symptoms.
To date, studies focusing on older adults have examined population from 65 years. These studies may have excluded the decade prior to age 65 years when changes to depressive symptoms may be occurring. Understanding these associations is important as this knowledge can inform the development of evidence-based, appropriately timed dietary strategies to prevent poor mental health. The present study aims to examine the association between current and past dietary patterns and depression in a community-dwelling population of men and women aged 55 years and over.
Methods
The present study is based on data collected in the Wellbeing, Eating and Exercise for a Long Life (WELL) study, a longitudinal cohort study conducted in Victoria, Australia, which focused on examining nutrition and physical activity (PA) behaviours in adults >55 years and is described in detail elsewhere(Reference McNaughton, Crawford and Ball25). Data were collected using self-administered, postal questionnaires at baseline in 2010 (T1), 2012 (T2) and 2014 (T3). The WELL study was approved by the Deakin University Human Research Ethics Committee (2009-105). The present study examines cross-sectional associations between current dietary patterns and depressive symptoms at T3 and longitudinal association of past dietary patterns at T1 and depressive symptoms at T3.
Participants and procedure
Participants aged 55–65 years at baseline in 2010 (T1) living in the community in urban and rural Victoria were selected from the Australian Electoral Commission’s electoral roll using a stratified random sampling process(Reference McNaughton, Crawford and Ball25). Suburbs in Victoria were classified as urban or rural, and as a low, medium or high socio-economic area using the Socioeconomic Index for Areas score determined by the Australian Bureau of Statistics(26). Suburbs with a population of under 1000 residents or suburbs with fewer than 200 inhabitants of 55 to 65 years old were excluded. Fourteen suburbs from each socio-economic tertile in both urban and rural areas were randomly selected (n 84) and 134 participants (equal men and women) were then randomly selected. Participants were invited to participate and sent a survey and a reply-paid envelope at T1. Two reminder letters were sent after 3 weeks and 6 weeks to encourage participation, with the second reminder letter including a new survey, consistent with the recommended protocols(Reference Hoddinott and Bass27). Participation was voluntary and informed consent was obtained with return of the survey. A total of 11 256 invitations were sent at T1. Of these, 380 were returned as undeliverable and ninety-five were returned from individuals outside the age bracket. Responses were received from 4082 participants at T1. In 2014 (T3), participants who agreed to take part in follow-up were contacted again using the same methods, obtaining 2542 participant responses.
Measures
Dietary intake. Dietary intake was assessed at T1 and T3 using a 111-item FFQ adapted from previous National Nutritional Surveys(Reference McNaughton, Crawford and Ball25,Reference McLennan and Podger28) . The FFQ assessed frequency of food and beverage intake over the previous 6 months across nine response options (never or less than once per month, 1–3 times/month, once/week, 2–4 times per week, 5–6 times/week, once/d, 2–3 times/d, 4–5 times/d or 6 or more times/d). Information on portion size was not collected(Reference McLennan and Podger28).
Depressive symptoms. Self-reported depressive symptoms were assessed at T3 using the short-form fifteen-item Geriatric Depression Scale (GDS)(Reference Wancata, Alexandrowicz and Marquart29,Reference Yesavage, Brink and Rose30) . Completion of the GDS requires the participants to answer yes or no to fifteen questions in the survey. Questions include ‘Are you basically satisfied with your life?’ and ‘Are you afraid that something bad is going to happen to you?’ Participants receive a score of 1 for each item they respond, which is consistent with depression. The scores of all questions are summed for a total score ranging from 0 to 15, with higher scores indicating greater depressive symptoms. A GDS score of 11 or greater may be an indicator of depression(Reference Sheikh and Yesavage31). A systematic review of the GDS found it to be a valid screening method for depression in older adults when compared against the Diagnostic and Statistical Manual of Mental Disorders, 4th edition (DSM-IV)(Reference Wancata, Alexandrowicz and Marquart29).
Covariates. Potential covariates included age, sex, BMI, PA, smoking status, relationship status, education and working status. Relationship status was categorised as living with a partner or without a partner. The ‘with a partner’ category included participants living in a marriage or de facto relationship. The ‘without a partner’ category included participants separated, divorced, widowed and never married. Education was categorised as up to year 10, year 12/trade/diploma and university degree. Working status was categorised as retired or working.
Health and lifestyle-related factors including weight, height, PA, smoking status and pain were also considered as potential covariates. Self-reported weight and height were used to determine BMI (calculated as weight in kg/height in m2). Leisure time PA (LTPA) was collected using the International Physical Activity Questionnaire (IPAQ). LTPA has shown a stronger association with likelihood of depression compared with other PA domains(Reference Teychenne, Ball and Salmon32). The IPAQ collects information on PA including occupation activity, transport-related activity, yard/garden activity, household activity, leisure activity and sitting(Reference Craig, Marshall and Sjostrom33). The leisure component of the IPAQ includes recreation, sport, exercise and leisure PA. This was used to calculate LTPA by converting the duration and intensity of these leisure time activities to metabolic equivalent of task. Smoking status was categorised as never smoked, previous smoker or current smoker. Self-reported body pain was assessed using the pain subscale from the RAND thirty-six-item Short Form Health Survey(Reference Hays and Morales34). The summative method of calculating the mean of the items was used to calculate the pain subscale as previously described(Reference Milte, Thorpe and Crawford35).
Statistical analysis
Dietary patterns at T1 were determined using principal component analysis (PCA) with Stata (version 12.0; StataCorp) and their derivation has been described in detail elsewhere(Reference Thorpe, Milte and Crawford36). Briefly, the 111 FFQ items were converted into daily equivalent frequencies and combined into fifty-two food groups, which were used in PCA to provide factor solutions to identify the most significant dietary patterns. Factors were determined using the eigenvalues (>1·0) and a break in the scree plot. The factors were orthogonally rotated to simplify the factor structure and enhance their interpretability. Factor scores for each dietary pattern were calculated using the frequency of consumption, with a factor loading of ≥0·2 for food groups. Dietary pattern scores at T3 were determined using the frequency of consumption at T3, with factor loadings fixed from T1(Reference McNaughton, Ball and Crawford37).
All other statistical analyses were conducted using SPSS (version 22; SPSS Inc.). Participant characteristics were summarised using descriptive statistics. Differences in characteristics between men and women were assessed using t tests for continuous variables and χ 2 for categorical variables. Relationships between potential covariates (age, BMI, LTPA, pain, sex, retirement status, smoking status, relationship status and education), each individual dietary pattern and GDS score were assessed using correlation for continuous variables and ANOVA or t test for categorical variables. Potential covariates that were significantly associated with both dietary patterns and GDS score were included in the adjusted analysis when performing the mixed model analysis.
A mixed model analysis was performed with a random intercept for postcode to investigate cross-sectional association between current dietary patterns (T3) and GDS score (T3) and longitudinal association between past dietary patterns (T1) and GDS score (T3). Two models were completed for each dietary pattern; a crude analysis with the dietary pattern and GDS score only and an ‘adjusted’ analysis including all relevant covariates as described above. Only participants that participated at T1 and T3 and with complete data, including covariates, were included in the analysis. P < 0·05 was considered statistically significant.
Results
A total of 2142 participants had complete data for analysis. No difference in age, GDS score, BMI and LTPA was observed between men and women (Table 1). Of the participants, 1·3 % had a GDS score of 11 or above, indicating potential depression, and the remaining 98·7 % of participants indicating no depression. Compared with men, women reported a lower RAND thirty-six-item Short Form Health Survey pain score, higher rates of non-smokers, higher rates of education to year 10 and university levels and higher reported levels of retirement. Men reported higher smoker and ex-smoker status, more participants with year 12/trade/diploma-level education and more participants were partnered compared with women.
Table 1. Characteristics of participants in the Wellbeing, Eating and Exercise for a Long Life (WELL) study at T3 (2014)
(Mean values and standard deviations; numbers and percentages)
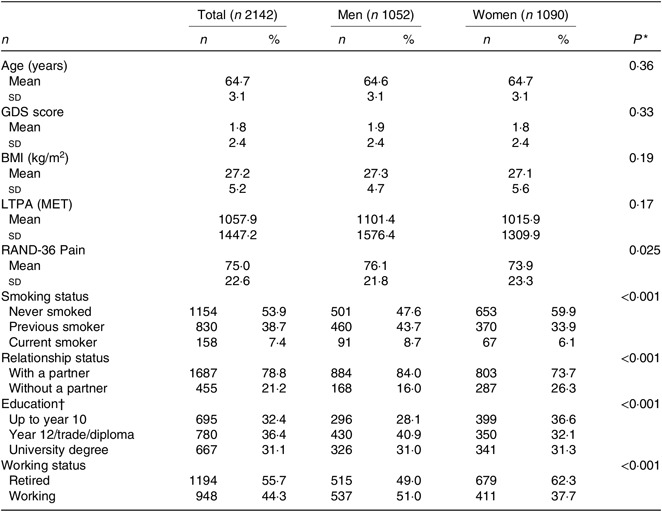
GDS, Geriatric Depression Scale; LTPA, leisure-time physical activity; MET, metabolic equivalent of task; RAND-36, RAND thirty-six-item Short Form Health Survey.
* P values are comparing men and women.
† Data for education were reported at T1.
The dietary patterns used in the present study have been previously determined and described in detail(Reference Thorpe, Milte and Crawford36). Briefly, healthy and unhealthy dietary patterns were identified in 2010 (T1) in men and women using PCA. In men, the healthy dietary pattern was characterised by frequent consumption of vegetables, fish and other seafood, oil and vinegar salad dressings, rice, legumes and beans, cottage or ricotta cheese and fruits. The unhealthy dietary pattern was characterised by red, processed and cured meat, pizza or hamburgers, white bread, fried or battered fish, high-energy drinks, hot chips or roast potatoes and muesli or porridge. In women, the healthy dietary pattern was characterised by vegetables, fruits, fish, legumes and beans and the unhealthy dietary pattern was characterised by red and processed meat, white bread and high-sugar products(Reference Thorpe, Milte and Crawford36).
Cross-sectional association between dietary patterns and depressive symptoms
In women, the current dietary patterns were significantly associated with depressive symptoms in both the crude and adjusted analyses (Table 2). Frequent consumption of a healthy dietary pattern was associated with lower levels of depressive symptoms (β = −0·260, 95 % CI −0·451, −0·070), while frequent consumption of an unhealthy dietary pattern was associated with higher levels of depressive symptoms (β = 1·367, 95 % CI 0·679, 2·056). In men, no association was seen between the current unhealthy dietary pattern and levels of depressive symptoms in both the crude and adjusted analyses. In men, an association was seen between higher scores for the healthy dietary pattern and lower levels of depressive symptoms in the crude analysis (β −0·227, 95 % CI −0·428, −0·025), but this association did not remain significant in the adjusted model.
Table 2. Association of current T3 (2014) and past T1 (2010) dietary patterns and depressive symptoms at T3 (2014) assessed by linear mixed models for men and women
(β-Coefficients and 95 % confidence intervals)
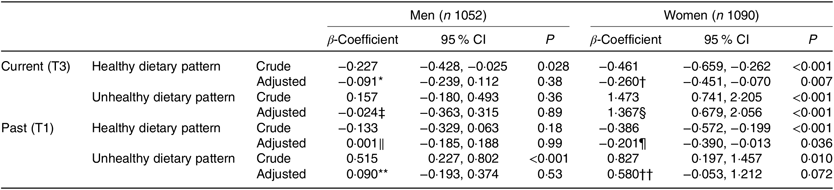
LTPA, leisure-time physical activity.
* Adjusted for age, LTPA, smoking status, relationship status and education.
† Adjusted for age, BMI, LTPA, pain, smoking status and education.
‡ Adjusted for age, smoking status and education.
§ Adjusted for age, LTPA, pain, relationship status and education.
║ Adjusted for age, LTPA, pain, smoking status and education.
¶ Adjusted for age, BMI, LTPA, smoking status and education.
** Adjusted for age, BMI, LTPA, pain, retirement status, smoking status and education.
†† Adjusted for age, LTPA, relationship status and education.
Associations between dietary patterns and depressive symptoms at 3 years
In women, higher scores for the past healthy dietary pattern were associated with lower levels of depressive symptoms at 3 years after adjustment for relevant covariates (β = −0·201, 95 % CI −0·390, −0·013). Higher scores for the past unhealthy dietary pattern were found to be associated with higher levels of depressive symptoms in women (β = 0·827, 95 % CI 0·197, 1·457); however, the association was NS in the adjusted model. In men, a higher score for the past unhealthy dietary pattern was found to be associated with higher levels of depressive symptoms in the crude analysis (β = 0·515, 95 % CI 0·227, 0·802); however, this association was not seen when adjusted for covariates. In men, no other association was found between past dietary patterns and depressive symptoms in the crude and adjusted analyses.
Discussion
The aim of the present study was to examine the relationship between dietary patterns and depressive symptoms in a community-dwelling adult population of older men and women aged 55 years and over. In women, current and past healthy dietary patterns were associated with lower levels of depressive symptoms and a current unhealthy dietary pattern was associated with higher levels of depressive symptoms. In men, no association was found between dietary patterns and depressive symptoms.
Previous studies have shown similar association between a healthy or prudent diet and depressive symptoms. Suzuki et al.’s cross-sectional study undertaken in Japan (age 21–65 years, n 2266) found a ‘balanced Japanese diet’, identified using factor analysis, including high dietary intake of vegetables, particularly carrots, pumpkin mushrooms and seaweed, was associated with lower levels of depressive symptoms(Reference Suzuki, Miyaki and Tsutsumi20). This pattern is similar to the healthy dietary patterns identified in the present study in that vegetables were the primary component of the pattern. Three prospective cohort studies have examined the association between the Mediterranean diet using the MedDietScore(Reference Panagiotakos, Milias and Pitsavos38,Reference Trichopoulou, Costacou and Bamia39) and the development of depressive symptoms(Reference Skarupski, Tangney and Li12,Reference Hodge, Almeida and English14,Reference Sanchez-Villegas, Delgado-Rodriguez and Alonso19) . The Mediterranean diet in these studies was characterised by high dietary intake of non-refined grains, fruits, vegetables, legumes and fish and lower levels of consumption of red meat, poultry and full-fat dairy(Reference Panagiotakos, Milias and Pitsavos38,Reference Trichopoulou, Costacou and Bamia39) . The Mediterranean diet is similar to the healthy pattern in the present study in that vegetables, fruits, legumes and seafood are the primary constituents of the diet. Skarupski et al. (age 65+ years, n 3502)(Reference Skarupski, Tangney and Li12), Sanchez-Villegas et al. (mean age 37 years, n 10 094)(Reference Sanchez-Villegas, Delgado-Rodriguez and Alonso19) and Hodge et al. (age 50–69 years, n 8660)(Reference Hodge, Almeida and English14) reported that adherence to a Mediterranean dietary pattern was associated with lower rates of depressive symptoms. Like the present study, the study by Skarupski et al. is one of the few studies that focused on older adults. Unlike the present study, results were not stratified by sex, so a direct comparison is not possible.
In the present study, several biological mechanisms might explain the association seen between healthy dietary patterns and reduced depressive symptoms. Healthy dietary patterns have been associated with lower levels of inflammatory biomarkers including C-reactive protein and IL-6 indicating lower levels of inflammation(Reference Fung, McCullough and Newby40,Reference Lucas, Chocano-Bedoya and Schulze41) . Conversely, unhealthy dietary patterns have been linked to increased levels of the same inflammatory biomarkers indicating higher levels of inflammation(Reference Fung, McCullough and Newby40,Reference Lucas, Chocano-Bedoya and Schulze41) . Emerging evidence in the last 5 years has reported links between chronically raised systemic inflammation and depression(Reference Lucas, Chocano-Bedoya and Schulze41–Reference Rethorst, Bernstein and Trivedi43). In a subset (n 4692) of the Nurses’ Health Study, a large prospective cohort study of women(Reference Lucas, Chocano-Bedoya and Schulze41), an ‘anti-inflammatory dietary pattern’, identified by reduced rank regression, was associated with lower levels of all inflammatory markers and depression. The anti-inflammatory diet in the Nurses’ Health Study was characterised by wine, coffee, olive oil, green leafy vegetables and yellow vegetables and is similar to the healthy pattern identified in the present study which includes vegetables. Collectively, these findings suggest that a poor diet may increase depressive symptoms via increased inflammation.
Another explanation as to why diet is associated with depressive symptoms may be related to fibre intake. A higher intake of dietary fibre has been associated with lower levels of the inflammatory biomarker C-reactive protein(Reference Dias, Wirfält and Drake44–Reference North, Venter and Jerling46), which may decrease systemic inflammation. The healthy dietary patterns in the studies mentioned above(Reference Skarupski, Tangney and Li12,Reference Hodge, Almeida and English14,Reference Sanchez-Villegas, Delgado-Rodriguez and Alonso19,Reference Suzuki, Miyaki and Tsutsumi20) and in the present study are high in vegetables and fruits and thus dietary fibre may play a role in decreasing systemic inflammation and may lead to the lower levels of depressive symptoms reported in women in the present study. This does not, however, explain why the association between a healthy dietary pattern and lower levels of depressive symptoms was not seen in men. The Nurses’ Health Study reported association between an ‘inflammatory dietary pattern’ derived by reduced rank regression and higher levels of depression in 4692 women aged 30–55 years(Reference Lucas, Chocano-Bedoya and Schulze41). The inflammatory diet was characterised by high consumption of sugar-sweetened drinks, refined grains, red meat, margarine, soft drink, vegetables other than green leafy vegetables and yellow vegetables and fish and was associated with higher levels of inflammatory biomarkers C-reactive protein, IL-6 and TNF-α. Lucas et al. also reported association between individual food groups from the inflammatory pattern and higher levels of depression, including red meat and high sugar products, which are also key foods included in the unhealthy dietary pattern in the present study(Reference Lucas, Chocano-Bedoya and Schulze41).
It is possible that the observed association between dietary patterns and depressive symptoms may be explained by reverse causality, where participants with depression are more likely to consume an unhealthy diet. In support of this theory, previous research has found that depression may be associated with poor diet in a cross-sectional analysis and that a history of depression may be associated with unhealthy dietary patterns(Reference Jacka, Cherbuin and Anstey47). Reverse causality between dietary patterns and depressive symptoms has been specifically investigated and ruled out in a previous study of 3668 adults in their 20s, 40s and 60s(Reference Jacka, Cherbuin and Anstey47). The present study is unable to rule out reverse causality as the GDS was not included in the survey at T1 and the analysis could not be adjusted for individuals reporting depressive symptoms at baseline. The present study is, however, in agreement with other cross-sectional and longitudinal epidemiological studies where the association between healthy dietary patterns and lower levels of depressive symptoms has been observed(Reference Skarupski, Tangney and Li12,Reference Hodge, Almeida and English14,Reference Sanchez-Villegas, Delgado-Rodriguez and Alonso19,Reference Suzuki, Miyaki and Tsutsumi20) .
The present study reported an association between dietary patterns and depressive symptoms in women but not men. This is in contrast to the previously observed association between an unhealthy ‘Western’ dietary pattern derived by PCA and characterised by meat, processed meat and fried food and increased depressive symptoms in men(Reference Le Port, Gueguen and Kesse-Guyot16). This may be due to the larger sample size of men (men n 9272 and women n 3132) compared with the present study or the younger age group that was investigated (age 45–60 years). Two prospective cohort studies analysed men and women separately, using PCA to identify dietary patterns and the association with depression. Le Port et al. (age 35–50 years, n 12 404)(Reference Le Port, Gueguen and Kesse-Guyot16) and Ruusunen et al. (age 42–60 years, n 1003)(Reference Ruusunen, Lehto and Mursu18) found that in both men and women a healthy dietary pattern was associated with lower levels of depressive symptoms. The studies above have reported association between healthy dietary patterns and lower levels of depressive symptoms in both men and women, in contrast to the present study where these associations were observed only in women. This may be due to the different younger age of the population being investigated. In agreement with our findings, the Whitehall II study, a large-scale prospective cohort (age 35–55 years, n 4215), found higher scores for the Alternative Healthy Eating Index (higher intake of vegetables and fruits, low intake of trans-fats and a higher ratio of polyunsaturated fat to saturated fat) were associated with lower depressive symptoms in women but this was not observed in men(Reference Lucas, Chocano-Bedoya and Schulze41).
It is also possible the different findings by sex reflect differences in how dietary data collection methodologies are perceived and completed by both men and women. The present study identified slightly different dietary patterns for men and women in that the healthy dietary pattern was the same except for men for whom oil and vinegar salad dressings, rice and cottage or ricotta cheese were included. The unhealthy dietary patterns were also similar, with the exception that for men this pattern also contained pizza and hamburgers, fried or battered fish, hot chips or roast potatoes and muesli or porridge. These food items were not included in the unhealthy dietary pattern for women. The difference in dietary patterns may be due to the differences in actual intake or a potential difference in the accuracy of the FFQ recall between men and women. In a study by Marks et al., sex was found to be significantly associated with the reporting of seventeen food groups when comparing an FFQ to a 12-d weighed food record(Reference Marks, Hughes and van der Pols48). The present study found that the difference between the FFQ and weighed food record was larger for women compared with men. These results indicate that the accuracy of a FFQ may be different for men and women and that this may need to be considered when interpreting the results. To further understand potential implications in nutritional epidemiology, future studies should explore differences in dietary patterns between men and women and how these may vary depending on different dietary intake collection methods.
The strengths of the study include the large, population-based sample that was selected across socio-economic strata in both regional and urban population. The study also collected data on a large range of potential covariates that may impact diet and depressive symptoms. The inclusion of cross-sectional and longitudinal analyses also enabled association between diet and depressive symptoms to be examined over time. The use of a dietary pattern approach to examine diet is also a strength as it acknowledges that food are consumed in complex combinations and enables certain food items consumed by participants to be identified as factors potentially responsible for the association identified.
However, the study limitations that should be acknowledged include a reliance on self-reported measures, which may introduce bias. Dietary intake was assessed using an FFQ, which may introduce recall bias that could have resulted in underreporting of unhealthy foods and the overreporting of healthy food by participants. However, the validity of the FFQ used in the present study has been confirmed when using PCA in older Australians(Reference Thorpe, Milte and Crawford36). The dietary data collected did not include portion sizes needed for the estimation of average daily nutrient intake, which did not allow for adjustment of quantitative covariates associated with diet, such as total energy intake. However, there is some evidence to support the use of non-energy-adjusted dietary intake in dietary pattern analysis when using PCA because this has been shown to be more sensitive to low-energy food intake such as vegetables and fruits(Reference Northstone, Ness and Emmett49).
Depressive symptoms were reported using the GDS; and in the present study, only 1·3 % of the participants were suffering from depression (using a GDS cut-off > 11 as recommended)(Reference Sheikh and Yesavage31), which is below the 4·1 % prevalence reported in the overall Australian population(Reference Slade, Johnston and Oakley Browne3). It is also below the rate of 8·2 % reported by Pirkis et al. for clinically significant depression in Australian adults 60 years and over(Reference Pirkis, Pfaff and Williamson50). This suggests that depressive symptoms may have been underreported or that this is a population that is healthier than the general Australia population. Compared with the general Australian population, these results may indicate that that individuals suffering from depressive symptoms are underrepresented in this sample and may have impacted the ability of the present study to detect the association between dietary patterns and depression. The study was available only in the English language and may have introduced bias against non-English-speaking participants. The 2016 Australian Census reported that English was the main language spoken at home by 68 % of Victorians(51). Although a wide range of demographic, social and health-related variables were tested as potential covariates in the present study, it is possible that some other residual confounding of the association remained(52). Future research should also examine the complex interplay of confounding factors in order to allow causal links to be established.
We found both past and current healthy dietary patterns were associated with lower levels of depressive symptoms in women but not in men. This finding adds to the growing body of evidence that a healthy dietary pattern is associated with better mental health in older people. This reinforces the messages in existing public education campaigns and may provide an additional motive for the consumption of a diet in line with national guidelines(52). Large-scale randomised controlled trials are needed to determine whether the associations found in the present study are causal.
Acknowledgements
The Diabetes Australia Research Trust and the Australian Research Council funded the present study (ID: DP1095595, FT100100581). Both were not involved in the study’s design, data collection, analysis or interpretation of data, nor were they involved in the drafting or submission of this article. S. A. M. is supported by a National Health and Medical Research Council Career Development Fellowship (ID: 1104636).
S. A. M. and C. M. M. designed and conducted the research; M. J. H. and M. G. T. analysed the data; M. J. H. drafted the paper; M. J. H., C. M. M., S. J. T., S. A. M. and M. G. T. reviewed and revised the paper. M. J. H., C. M. M. and S. J. T. have primary responsibility for the final content. All authors read and approved the final manuscript.
The authors declare no conflicts of interest.


