


Introduction
Reconstructions of past environmental conditions in the Netherlands have been traditionally based upon the analysis of pollen and macro-fossil remains found in soils and sediments (e.g. van Geel et al., Reference van Geel, Coope and van der Hammen1989; Janssen, Reference Janssen1972; Engels et al., Reference Engels, Bakker, Bohncke, Cerli, Hoek, Jansen and Wolma2016). These approaches, however, rely on the preservation of organic material which limits the geographic spread of their use (Hevly, Reference Hevly1981; Birks & Birks, Reference Birks and Birks2000). Conversely, phytoliths are siliceous microfossils formed in vegetative structures of many different plants which preserve in a wide range of environments (Jones & Handreck, Reference Jones and Handreck1967; Rovner, Reference Rovner1971; Rovner, Reference Rovner1983; Shakoor et al., Reference Shakoor, Bhat and Mir2014). They are produced in high concentrations in the epidermal tissue of grasses and many herbaceous plants (Rovner, Reference Rovner1983), and in lower concentrations in coniferous and deciduous trees (Geis, Reference Geis1973; Klein & Geis, Reference Klein and Geis1978). Morphological variation of phytoliths can be used to distinguish plant types (e.g. trees, grasses, shrubs, herbs), and this variation has been used to reconstruct past vegetation changes in palaeoecological and archaeological studies (Piperno, Reference Piperno1985; Piperno, Reference Piperno2006; Piperno, Reference Piperno2014).
Phytoliths are sometimes paired with pollen to determine vegetation reconstructions, as both proxies show different aspects of the vegetation (e.g. Åkesson et al., Reference Åkesson, McMichael, Raczka, Huisman, Palmeira, Vogel, Neill, Veizaj, Bush and de Lafontaine2021; Groff et al., Reference Groff, Greenawalt and Gill2022; Ramírez et al., Reference Ramírez, Rasbold, Parolin and Stevaux2019). Pollen grains are dispersed by wind, insects and larger animals and pollen assemblages captured in lake sediments typically reflect regional vegetation. Phytoliths do not share these dispersal mechanisms and are representative of local vegetation (Blinnikov, Reference Blinnikov2005). A combination of pollen and phytolith analysis from the same setting is possible with many lake sediment cores. Pollen, however, is especially susceptible to degradation in alkaline and hyposaline conditions (Phuphumirat et al., Reference Phuphumirat, Zetter, Hofmann and Ferguson2015) or in oxidative settings, such as characteristic of many soils. The silica-based phytoliths do not typically degrade in soils. Plant macrofossils, a third proxy to determine vegetation reconstruction, are also representative of local vegetation (Mauquoy et al., Reference Mauquoy, Hughes and Van Geel2010). Plant macrofossil assemblages can provide a detailed picture of local vegetation on a species level, but have the disadvantage that they are produced in a smaller amount than pollen or phytoliths and thus larger quantities of sediment are needed for a proper analysis (Birks, Reference Birks2007). Therefore, analysis of phytoliths could be beneficial either alongside macrofossils to create a more complete overview of past vegetation or as the sole proxy to determine local vegetation when macrofossil analysis is not possible.
The morphologies, or different forms, of phytoliths can vary between species, genera or families. The morphological variation of phytoliths can often be used to identify plants at the family level (Ollendorf, Reference Ollendorf1992; Piperno, Reference Piperno1985; Piperno, Reference Piperno2006; Piperno, Reference Piperno2014; Rovner, Reference Rovner1983; Shakoor et al., Reference Shakoor, Bhat and Mir2014). There are exceptions, however, and some morphotypes can be used to determine tribes or subtribes within families, such as with the Poaceae (grasses) or Cyperaceae (sedges). This makes phytolith analysis particularly complementary to pollen analysis, which cannot distinguish tribes or subtribes within the grasses or sedges. Determining Poaceae to a more specific level gives additional relevant information on past land use. For example, phytoliths make it possible to distinguish different crops within the Poaceae family, and can provide the determination of cereals to the species level using the identification of glume epidermis (Ball et al., Reference Ball, Chandler-Ezell, Dickau, Duncan, Hart, Iriarte, Lentfer, Logan, Lu, Madella, Pearsall, Piperno, Rosen, Vrydaghs, Weisskopf and Zhang2016). The ability to identify cultivated grasses also makes phytolith analysis exceptionally useful for archaeological research.
Pollen or phytolith assemblages from surface soils or sediments reflect modern vegetation and are commonly used as a foundation to quantify past environmental change (e.g. Birks, Reference Birks2019; Delhon et al., Reference Delhon, Alexandre, Berger, Thiébault, Brochier and Meunier2003; Odgaard, Reference Odgaard1999; Watling et al., Reference Watling, Iriarte, Whitney, Consuelo, Mayle, Castro, Schaan and Feldpausch2016; Zhang et al., Reference Zhang, Duo, Pang, Felde, Birks and Birks2018). Phytolith assemblages from soil surface samples and phytolith morphotypes from herbarium samples have been characterised for different parts of the world, such as eastern Europe (Alexandra, Reference Alexandra1997), the Mediterranean region (Bremond, et al., Reference Bremond, Alexandre, Véla and Guiot2004), North America (Blinnikov, Reference Blinnikov2005; Fredlund & Tieszen, Reference Fredlund and Tieszen1994), Africa (Runge, Reference Runge1999) and South America (e.g. Dickau et al., Reference Dickau, Whitney, Iriarte, Mayle, Soto, Metcalfe, Street-Perrott, Loader, Ficken and Killeen2013; Huisman et al., Reference Huisman, Raczka and McMichael2018; Witteveen et al., Reference Witteveen, Hobus, Philip, Piperno and McMichael2022). In North-Western Europe, analysis of surface sample phytolith assemblages is limited (Powers et al., Reference Powers, Padmore and Gilbertson1989), particularly in the Netherlands (McMichael et al., Reference McMichael, de Wolf and Land2019). Filling the knowledge gap on phytolith assemblages from surface samples, and how they relate to the modern vegetation and environment in North-Western Europe and specifically in the Netherlands, would allow more detailed and quantifiable reconstructions of past ecological change in these areas. By creating a link between modern vegetation compositions and their corresponding phytolith assemblages, characterising and quantifying past environmental changes using phytoliths become possible. Here, we assess the variability of phytolith assemblages within and between vegetation types (forest, agricultural and wetland), compare the abundances and concentrations of phytolith types between vegetation types and highlight the value of phytolith analysis in studies of past environmental change in the Netherlands.
Methods
Experimental design
Currently, more than 50% of the Netherlands have been classified as agricultural land, 8% as forested and ca. 4% as wetland (CBS et al., 2016). The other 34% has been classified as water (19%), urban areas (13%) and recreational areas (2%) (CBS et al., 2016) (Fig. 1). We collected 42 soil surface samples from 21 locations (2 samples per locations) throughout the Netherlands in December 2017 and January 2018 (Table 1 and Fig. 1). Our sampling included forests, agricultural fields and wetlands, each consisting of 14 samples and 7 locations (Table 1). The location of the sites was chosen to evenly cover the Netherlands for each vegetation type. Additionally, forest samples were chosen based on their “plantgemeenschap” (Schaminée et al, Reference Schaminée, Sykora, Smits and Horsthuis2010), agricultural fields on the type of crop that was grown and wetlands on the type of wetland (Scott & Jones, Reference Scott and Jones1995). All samples were collected from the top layer of the soil (0–1 cm) directly below the litter layer.
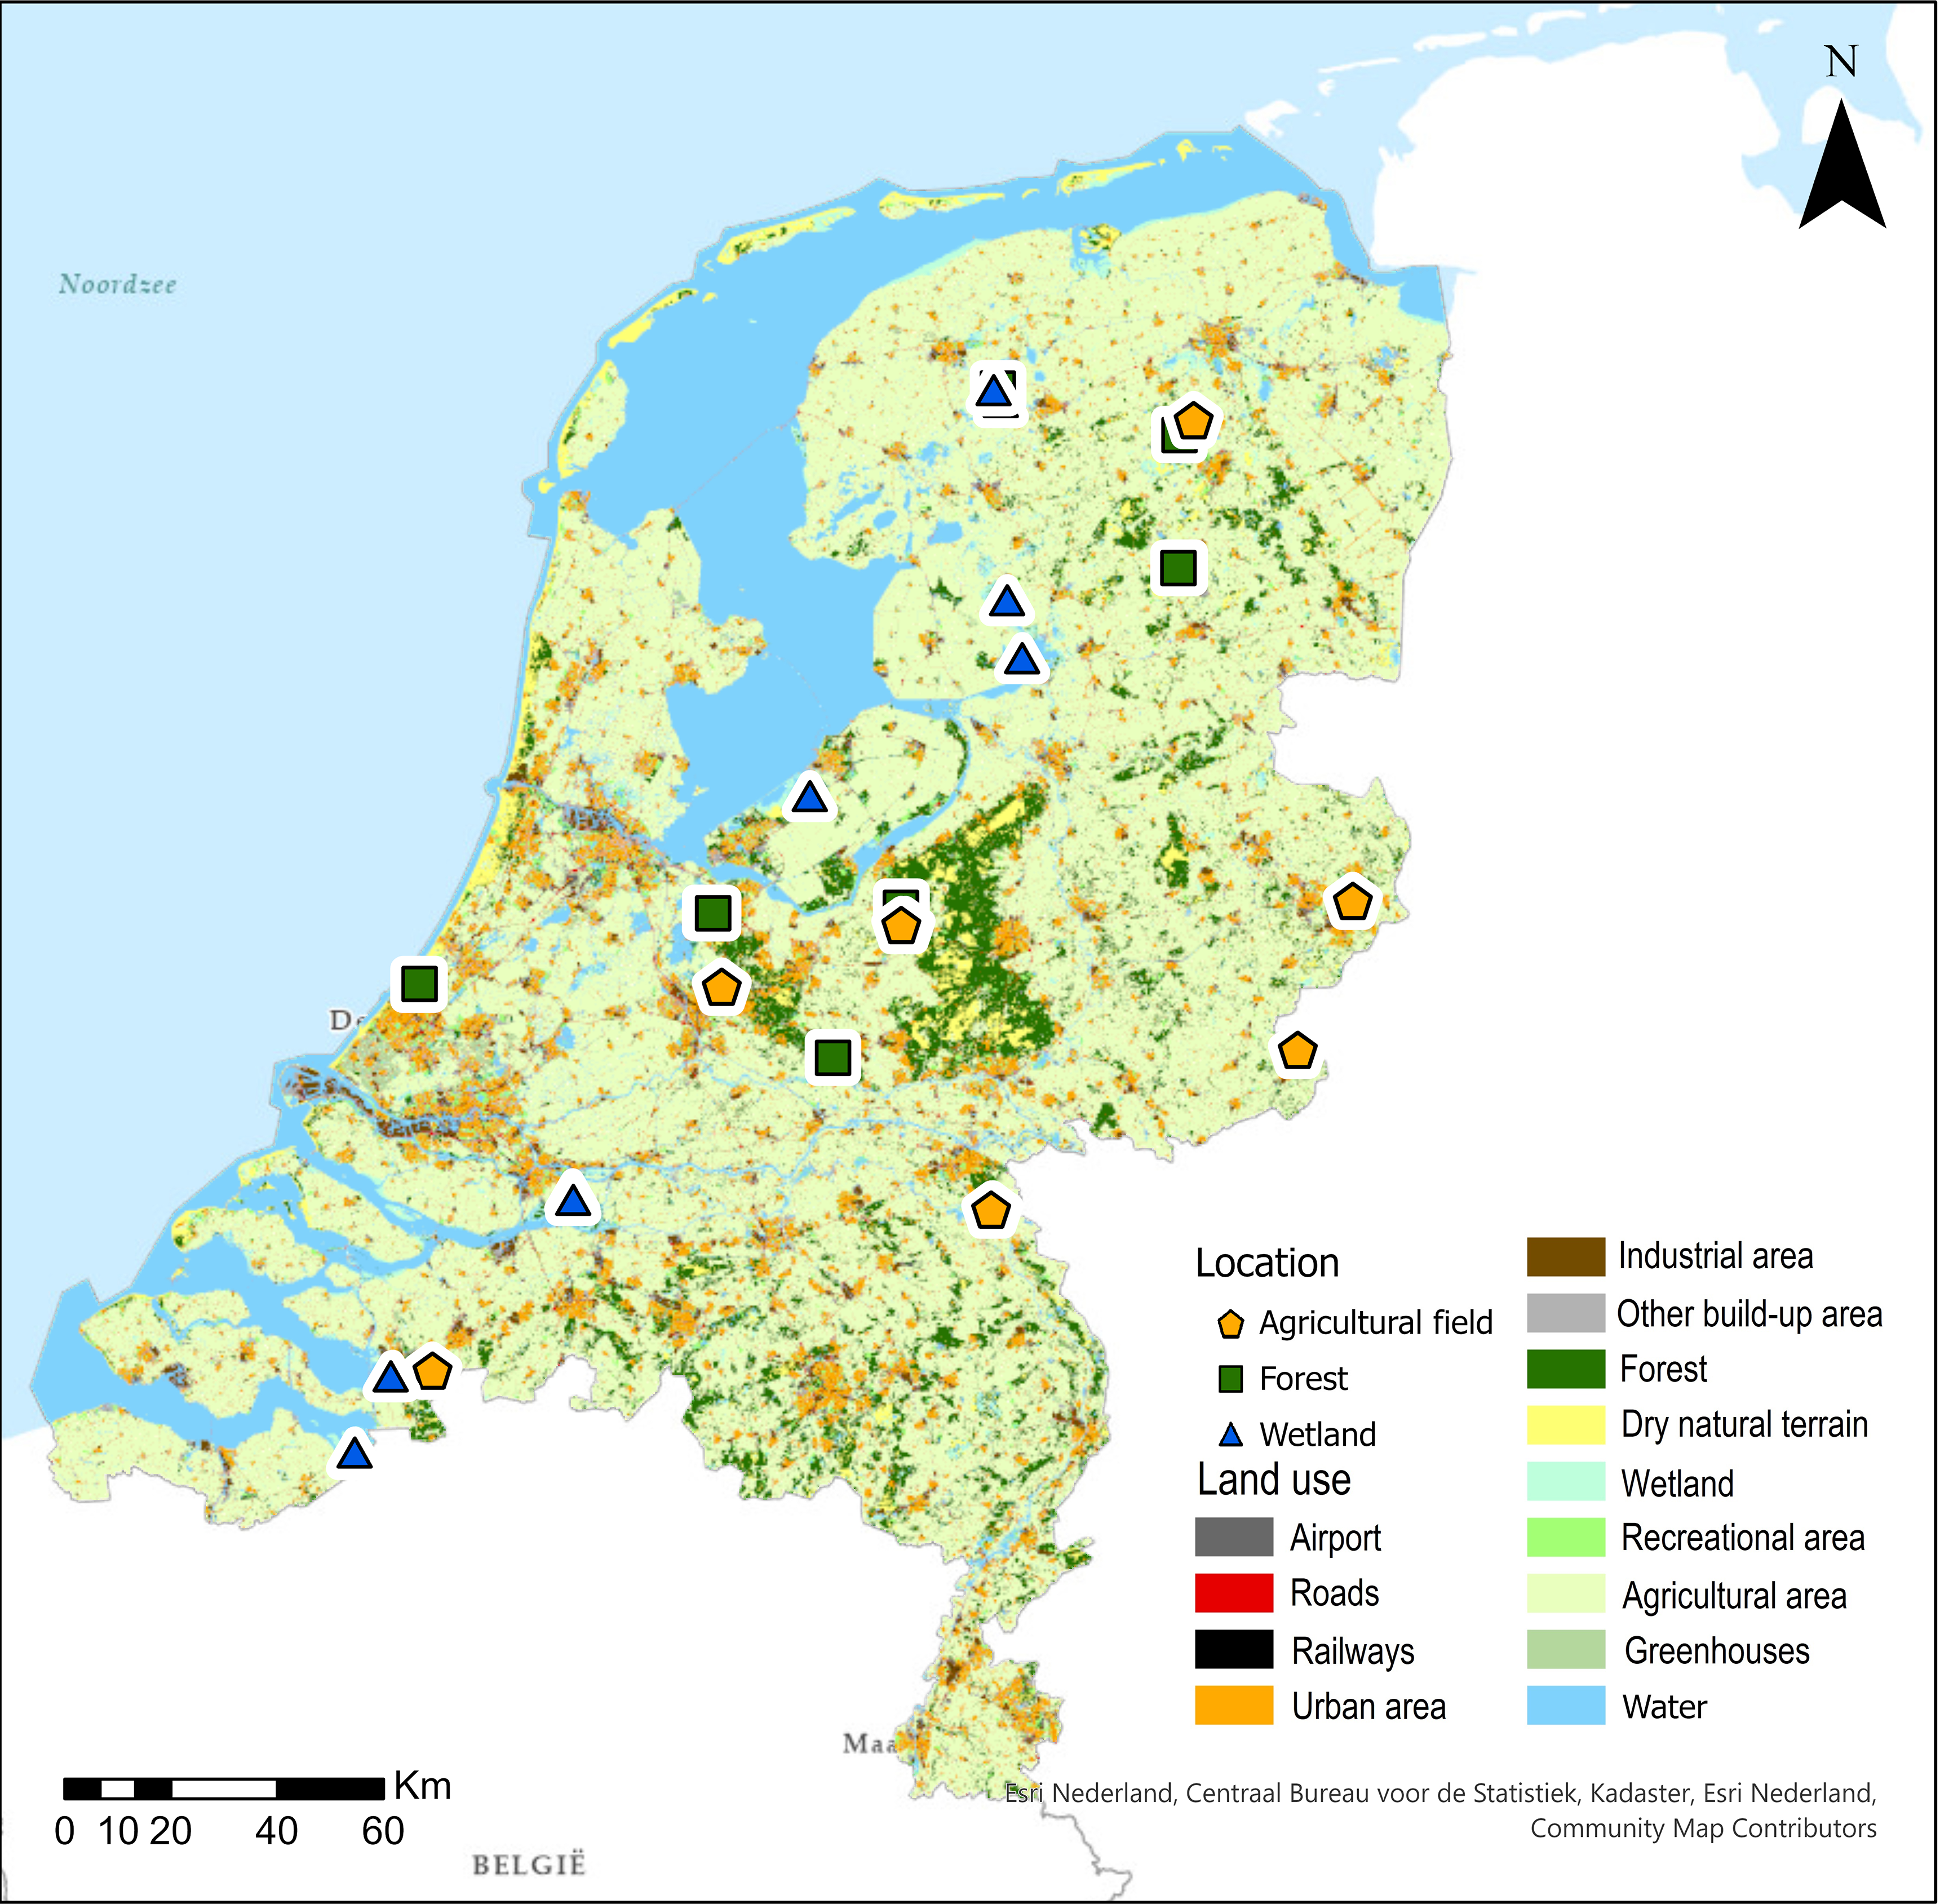
Fig. 1. Locations used in phytolith composition comparisons in the Netherlands. The colours of the circles (study sites) indicate the main vegetation type, and the background map shows the variation in land use (CBS et al., 2020b).
Table 1. Locations of soil surface samples collected in the Netherlands and analysed for phytoliths. Samples were collected in 21 locations (n = 2 for each location) throughout the Netherlands from three different vegetation types. Coordinates (latitude, longitude), soil type, average annual precipitation (Precip.) and average annual temperature (Temp.) are given per location (CBS et al., 2020a; CBS et al., 2020b, CBS et al., 2020c). Forests are categorised by “plantgemeenschap” (Schaminée et al., Reference Schaminée, Sykora, Smits and Horsthuis2010) (per location) and most commonly occurring tree species (per sample), agricultural fields by the type of crop and wetlands by wetland type (Scott & Jones, Reference Scott and Jones1995).
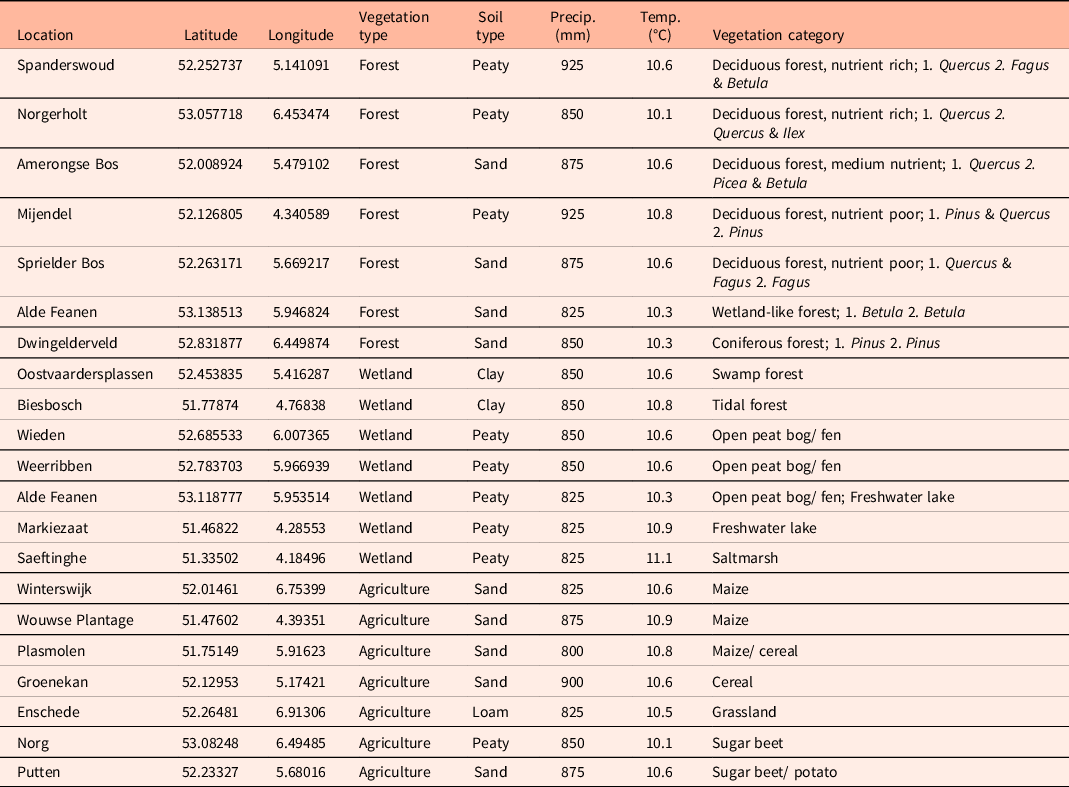
Soils in the Netherlands commonly consist of peat, sand, clay and loam (Alterra, 2006), and our sampling design consisted of nine sites with peat or peaty sediment, nine sites with sandy soils, two with clay soils and one site with loam (Table 1). The average annual precipitation (average of 1991–2020) in the Netherlands is 862 mm, and at our sampled sites ranged from 800 to 925 mm per year (CBS et al., 2020a). The average annual temperature in the Netherlands is 10.5°C, though at our sampled sites ranged from 10.1 to 11.1°C (CBS et al., 2020c).
Site description
Two forests included in this study are characterised as deciduous forest on rich soil; Amerongse Bos and Norgerholt. The Amerongse Bos, located in the southern part of the province Utrecht, consists of a combination of Quercus, Picea and Betula, all situated on a sandy soil. Norgerholt is a unique forest with mainly Ilex shrubs alongside Quercus trees on an organic rich soil. Contrary to the Amerongse Bos and Norgerholt are Meijendel and Sprielder Bos deciduous forests on poor soil. Meijendel, located near the coast in Zuid-Holland, mostly consists of both Pinus and Quercus on a peaty soil while Sprielder Bos, in the north-western part of Gelderland, has a combination of Quercus and Fagus on a sandy soil. Spanderswoud, in the south-eastern part of Noord-Holland, is also a deciduous forest but has an intermediate soil type. This forest, with a peaty soil, has a combination of Quercus, Fagus and Betula trees. Dwingelderveld, situated in the province Drenthe, is mainly dominated by Pinus trees, thus making this the only coniferous forest in this study. This forest has very little undergrowth with a well-developed moss layer and is situated on a sandy soil. The only wet forest, Alde Feanen, is located in the North of the Netherlands (Friesland). Alde Feanen has a rather wet soil and is, aside from a forest, also partly a wetland. The forest part of Alde Feanen is dominated by Betula trees and has a peat soil.
On three of the agricultural fields maize (Zea mays) is cultivated; Winterswijk, Plasmolen and Wouwse Plantage. Winterswijk is located near the German border in Gelderland, Plasmolen also near the German border but more South in Noord-Brabant and Wouwse Plantage near the coast in the south of Zuid-Holland. All three locations have a sandy soil and lay next to patches of forest. Groenekan, in the centre of the province Utrecht, has a sandy soil as well but cereal (Cerealia) is cultivated here. East to Groenekan, near the Veluwe in Gelderland, lays Putten. Here, sugar beets (Beta vulgaris) and potatoes (Solanum tuberosum) are cultivated on an organic-rich soil. Sugar beets are cultivated in Norg as well. This location is situated in the North of the Netherlands in Drenthe. The last agricultural field in this study is situated near the town Enschede in East of Overijssel. This field is a grassland on a loamy soil.
Two of the wetlands in this study can be classified as open peat bog: Wieden and Weerribben, which are located next to each other in the Northern province Friesland. These two wetlands are dominated by Poaceae and Juncaceae. A similar wetland also in Friesland is Alde Feanen. This wetland is a combination of an open peat bog and a freshwater lake and is situated next to a wet forest. Here, a combination of Poaceae, Juncaceae and some small patches of trees and shrubs can be found. Markiezaat, in the western part of the Netherlands, is a nature reserve around a freshwater lake. The Markiezaatsmeer used to be part of the Oosterschelde but has been closed off in 1984, converting the lake to a freshwater marsh. The area around the lake is dominated by Poaceae and has some large herbivores present that graze on the plants in the area. These grazer are also present in the Oostvaardersplassen, a nature reserve in the province Flevoland. This area is relatively young since the province only exists since the 1960s. The wetland can be classified as a swamp forest. A different class of forested wetland is the tidal forest which we see in the Biesbosch in the west of Noord-Brabant. This wetland is located at the end of an estuary and thus is a freshwater wetland. The only saltmarsh is Saeftinghe, which is an area that used to be populated but has been submerged during the 14th and 16th century.
Laboratory analysis
All soil surface samples (n = 42) were processed for phytoliths at the Palaeoecology Laboratory at the University of Amsterdam (UvA), using a subsample containing 1 cm3 of soil. At the onset of laboratory processing, 56,000 microspheres (Microparticles GmbH, Lot: SiO2-R-L3519-3, ø 15.29 μm, SD 0.49 μm) were added to each sample to calculate phytolith concentrations (Huisman et al., Reference Huisman, Bush and McMichael2019; Witteveen et al., Reference Witteveen, Hobus, Philip, Piperno and McMichael2022). A series of chemical treatments, with 33% hydrogen peroxide (H2O2), 10% hydrochloric acid (HCl) and potassium manganate (KMnO4), were performed on each sample. Bromoform (CHBr3, 2.3 SG) was then added to the samples, and the mixture was centrifuged at 1500 rpm for 10 minutes (McMichael et al, Reference McMichael, Witteveen, Scholz, Zwier, Prins, Lougheed, Mothes and Gosling2021). Phytoliths and microspheres were separated from heavier materials and thus got collected in the top of the mixture. This top part was poured into a new tube with 100% ethanol and centrifuged twice at 4500 rpm for 1.5 minutes. Afterwards, phytoliths were mounted on microscope slides in Naphrax permanent mountant. The extracted phytoliths were then mounted on microscope slides in Naphrax and stored at the University of Amsterdam Palaeoecology Laboratory as reference material.
Data analysis
All phytolith morphotypes were identified using literature (Blinnikov, Reference Blinnikov2005; Pearsall, Reference Pearsall2015; Piperno, Reference Piperno2006), and the phytolith catalogue (phytolith reference material) of the University of Amsterdam, and were counted using a light microscope (Carl Zeiss axioscope microscope) at 400x magnification. The microspheres were counted simultaneously to determine the concentration of phytoliths. At least 350 phytoliths or 1000 microspheres were counted per sample, of which at least 200 of the 350 phytoliths needed to be grass silica short-cell phytoliths (GSSC) (Aleman et al., Reference Aleman, Canal-Subitani, Favier and Bremond2014). Percentages and concentrations per phytolith morphotype were calculated. The concentration of the phytoliths was calculated using the count of the added microspheres and eqn 1.
 $${\rm{Concentration}} = {{{\rm{total}}\,{\rm{added}}\,{\rm{microspheres}} \cdot \;{\rm{counted}}\# \;{\rm{phytoliths}}} \over {{\rm{counted}}\# {\rm{microspheres}}}}$$
We also calculated the total concentration of phytoliths (all morphotypes combined), and concentrations and percentages for phytolith groups, including: (1) the sum of arboreal phytoliths (spheroid rugose (large), spheroid rugose (small), spheroid ornate and elongate entire), (2) the sum of grass phytoliths (rondel (wide), rondel (elongated), rondel (tabular), tent-shaped body, trapezoid, polylobate (symmetrical), polylobate (asymmetrical), bilobates (thin castula), bilobate (thick castula), saddle and cross) and (3) the sum of herbaceous phytoliths (papillate, Asteraceae, spheroid psilate, elongate dendate and elongate dendritic) (Blinnikov, Reference Blinnikov2005; Pearsall, Reference Pearsall2015; Piperno, Reference Piperno2006).
Non-metric Multidimensional Scaling (NMDS) was performed on the phytolith percentages and concentrations to assess the similarities and dissimilarities within and between sites and vegetation types. Morphotypes were excluded from the ordination analysis if they occurred in less than two samples or less than 5% abundance in total. We also performed one-way analyses of variance (ANOVAs) to identify differences in individual phytolith morphotypes and phytolith morphotype groups between vegetation types (forest, agricultural field, wetland). A Tukey HSD post-hoc test was used when the one-way ANOVA showed significant differences between groups. When needed, a log-transformation or a sqrt-transformation was used to meet the assumptions of the ANOVA. When the assumptions for an ANOVA were not met after transformations, a Kruskal–Wallis test was performed instead with a Dunn test as corresponding post-hoc test. All phytolith data were analysed using R version 3.6.3 (R Core Team, 2013) and R-studio version 1.2.5033 (R Team, Reference Team2015).
Results
The total percentages and concentrations of arboreal (forest), grass and herbaceous phytoliths were significantly different between forest, agricultural and wetland vegetations (Table A1; Figs. 2 and 3). Forest vegetations contained significantly lower total grass phytolith percentages (Table A2) than agricultural fields or wetlands, and significantly higher arboreal phytolith percentages (Tables A1 and A2; Fig. 2). Forest samples had significantly lower total phytolith concentrations than wetlands and agricultural fields, and lower total grass phytolith and herbaceous phytolith concentrations (Tables A1 and A2; Fig. 3). Wetland vegetations contained significantly higher total herbaceous phytolith percentages than forests and agricultural fields (Tables A1 and A2; Fig. 2). Wetlands had the highest total herbaceous phytolith concentration (Tables A1 and A2; Fig. 3). There were no significant differences between the total or total grass phytolith concentrations between wetlands and agricultural fields (Table A1).

Fig. 2. Relative abundances of phytolith morphotypes (%) recorded within forests, agricultural fields, and wetlands across the Netherlands. Dark blue phytolith morphotypes represent arboreal taxa, light blue morphotypes represent gras taxa, and green morphotypes represent herbaceous taxa. Yellow columns show the sums of arboreal, grass, and herbaceous phytolith morphotypes.
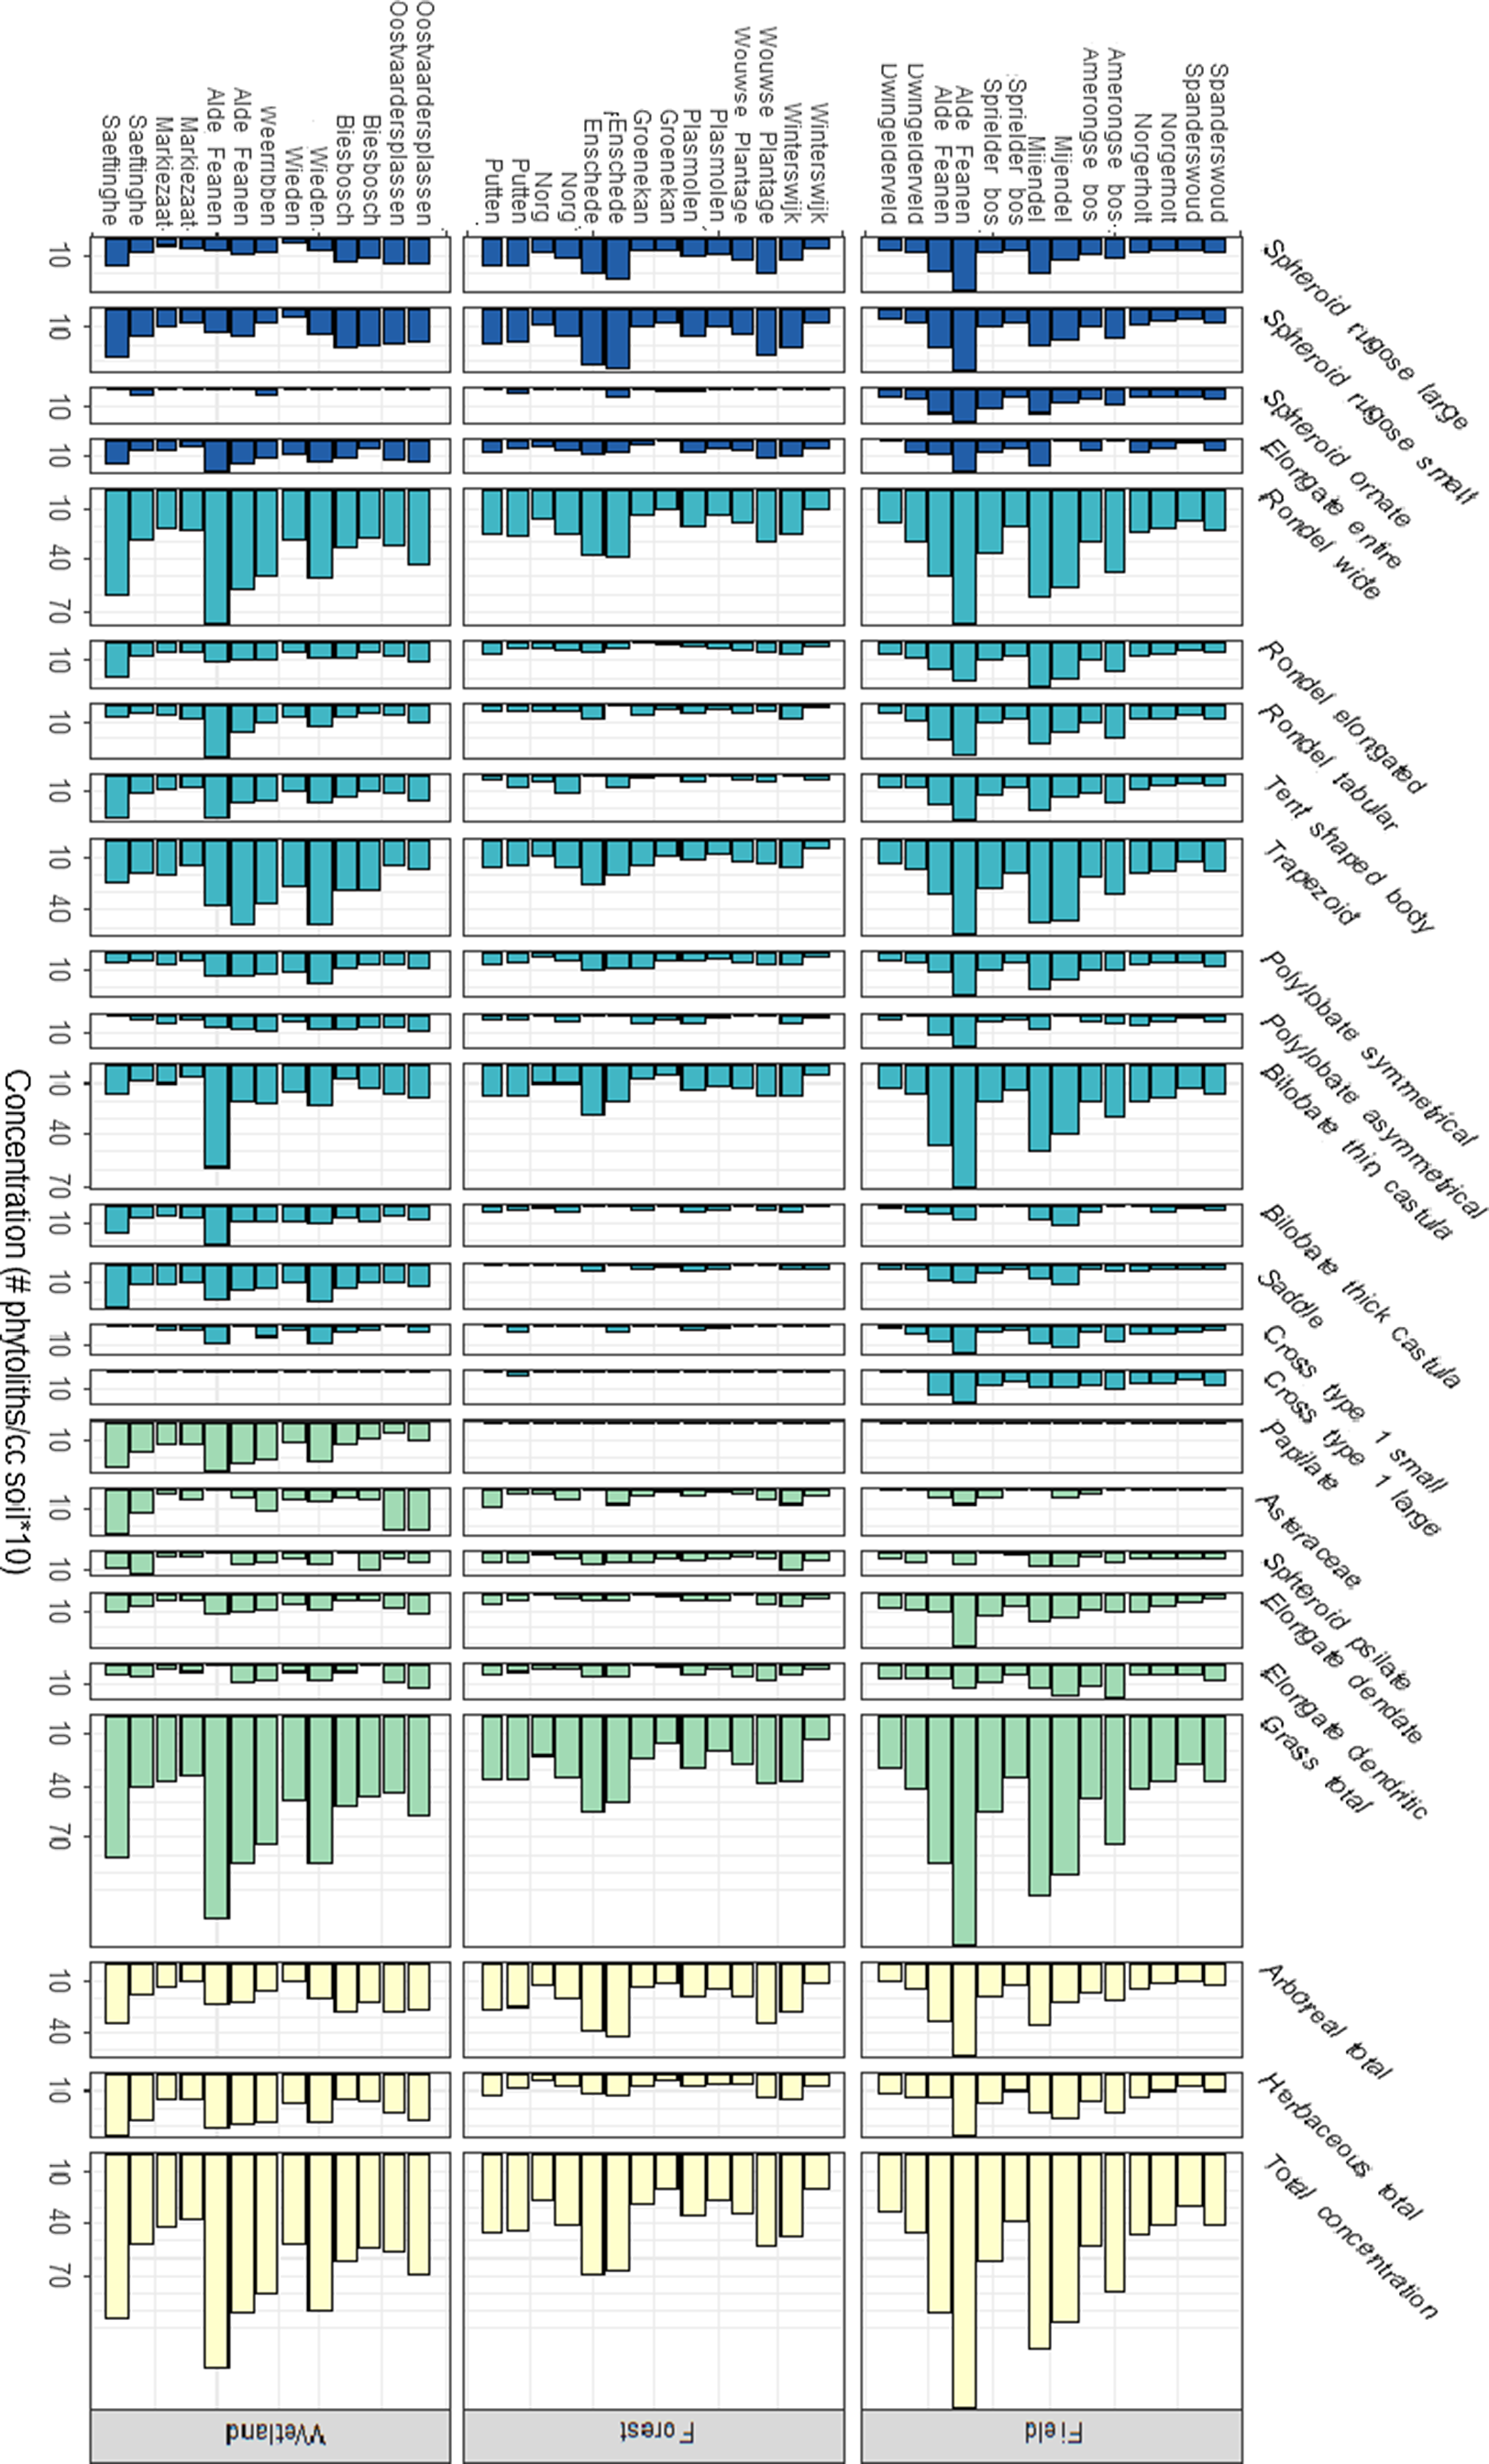
Fig. 3. Phytolith concentrations (#phytoliths/ cm3 soil, square root transformed) recorded within forests, agricultural fields, and wetlands across the Netherlands. Dark blue phytolith morphotypes represent arboreal taxa, light blue morphotypes represent grass taxa, and green morphotypes represent herbaceous taxa. Yellow columns show the sums of arboreal, grass, and herbaceous phytolith morphotypes.
Forested vegetations had significantly higher percentages of all types of arboreal phytoliths, and significantly lower percentages of tent-shaped bodies, a morphotype representing grass phytoliths (Tables A1 and A2; Fig. 2), compared with wetlands and agricultural fields. Concentrations of grass phytolith morphotypes were consistently low within forest vegetations (Fig. 3). The concentrations of five types of grass phytoliths were significantly lower in forests compared with agricultural fields and wetlands: tent-shaped bodies, tabular rondels, elongated rondels, trapezoids and symmetrical polylobates (Tables A1 and A2; Fig. 3). Concentrations of elongate dendate phytoliths, produced by herbaceous taxa, were also significantly lower in forests compared with other vegetation types.
The percentages of tabular rondels, crosses (small and large type 1) and elongated rondels, which represent grasses, were significantly higher in agricultural fields compared with wetlands or forest vegetations (Tables A1 and A2; Fig. 2). The percentages of spheroid ornate phytoliths, which are arboreal but are usually linked to disturbed areas, and elongate dendate phytoliths, which represent herbaceous taxa, were also significantly higher in agricultural fields compared with wetland or forest vegetations (Tables A1 and A2; Fig. 2). The agricultural fields contained significantly lower percentages of spheroid psilate and elongated dendate phytoliths than other vegetation types. Four phytolith morphotypes occur in significantly higher concentrations in agricultural fields compared with wetlands or forests: elongate dendritic, bilobates with thin castula, crosses and spheroid ornates (Tables A1 and A2; Fig. 3). Asteraceae phytoliths occurred in smaller amounts in agricultural fields than in wetland and forest vegetations (Figs. 2 and 3).
Wetlands contained significantly higher percentages and concentrations of bilobate (thick castula), saddles and papillates (Cyperaceae) phytoliths compared with agricultural field and forest vegetations (Tables A1 and A2; Figs. 2 and 3). The concentrations of elongate entire, which represent herbaceous taxa, and Asteraceae, which is a shrub, are significantly higher in the wetland vegetation samples compared with other vegetation types (Fig. 3).
The NMDS analysis showed that the entire phytolith assemblages were distinguishable between forest, agricultural and wetland vegetation types using both the percentages (Fig. 4A–E) and concentrations (Fig. A1A–E) data. This separation was clear on the first ordination axis (NMDS1). Negative NMDS1 scores corresponded with forested settings, and positive scores corresponded with wetland settings (Fig. 4A). Agricultural fields were located in the middle of NMDS1, as they contained taxa found in both forest and wetland vegetations and were distinguishable by their high abundances of grass phytolith morphotypes (Fig. 4A). The second ordination axis (NMDS2) separated the forest and wetland samples, which contained negative scores, from the agricultural fields, which contained positive scores (Fig. 4A). The separation on NMDS2 was primarily driven by differences in the percentages of crosses (type 1 large) and Asteraceae phytolith morphotypes (Fig. 4A).

Fig. 4. NMDS of phytolith samples. The NMDS was carried out using the percentages (%) in which each morphotype is present (stress = 0.1459). A: overall results of the NMDS, blue dots represent the samples taken from wetlands, the green dots the samples taken from forests and the yellow dots the samples taken from agricultural fields. The circles show the centre of the different clusters. B-E: within variation of the different vegetation types: B – agricultural fields, C – wetlands, D – forests (forest type based on Schaminée et al. (Reference Schaminée, Sykora, Smits and Horsthuis2010), E – forests (most commonly occurring tree species).
The agricultural fields showed less within-vegetation variation in phytolith assemblages than the forest and wetland samples (Fig. 4B–D). The ordination scores from the wetland samples were driven by a gradient of forested to open wetlands (Fig. 4C) and the scores of the forested samples were loosely based on the richness of the soils (Fig. 4D). No clear separation could be seen within forests between most commonly occurring tree species (Fig. 4E). Results of the ordination using the phytolith concentration data (Appendix A, Fig. A1A–E) were similar to the results using the percentage data (Fig. 4A–E).
Discussion
The need for more phytolith reference material across Europe due to interregional variability and environmental heterogeneity has been previously noted (Zurro et al., Reference Zurro, García-Granero, Lancelotti and Madella2016). Most major vegetation types in the Netherlands were covered in our survey except in the south of the Netherlands (Limburg), which has a different type of soil (loess) and vegetation compared with the northern part of the country (Alterra, 2006; Bazelmans et al., Reference Bazelmans, Weerts and van der Meulen2011). Our comparisons of specific phytolith morphotypes and the phytolith assemblage data clearly showed that the forest, agricultural and wetland vegetations within our sampling were clearly distinguishable using the percentage or concentration data, and that there were patterns of variability both within and between sites (Figs. 2–4).
Even though many tree families found in the Netherlands do not produce many phytoliths (Piperno, Reference Piperno2006), our results showed that these taxa still produce enough phytoliths to distinguish forested from non-forested settings (Figs. 2–4). Forest types as defined by Schaminée et al. (Reference Schaminée, Sykora, Smits and Horsthuis2010) (Table 1; Figs. 4D and A1C) showed clustering in the NMDS, but clustering based on the most commonly occurring tree species was not evident (Fig. 4E and A1D). These results suggest that gradients in soil type and nutrient levels (Table 1) likely drive differences in the phytolith assemblages (Fig. 4D and A1C), and that the less common trees or undergrowth species are the major phytolith producers in forested vegetations. In other parts of the world, forest types have been shown to be distinguishable from other vegetation types and from each other. For instance, studies conducted in a temperate region in North-eastern China have found that woody communities could be differentiated from herbaceous and grass-dominated communities using phytoliths (Gao et al., Reference Gao, Jie, Wang, Liu, Liu, Li, Li, Shi and Leng2018; Gao et al., Reference Gao, Jie, Li, Li, Liu, Liu, Leng, Wang, Liu and Li2019). Additionally, they found that different forest types, such as coniferous forests and deciduous forests, could be differentiated from each other. Another study found that the assemblages of phytoliths are strongly correlated with soil type (Hyland et al., Reference Hyland, Smith and Sheldon2013), similarly to our results within the different forest types.
Like forests, there is also a wide variety of wetland vegetations. The Convention on Wetlands of International Importance especially as Waterfowl Habitat (Ramsar Convention Bureau, 1971) has defined wetlands as ‘areas of marsh, fen, peatland or water, whether natural or artificial, permanent or temporary, with water that is static or flowing, fresh, brackish or salt, including areas of marine water the depth of which at low tide does not exceed six meters’. Due to this broad definition, at least 22 different types of wetlands occur in the world (Scott & Jones, Reference Scott and Jones1995), with at least five different types occurring in the Netherlands. The phytolith assemblages from the wetland systems of the Netherlands were clearly distinguishable from other vegetation types because of the high abundances of papillate morphotypes (Figs. 4A and A2), which are produced by Cyperaceae and Juncaceae species (Ollendorf, Reference Ollendorf1992; Piperno, Reference Piperno2006). As with the forest phytolith assemblages, the wetland phytolith assemblages also varied along environmental gradients within the vegetation types. The NMDS indicated a gradient from freshwater to saltwater wetlands and from forested to open wetlands (Fig. 4C). For instance, saltwater wetlands had higher percentages of the phytolith morphotypes Asteraceae than freshwater wetlands, a family that contains species generally associated with salt marshes (e.g. Tripolium pannonicum, Artemisia maritima) and species generally associated with open vegetation types. Since Dutch agricultural fields usually weedless, this might explain why the Asteraceae-phytoliths are found less in the agricultural fields. Forested wetlands contained more arboreal morphotypes than open wetlands and less papillate morphotypes, generally linked to Cyperaceae and Juncaceae (Figs. 2, 3, and A2).
We expect that additional analysis of soil surface samples would show that the various types of forested and wetland vegetations within north-western Europe have distinguishable phytolith assemblages driven by soil nutrient and hydrological gradients, similar to the results of Hyland et al. (Reference Hyland, Smith and Sheldon2013). Phytolith assemblages from soil surface samples in other regions are also known to reflect these environmental gradients (e.g. North America, South America, Eastern Europe and Asia) (Alexandra, Reference Alexandra1997; Blinnikov, Reference Blinnikov2005; Bremond et al., Reference Bremond, Alexandre, Véla and Guiot2004; Dickau et al., Reference Dickau, Whitney, Iriarte, Mayle, Soto, Metcalfe, Street-Perrott, Loader, Ficken and Killeen2013; Gao et al. Reference Gao, Jie, Wang, Liu, Liu, Li, Li, Shi and Leng2018; Gao et al., Reference Gao, Jie, Li, Li, Liu, Liu, Leng, Wang, Liu and Li2019).
The agricultural fields showed less variability in phytolith assemblages between sites than the forested or wetland vegetations (Fig. 4B–E). The NMDS showed no separation or patterning of the agricultural sites based on the type of crop grown on the fields. The agricultural fields could be determined by high amounts of grass silica short cell phytoliths (GSSCs) and phytoliths linked to crops and disturbance (Figs. 2 and 3), which has also been found in phytolith analysis from other agricultural fields (Ball et al., Reference Ball, Chandler-Ezell, Dickau, Duncan, Hart, Iriarte, Lentfer, Logan, Lu, Madella, Pearsall, Piperno, Rosen, Vrydaghs, Weisskopf and Zhang2016). While we did find some maize phytoliths (large type 1 crosses) in the agricultural fields, they were not very abundant. Interestingly, maize phytoliths were not limited to field that grew maize at the moment of sampling but also in some other fields, this thus might indicate the act of crop switching on several of the sampled fields. In the agricultural field sites, we are also unsure of how much plant material is harvested and removed, and how much of the soil surface is overturned, which may affect the phytolith assemblages and low abundances of maize phytoliths. Large differences in the total concentrations of the agricultural fields were found, implying that some fields may have more material removed than others (e.g. mechanised versus non-mechanised removal of plant material).
Our results demonstrate that phytolith assemblages in the Netherlands reflect environmental variability and heterogeneity and would thus be a valuable tool in reconstructing environmental change through time. While humans have impacted modern ecosystems drastically, our results are still applicable to past vegetation reconstructions since we characterise major vegetation types by large differences in phytolith composition and not by specific amounts (percentages of concentrations) of phytoliths per vegetation type. This method thus results in a robust characterisation of phytolith compositions in forests, wetlands and agricultural fields in the Netherlands, and in similar systems in north-western Europe.
Pollen is the most common microfossil used in qualitative and quantitative palaeoecological reconstructions of vegetation change (e.g. Birks et al., Reference Birks, Felde and Seddon2016a; Birks et al., Reference Birks, Felde, Bjune, Grytnes, Seppä and Giesecke2016b; Weng et al., Reference Weng, Hooghiemstra and Duivenvoorden2007). Phytoliths, however, can preserve in palaeoecological archives where pollen or macrofossils or macrofossils degrade via oxidation (Piperno, Reference Piperno2006). Pollen and phytoliths can be analysed together to provide several complementary aspects of past vegetation change as has been demonstrated in other parts of the world (e.g. Åkesson et al., Reference Åkesson, McMichael, Raczka, Huisman, Palmeira, Vogel, Neill, Veizaj, Bush and de Lafontaine2021, Gao et al., Reference Gao, Jie, Wang, Liu, Liu, Li, Li, Shi and Leng2018; Gao et al., Reference Gao, Jie, Li, Li, Liu, Liu, Leng, Wang, Liu and Li2019). Pollen provides signals of regional vegetation whereas phytoliths provide signals of local vegetation. Pollen can be used to identify the major tree species in a landscape, but cannot distinguish various types of grasses (Poaceae) or sedges (Cyperaceae) to a degree that can be achieved with phytoliths. While phytoliths give the same local vegetation signal as macrofossils, they can be especially useful when macrofossil analysis is not possible. For example, when too little material is available for this type of research or when no macro remains are preserved in the soils or sediments. The optimal scenario of capturing local and regional vegetation changes from the same site would be through a combination of phytolith, pollen and macrofossil analyses.
Conclusions
Our study demonstrates the practicality of the use of phytoliths in soils and sediments for palaeoecological research in the Netherlands. Distinct phytolith assemblages have been shown to distinguish between major vegetation types: forests (characterised by high amounts of arboreal phytoliths and lower amounts of several grass phytoliths), wetlands (characterised by higher amounts of Cyperaceae, Asteraceae and some grass phytoliths) and agricultural fields (characterised by lower amounts of arboreal phytoliths and higher amounts of grass and crop phytoliths). In addition, differences between wetland types and forest types were found. Phytoliths can be especially useful to reconstruct local vegetation in combination with macrofossils, or when macrofossil analysis is not possible. We suggest that future palaeoecological analyses should use all three proxies when possible to detect and quantify local and regional vegetation and past agricultural practices. The multiproxy approach can be used to achieve a more comprehensive assessment of local and regional vegetation and environmental change.
Acknowledgements
We would like to thank Klaas Land and Evelien van Maarseveen for assisting with sample collection.
Appendix A
The NMDS carried out over the concentrations showed a slightly different result. While samples of agricultural fields form a dense cluster again, it does overlap with wetlands on the first axis and forests on the second axis. Samples from forests are spread out over nearly the entire range of the second axis, thus having overlap with both other groups, but can all be found on the centre-left side of the first axis. Wetlands are even more distributed over the first axis and are the most distributed of all three groups, they can be seen on across the full range of the first axis and the complete bottom half of the second axis, thus having overlap with both other groups.

Fig. A1. NMDS of phytolith samples. The NMDS is carried out using the concentrations (phytoliths/1 cm3 soil) of each morphotype (stress = 0.1324). A: overall result of the NMDS, blue dots represent the samples taken from wetlands, the green dots the samples taken from forests and the yellow dots the samples taken from agricultural fields. The circles show the centre of the different clusters. B–E: within variation of the different vegetation types: B – agricultural fields, C – forests (forest type based on Schaminée et al. (Reference Schaminée, Sykora, Smits and Horsthuis2010), D – forests (most commonly occurring tree species), E – wetlands.
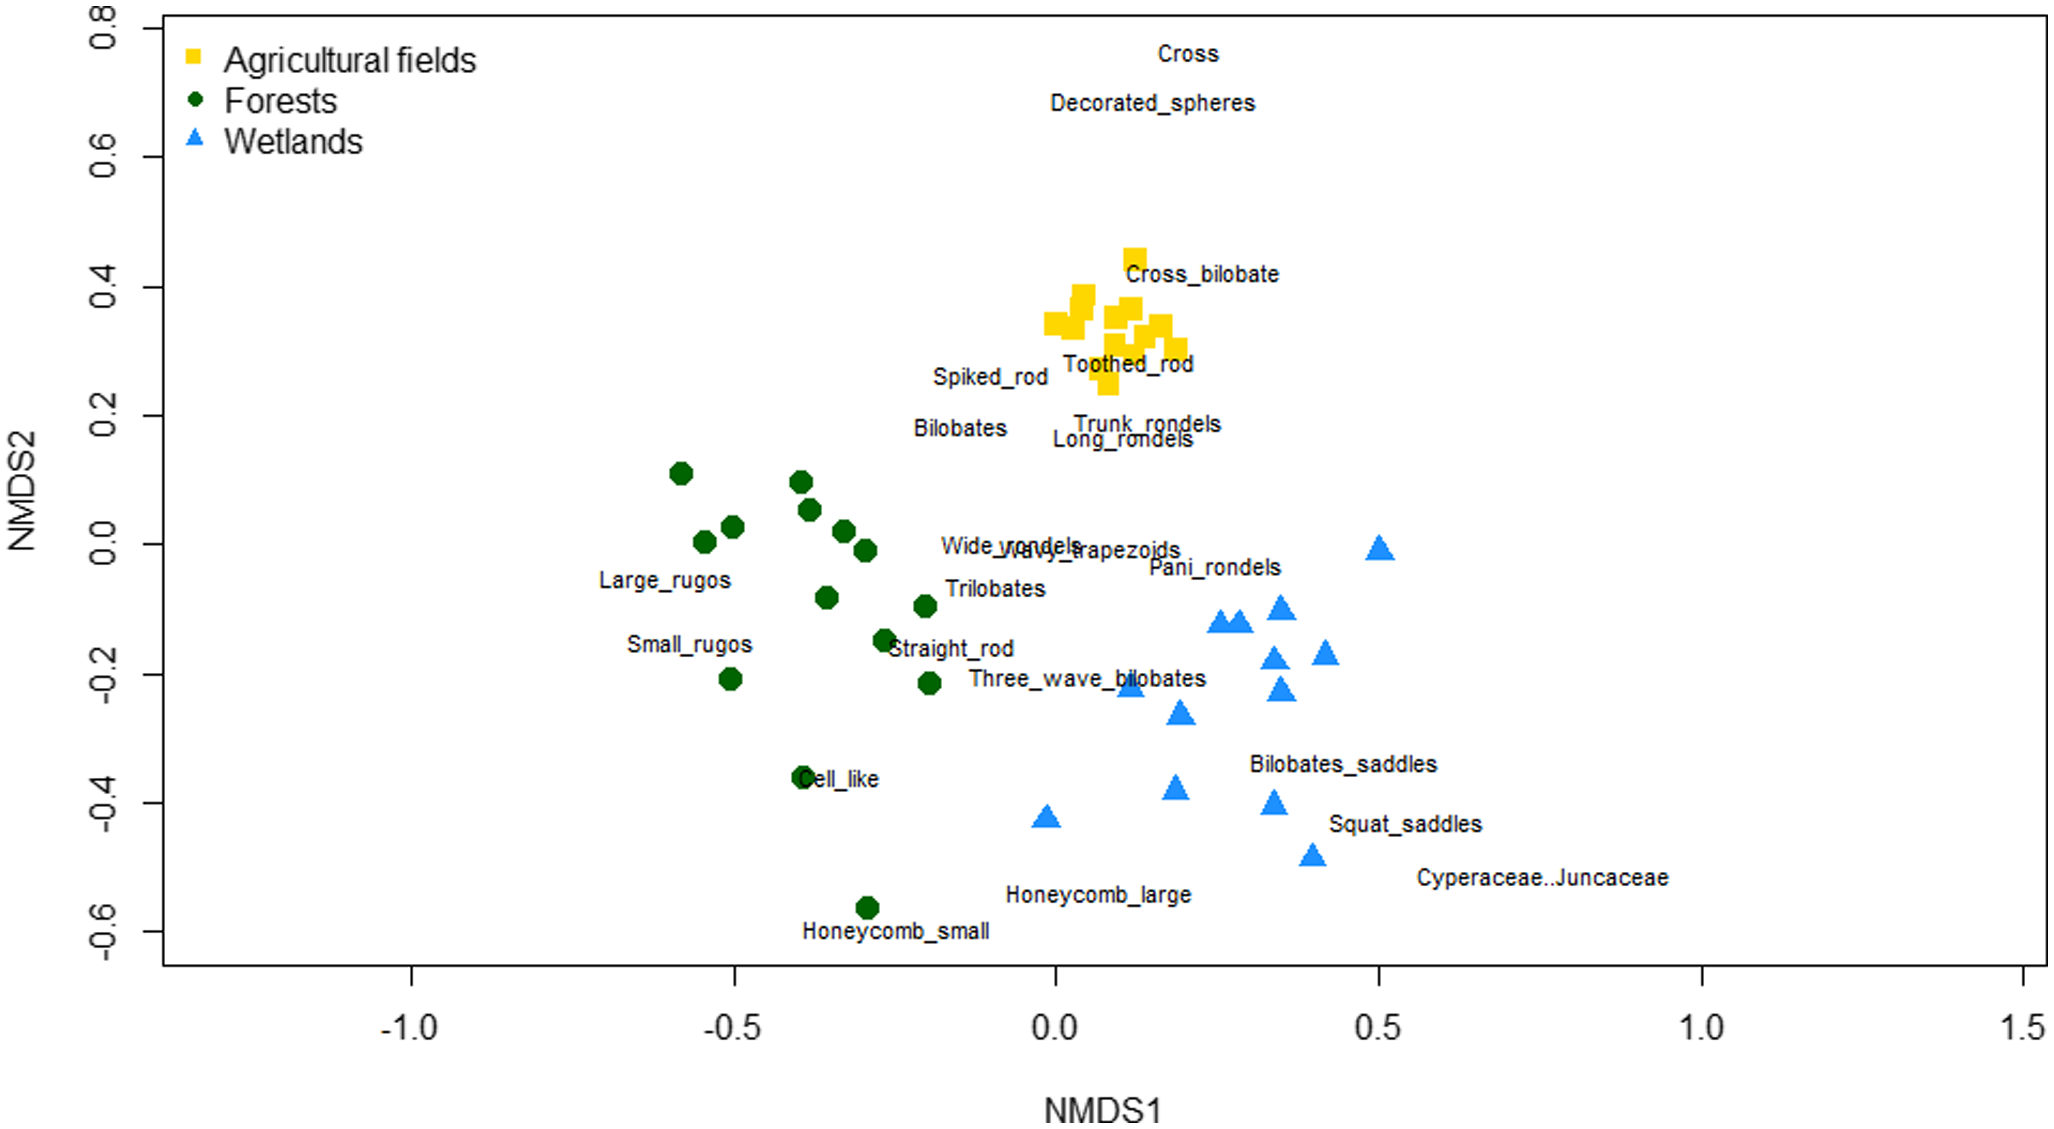
Fig. A2. NMDS with ordination scores of different phytolith morphotypes. NMDS carried out over the percentages of each morphotype (stress = 0.1459). Samples from agricultural fields are shown in grey squares, samples from wetlands in grey triangles. Samples from forests are categorised by the most commonly occurring tree species in the area.
Table A1. P-values of ANOVAs of the separate morphotypes. All extracted p-values from the ANOVAs (both percentages and concentrations) between the different vegetation types for each morphotype are shown.
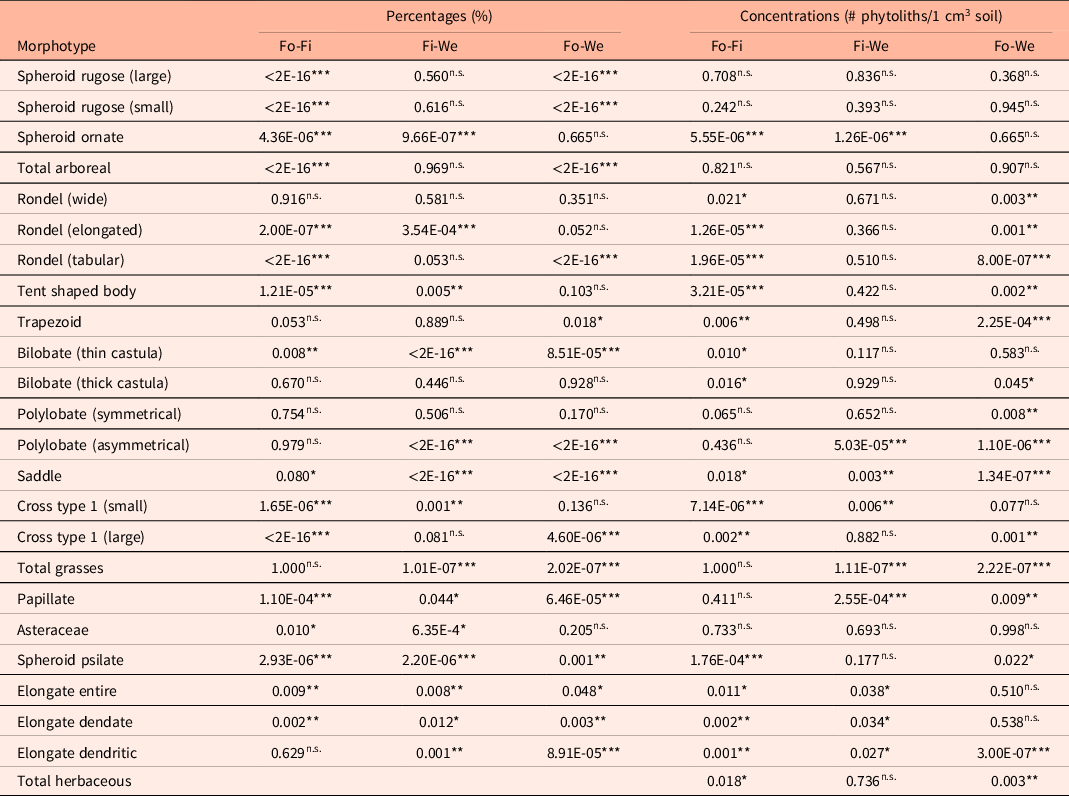
Abbreviations: Fo–Fi: forests vs. fields; Fi–We: fields vs. wetlands; Fo–We: forests vs. wetlands.
***p < 0.001; **p < 0.01; *p < 0.05; n.s. p > 0.05.
Table A2. Mean ± SD of the percentages and concentrations of the separate phytolith morphotypes. All extracted means and standard deviations (both percentages and concentrations) of each morphotype are shown.


 Open access