


Marfan syndrome is an autosomal dominant inherent disorder of connective tissue, affecting approximately 2–3 in 10,000 individuals. Reference Judge and Dietz1 It is characterised by abnormalities in the musculoskeletal, cardiovascular, and ocular systems caused by a mutation in the fibrillin-1 gene. Marfan syndrome is a clinical diagnosis based on the Ghent criteria because of its variable clinical manifestation, both between and in families. Reference Loeys2 One of the most important criteria in the diagnosis of Marfan syndrome is aortic root dilation.
Aortic dilation is usually located at the sinus of Valsalva in patients with Marfan syndrome (Fig 1). This typical location is partly a result of the ectodermal origin of the aortic root Reference Apter3 and the high pressures generated by the left ventricle. Reference Roman4 One of the major complications of Marfan syndrome is aortic dissection. Reference Ammash, Sundt and Connolly5 The occurrence of type A dissection is mainly determined by the degree of aortic dilation. Patients with the largest aortic diameter account for the highest risk of dissection. Reference van Kimmenade6 The combination of a high incidence of aortic dilation and the life-threatening risk of aortic dissection necessitates accurate diagnosis, follow-up, and timing of medical and surgical treatment. Therefore, reliable and reproducible measurements are crucial.
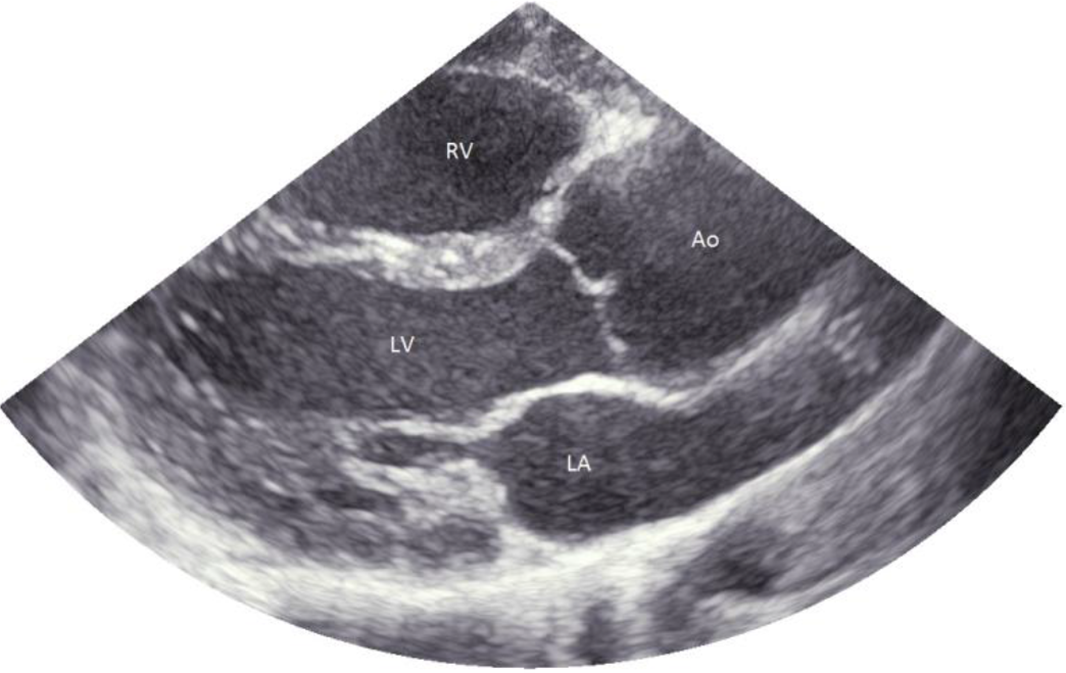
Figure 1. Aortic root dilation in a patient with Marfan syndrome. Ao = aorta; LA = left atrium; LV = left ventricle; RV = right ventricle.
In paediatric echocardiography, measurements of cardiac structures require normalisation to body size for interpretation. The most commonly used method to correct for body size is calculating Z-scores based on body surface area. Likewise, the revised Ghent nosology has adopted Z-scores in their definition of aortic root dilation. Over the years, different nomograms have been published. The Z-score calculator from the Marfan Foundation 7 is based on the publication by Colan et al, Reference Colan8 but their website also refers to three other publications on aortic root Z-score calculations. Reference Pettersen9–Reference Rozendaal11 The Marfan guideline even refers to a fifth nomogram. Reference Roman12 However, the methods to measure aortic dimensions used in these publications differ in timing (i.e. during diastole versus systole), edge (i.e. inner edge to inner edge versus leading edge to leading edge), and technique (i.e. M-mode versus 2D-mode). Furthermore, the populations in which the aortic dimensions were studied differed (i.e. healthy children, both healthy children and adults, children suspected of Marfan syndrome). Finally, the image quality of current cardiovascular ultrasound systems has improved substantially over the past decades. Recently, the Pediatric Heart Network has published new echocardiographic Z-scores, which are based on a large population of children (3215) who were measured according to the recommendations of the American Society of Echocardiography. Reference Lopez13,Reference Lopez14
The aim of the present study was to assess the potential differences in aortic root measurements when aortic root Z-scores were obtained in a cohort of paediatric Marfan patients using several published nomograms.
Methods
Rationale nomogram selection
In accordance with the recommendations of the American Society of Echocardiography, Reference Lopez13 only studies with nomograms based on 2D-measurements of the aortic root were included in this study. Therefore, the echocardiographic nomograms by Rozendaal et al Reference Rozendaal11 and Roman et al Reference Roman12 were not analysed in the present study for calculating aortic Z-scores, because they are based on M-mode measurement, Reference Rozendaal11 or included only a small number of children. Reference Roman12 The echocardiographic nomograms of Lopez et al, Reference Lopez14 Pettersen et al, Reference Pettersen9 Gautier et al, Reference Gautier10 and Colan et al Reference Colan8 fulfilled all inclusion criteria and were selected for this study.
Study design and population
This was a single centre retrospective study. We randomly selected 100 Marfan patients (aged 2–18 years) who were routinely being followed at our Marfan Clinic of the Radboud University Medical Center. Patients under the age of 2, or those with a history of aortic root surgery, were excluded. Furthermore, care was taken to include only patients with high-quality parasternal long-axis views in whom the aortic walls were visible during both systole and diastole. The diagnosis of Marfan was based on the revised Ghent criteria. Reference Loeys2 Height and weight were measured at the time of the echocardiographic examination. Body surface area was calculated in two ways. First, it was calculated according to Du Bois and Du Bois, Reference Du Bois and Du Bois15 which was used by Pettersen et al Reference Pettersen9 and Gautier et al. Reference Gautier10 Second, body surface area was calculated according to Haycock, Reference Haycock, Schwartz and Wisotsky16 which was used by Lopez et al Reference Lopez14 and Colan et al. Reference Colan8
Echocardiography
Echocardiographic examination was performed using a General Electric Vivid E9 ultrasound system. All measurements were made by a single qualified paediatric cardiac sonographer. Twenty randomly selected patients were measured by two different observers to obtain interobserver variability. Parasternal long-axis was used to measure the aortic root diameters at three levels (i.e. aortic annulus, sinus of Valsalva, and sinotubular junction). The aortic root diameters were measured as described in the echocardiographic nomogram publications. Reference Colan8–Reference Gautier10,Reference Lopez14 In brief, the aortic annulus was measured from hinge point to hinge point during systole in all nomogram publications. However, the sinus of Valsalva and the sinotubular junction were measured using two different methods; inner edge to inner edge in maximum systole (according to Pettersen et al, Reference Pettersen9 Colan et al, Reference Colan8 and Lopez et al Reference Lopez14 (Fig. 2a)) and leading edge to leading edge in diastole (according to Gautier et al Reference Gautier10 (Fig. 2b)).
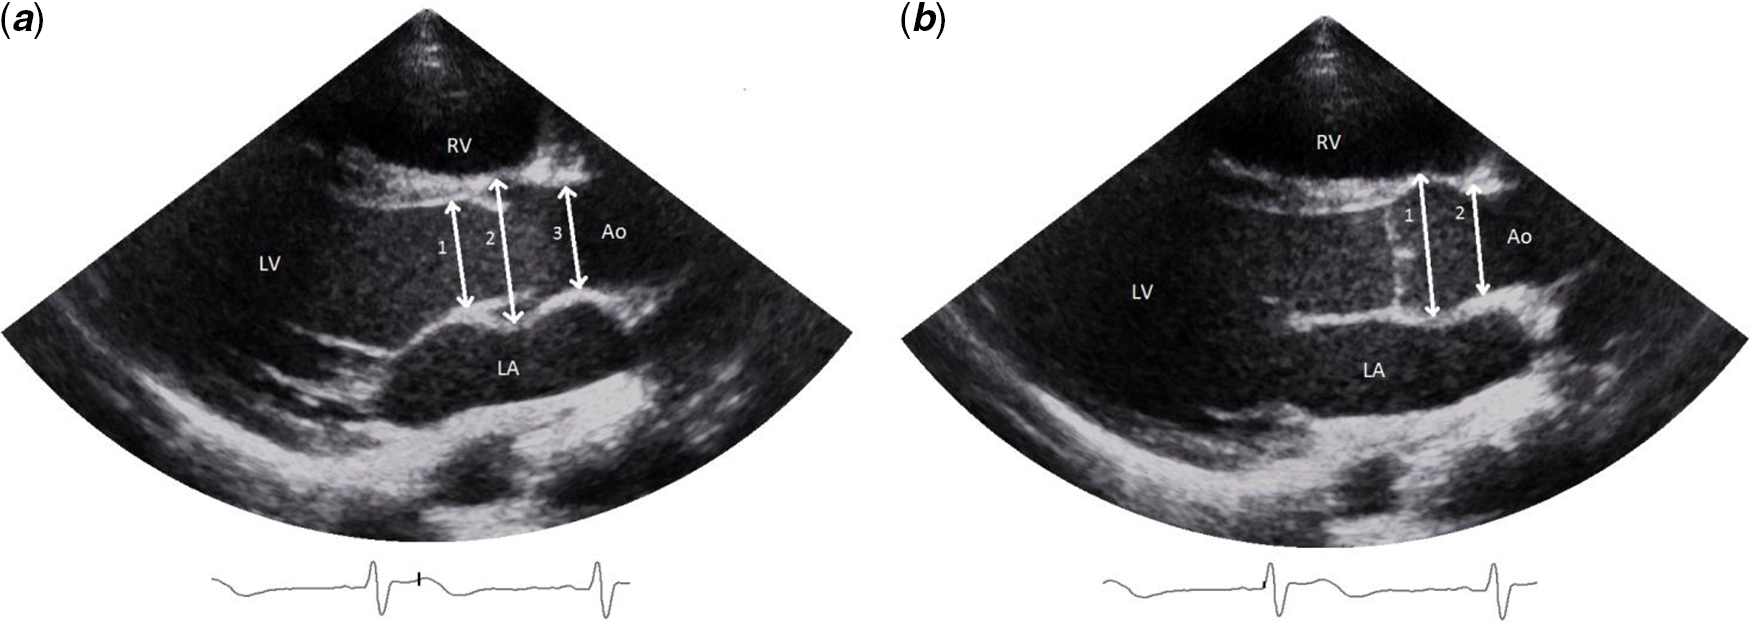
Figure 2. ( a ) (left): aortic annulus (1) measured according to all nomograms studied. Reference Colan8–Reference Gautier10,Reference Lopez14 Sinus of Valsalva (2) and sinotubular junction (3) measured according to Pettersen et al, Reference Pettersen9 Colan et al, Reference Colan8 and Lopez et al. Reference Lopez14 ( b ) (right): Sinus of Valsalva (1) and sinotubular junction (2) measured according to Gautier et al. Reference Gautier10 Ao = aorta; LA = left atrium; LV = left ventricle; RV = right ventricle.
Statistical analysis
Z-scores of the aortic root diameters were calculated using the calculation methods of Pettersen et al, Reference Pettersen9 Gautier et al, Reference Gautier10 Colan et al, Reference Colan8 and Lopez et al Reference Lopez14 One-way analysis of variance was performed to test for any statistical differences in mean Z-scores between the nomograms. Bland–Altman plots were used to assess the agreement between two different methods. The percentage of patients fulfilling the criteria of aortic root dilation was compared between the nomograms. Interobserver variability was measured using intraclass correlation coefficients based on a single measures, absolute agreement, two-way mixed-effects model. A significance level of 0.05 was used.
Regression equations
The regression equations are given in Table 1. Colan et al Reference Colan8 did not publish the equation for the sinotubular junction. Pettersen et al, Reference Pettersen9 Gautier et al, Reference Gautier10 Colan et al, Reference Colan8 and Lopez et al Reference Lopez14 have all chosen body surface area as an independent variable. Lopez et al Reference Roman12 indexed the measurements with nonlogarithmic body surface area transformations. Pettersen et al Reference Pettersen9 performed a logarithmic transformation using the natural logarithm on the measurements to correct for heteroscedasticity (the larger the body surface area, the larger the variance) and proposed a polynomial model to the third power after testing several nonlinear models. Gautier et al Reference Gautier10 proposed gender-specific equations following a loglog model. The standard deviation is represented by a constant for all models, except Colan et al. Reference Colan8
Table 1. Summary of Z-score calculation methods of Pettersen et al, Reference Pettersen9 Gautier et al, Reference Gautier10 Colan et al, Reference Colan8 and Lopez et al. Reference Lopez14
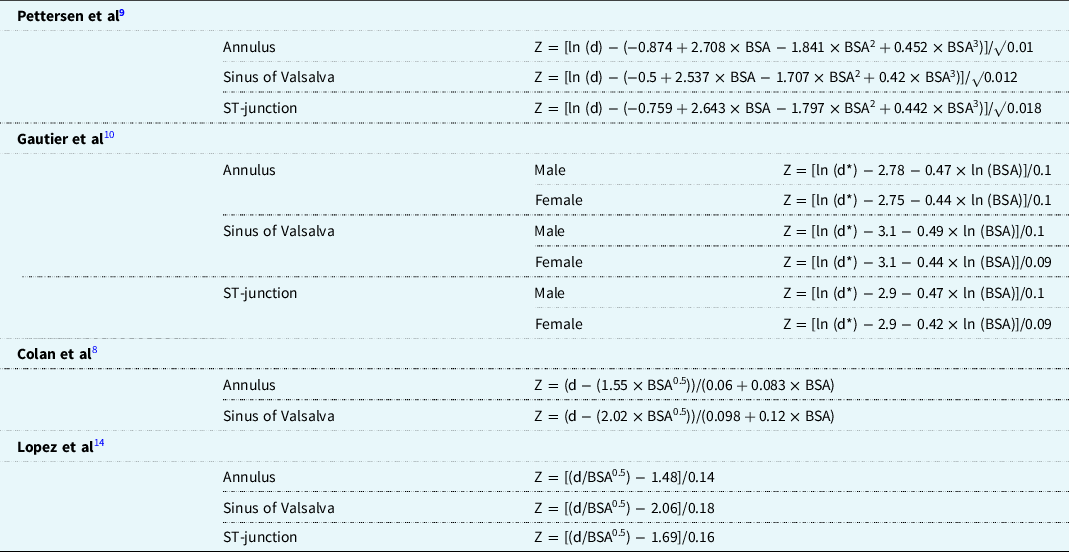
d = parameter (cm) d* = parameter (mm); ST = sinotubular.
Results
Patient characteristics
Patient characteristics are given in Table 2. Fifty-two percentage of the patient population were males. Their mean age (standard deviation) was 10.4 years (4.0), mean height was 155.6 cm (26.7), and mean weight was 43.0 kg (19.7).
Table 2. Patient characteristics of the study population reported as number (percentage) or mean (standard deviation)

Application of Z-score equations in study population
The highest mean Z-score (standard deviation) for the sinus of Valsalva was found for Lopez et al, Reference Lopez14 followed by Colan et al, Reference Colan8 Pettersen et al, Reference Pettersen9 and Gautier et al Reference Gautier10 : 1.41 (1.72) versus 1.31 (1.39), 0.85 (1.23), and 0.60 (1.49), respectively. A one-way analysis of variance showed that the means of the nomograms statistically differ (F = 6.90, p < 0.01). Tukey’s test was used for post hoc analysis and showed that the mean Z-score for the sinus of Valsalva of Lopez et al Reference Roman12 was significantly higher than the mean Z-scores of Gautier et al Reference Gautier10 (p < 0.01) and Pettersen et al Reference Pettersen9 (p = 0.03). Furthermore, the mean Z-score for the sinus of Valsalva of Colan et al Reference Colan8 was significantly higher than the mean Z-score of Gautier et al Reference Gautier10 (p < 0.01).
Bland–Altman plots of the sinus of Valsalva Z-scores are shown in Figure 3; the plot of the annulus and sinotubular junction can be found in Figure A1 of the appendix. The Bland–Altman plot of Lopez et al Reference Lopez14 vs. Pettersen et al Reference Pettersen9 showed a clear upward pattern, namely for higher Z-scores of the sinus of Valsalva, the nomogram of Lopez et al Reference Lopez14 resulted in increasingly higher Z-scores compared to Pettersen et al. Reference Pettersen9 A similar pattern, although less steep, was observed when comparing Lopez et al Reference Lopez14 to Colan et al. Reference Colan8 Finally, when comparing Lopez et al Reference Lopez14 to Gautier et al, Reference Gautier10 the upward trend was less visible. Similar results were found for the annulus and sinotubular junction.
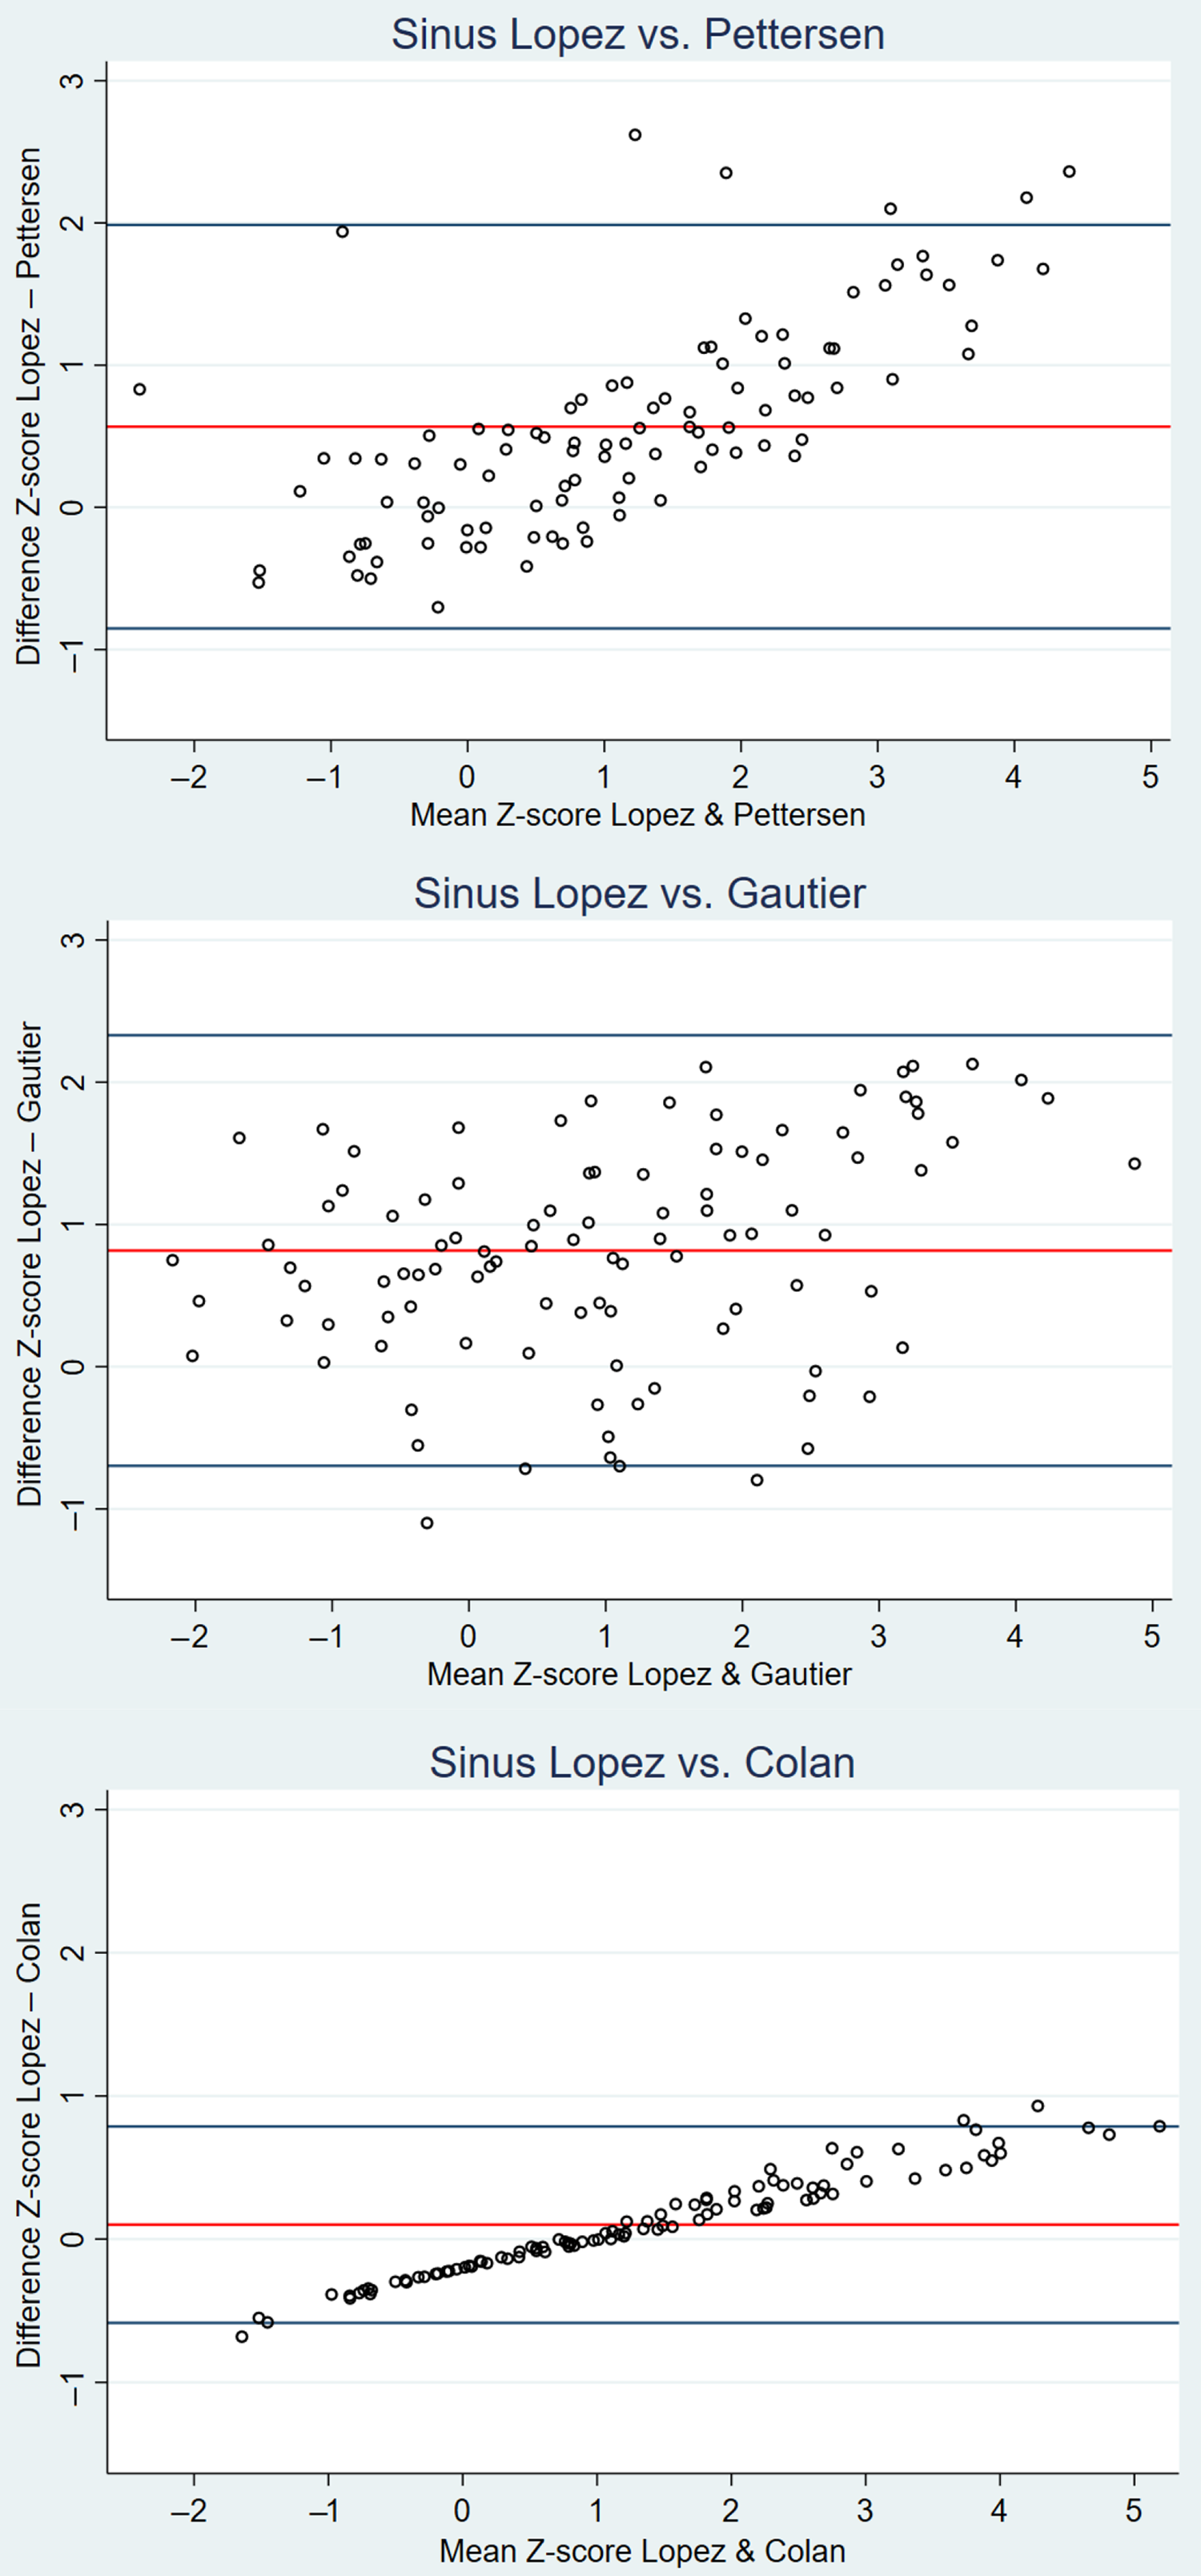
Figure 3. Bland–Altman plots of the mean differences in Z-scores of the sinus of Valsalva for the aortic root for Lopez et al Reference Lopez14 vs. Pettersen et al, Reference Pettersen9 Lopez et al, Reference Lopez14 vs. Gautier et al, Reference Gautier10 and Lopez et al Reference Lopez14 vs. Colan et al. Reference Colan8
Figure 4 shows a cumulative bar chart indicating the percentage of patients who would fulfil the diagnostic criteria of an aortic root dilation according to the three different nomograms. The use of Lopez et al Reference Lopez14 Z-scores would result in more patients being diagnosed with aortic root dilation compared to Gautier et al Reference Gautier10 and Pettersen et al Reference Pettersen9 35% of the studied patients would have a Z-score ≥ 2 using Lopez et al Reference Lopez14 compared to 20% for Pettersen et al, Reference Pettersen9 21% for Gautier et al, Reference Gautier10 and 33% for Colan et al. Reference Colan8
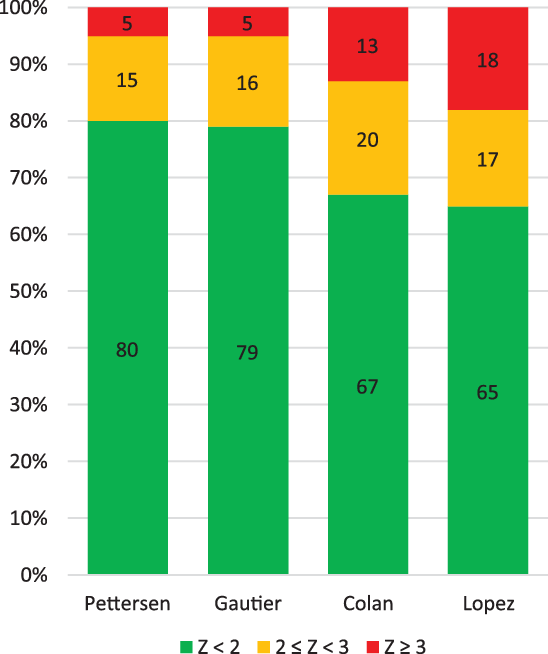
Figure 4. Cumulative bar chart showing the percentage of Marfan patients fulfilling the criterium of aortic root dilation.
When similar to Loeys-Dietz syndrome Reference Everitt17 surgical intervention would be indicated in patients with a Z-score > 3.5, the number of patients of eligible for surgery would differ significantly between the four nomograms, namely 0 patients according to Pettersen et al, Reference Pettersen9 1 patient according to Gautier et al, Reference Gautier10 8 patients according to Colan et al, Reference Colan8 and 14 patients according to Lopez et al. Reference Lopez14
Figure 5 shows the corresponding Z-scores of the sinus of Valsalva of the four studied nomograms for a wide range of sinus of Valsalva diameters in children with a body surface area of 0.5 m2, 1 m2, 1.5 m2, and 2 m2, respectively. Z-scores diverged strongest in patients with a relatively low or high sinus of Valsalva diameter. For all values of body surface area, children with a large sinus of Valsalva had a higher Z-score when using Lopez et al Reference Lopez14 or Colan et al Reference Colan8 compared with Pettersen et al Reference Pettersen9 or Gautier et al. Reference Gautier10
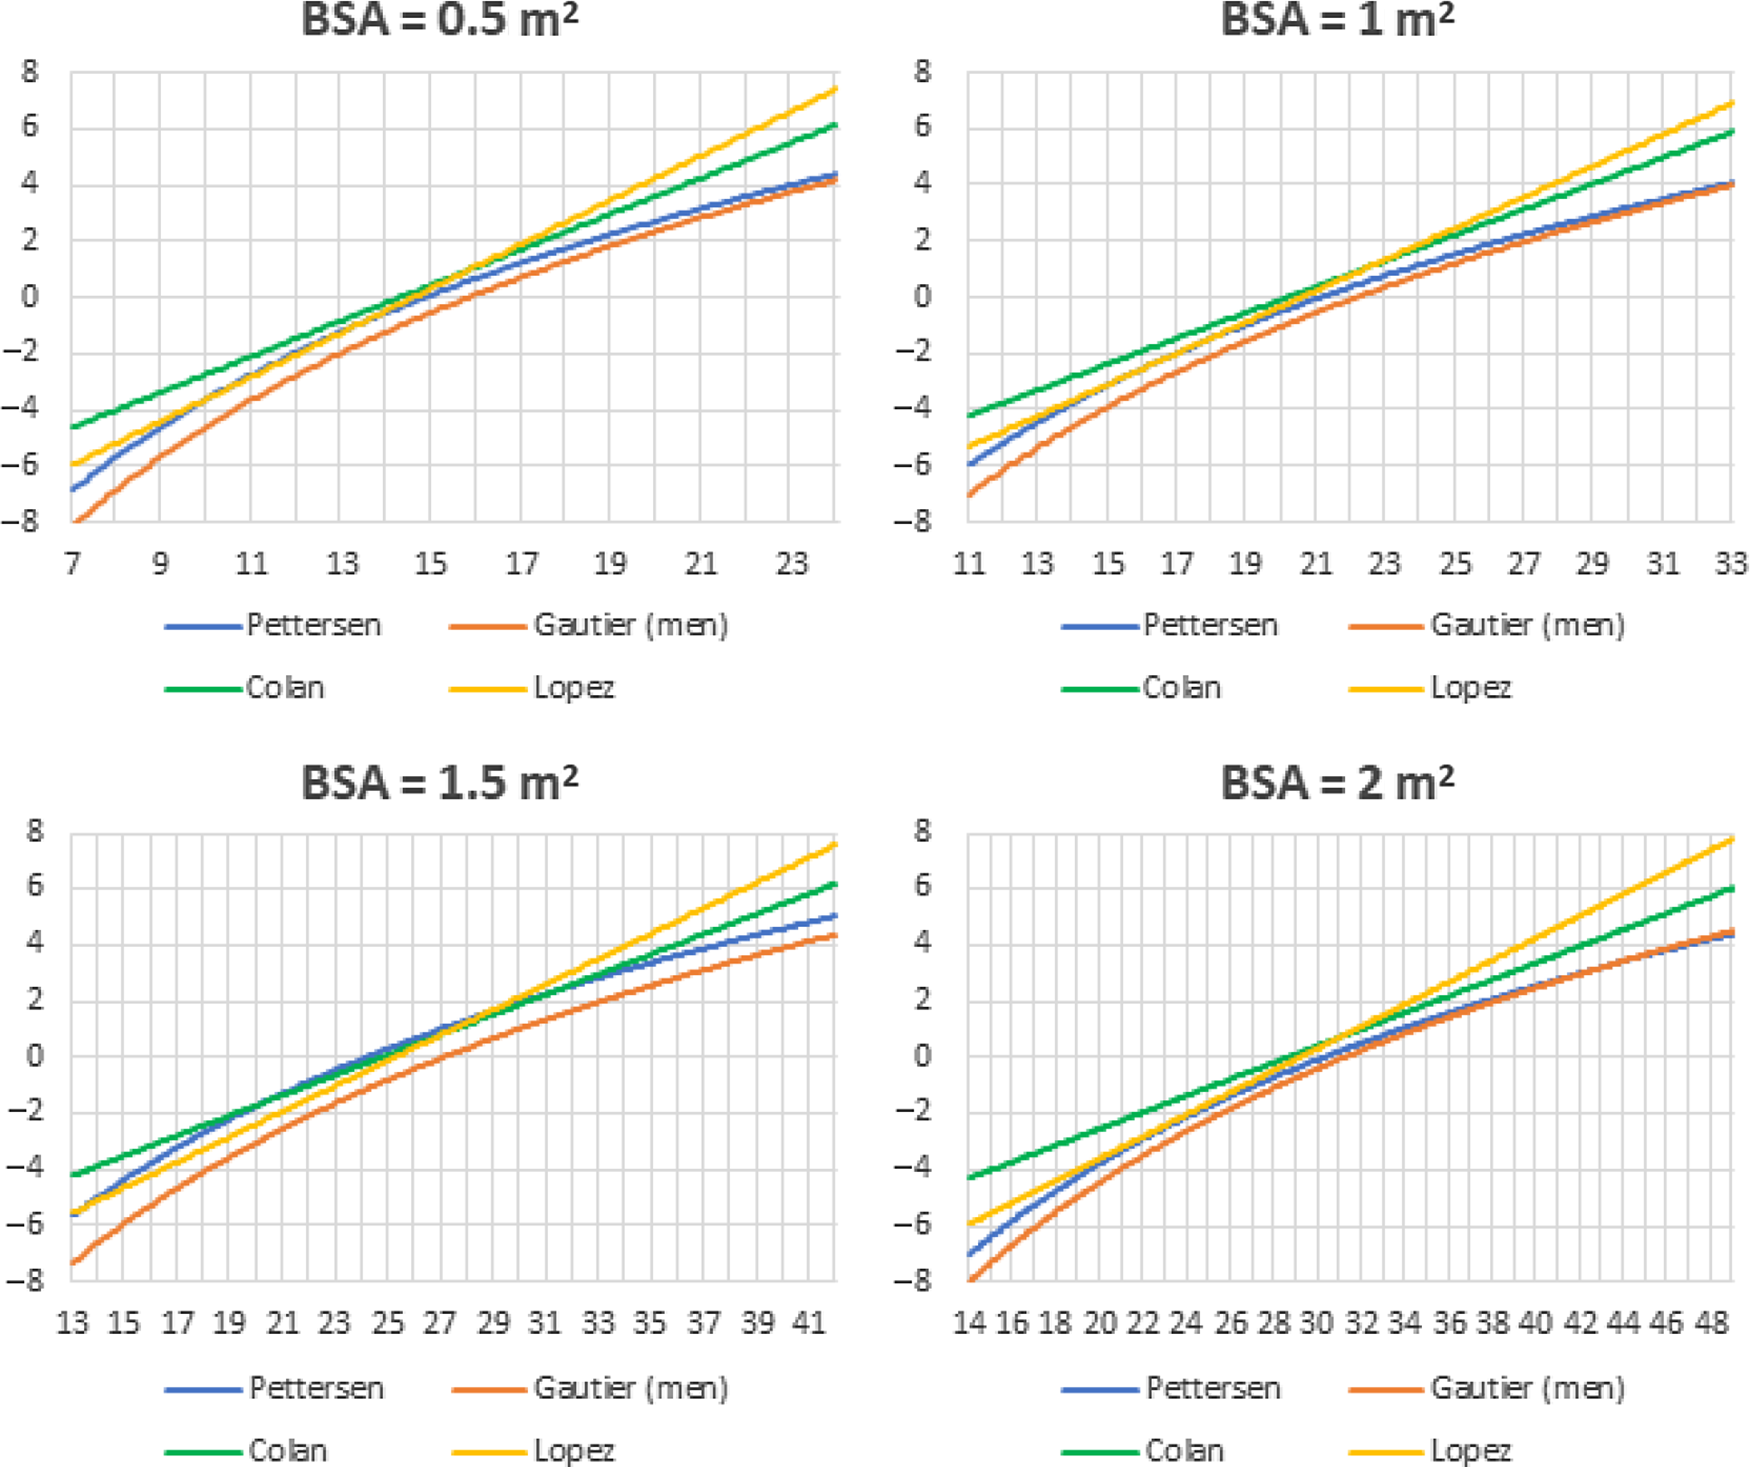
Figure 5. Z-scores for the sinus of Valsalva for the four nomograms for fictive patients with a BSA of 0.5 m2, 1 m2, 1.5 m2, and 2 m2
Interobserver variability was assessed using intraclass correlation coefficients. The intraclass correlation coefficient for the sinus of Valsalva showed a good to excellent reliability (inner edge to inner edge in systole 0.93 (95% confidence interval 0.84–0.97), leading edge to leading edge in diastole 0.93 (0.84–0.97)). The intraclass correlation coefficient for the annulus was 0.83 (0.63–0.93) and for the sinotubular junction 0.67 (0.35–0.86) inner edge to inner edge in systole and 0.78 (0.53–0.91) leading edge to leading edge in diastole.
Discussion
The use of Z-scores of aortic roots is crucial in the diagnosis and follow-up of children with Marfan syndrome. However, in clinical practice, different Z-scores are being used. In this study, it is demonstrated that there is a significant variation in Z-scores on an individual level, especially in children with a relatively large sinus of Valsalva. Furthermore, the number of patients with an enlarged aortic root (Z-score ≥ 2) was also substantially different between the different calculation methods. The recent Z-scores developed by Lopez et al Reference Lopez14 resulted in much higher Z-scores compared to the older calculations, especially when compared to Pettersen et al Reference Pettersen9 and Gautier et al. Reference Gautier10
Revision of the Ghent nosology emphasises aortic root dilation, expressed as an aortic root diameter with a Z-score ≥ 2.0. The adoption of Z-scores in the diagnostic criteria for Marfan syndrome underlines the importance of a reliable measuring and calculation method. The high incidence of aortic root dilation and the potentially life-threatening risk of aortic dissection necessitates a correct diagnosing, follow-up, and timing of aortic surgery.
An aortic root Z-score ≥ 2 is one of the two criteria in the absence of family history for Marfan. Therefore, this could lead to an increase in Marfan syndrome diagnoses of 1.75 (35/20) times when using the nomogram of Lopez et al Reference Lopez14 compared to Pettersen et al. Reference Pettersen9 In case of the presence of family history, a Z-score ≥ 3 is sufficient to be diagnosed with Marfan syndrome if a patient is below 20 years old. Following this guideline, the method used by Lopez et al Reference Lopez14 could result in an increase in Marfan syndrome diagnoses of 3.6 (18/5) times when compared to Pettersen et al. Reference Pettersen9 Furthermore, chirurgical intervention is indicated in patients with Marfan syndrome with an absolute aortic sinus diameter of 45–50 mm or greater. Reference Everitt17 However, if the guideline applicable to Loeys-Dietz syndrome would be also followed for patients with Marfan syndrome, surgical intervention would be indicated in patients with a Z-score > 3.5. The number of patients eligible for surgery would then differ significantly between the four nomograms, namely 0 patients according to Pettersen et al Reference Pettersen9 and up to 14 patients according to Lopez et al. Reference Lopez14 To conclude, the effects of the different nomograms on diagnosing Marfan syndrome and aortic surgery could be substantial.
According to the guidelines of the American Society of Echocardiography, aortic measurement should be made from leading edge to leading edge end-systole in adults, Reference Lang18 while in children measuring from inner edge to inner edge mid-systole is preferred. Reference Lopez13 Lopez et al, Reference Lopez14 Pettersen et al, Reference Pettersen9 and Colan et al Reference Colan8 follow these recommendations and use inner edge to inner edge measurements. Other imaging methods, like MRI and CT-scanning, use inner edge to inner edge techniques, making comparisons easier. Reference Lang18 Gautier et al Reference Gautier10 reported that during diastole the aortic pressure and thus aortic diameter are more stable, which enhances a greater reproducibility. The increase in diameter during systole can be up to 10% in healthy patients, which makes the measurement timing crucial.
Research Reference Sluysmans, Colan and Lai19 has shown that cardiac output and cardiac structures have a nearly linear relationship with body surface area, resulting in using body surface area for normalisation of cardiac structures in children. Different formulas are available for estimating body surface area, of which Du Bois and Du Bois’s formula Reference Du Bois and Du Bois15 is most commonly used. However, different articles have shown that Du Bois and Du Bois underestimates BSA in young children and, therefore, Haycock is preferred. Reference Haycock, Schwartz and Wisotsky16,Reference Sluysmans, Colan and Lai19
A different problem with body surface area is the non-constant variance of the range of body surface area, which is called heteroscedasticity. The variance rises as a function of body surface area, which is explained by factors as blood pressure and adiposity. These factors have a greater influence at a higher body surface area. Reference Sluysmans, Colan and Lai19 Both Pettersen et al Reference Pettersen9 and Gautier et al Reference Gautier10 used a form of logarithm transformation as a method of dealing with heteroscedasticity. However, testing for residual heteroscedasticity was not mentioned. If present, this could lead to over- or underestimation of the variance for parts of the population, eventually resulting in biased Z-scores. Reference Mawad20 Lopez et al Reference Lopez14 and Colan et al Reference Colan8 have dealt with the problem of heteroscedasticity by indexing the measurements for body surface area, which reduced the non-constant variance enough to be no longer significant.
The method of Gautier et al Reference Gautier10 is not preferred because they used the smallest number of children (353) and only included children aged 2 years and older, resulting in nomograms validated for a body surface area of ≥0.5 m2. In the range of 0.5–0.69 m2, only three children were included, which resulted in a less usable nomogram for young children. Lastly, measurements were made from leading edge to leading edge, which is contrary to the guidelines of the American Society of Echocardiography. Reference Lopez13
Likewise, Pettersen et al Reference Pettersen9 included only a limited number of children (782), and the problem of heteroscedasticity was not addressed. Furthermore, there was no Z-score calculation for ascending aorta diameter. Finally, as stated before, body surface area was calculated using the method of Du Bois and Du Bois, while the method of Haycock is preferred. Reference Haycock, Schwartz and Wisotsky16,Reference Sluysmans, Colan and Lai19
The model used by Colan et al Reference Colan8 is theoretically supported by the principle of minimum work and tested empirically afterwards. In contrast to Gautier et al Reference Gautier10 and Pettersen et al, Reference Pettersen9 the absence of heteroscedasticity was tested for. However, this study also included only a small sample of children (496) and is relatively old (2006). The image quality of current cardiovascular ultrasound systems has improved over recent years.
Lopez et al Reference Lopez14 included 3215 healthy North American children ranging in age from 1 day to 18 years and used inner to inner edge measurements in systole. The same underlying theoretical approach as proposed by Colan et al Reference Colan8 was used. Thirty-six study groups were formed based on 3 race, 6 age, and 2 sex categories to ensure a good distribution of patients. The effects of age, sex, race, and ethnicity were tested for, but were found to be clinically insignificant.
This current study has shown that, in individual patients, the different nomograms can lead to clinically relevant differences in Z-scores. This is an important conclusion to keep in mind when using these nomograms for the diagnosis and follow-up of patients with Marfan syndrome and it underscores the need for a universal approach of measuring and calculating Z-scores. We believe that the nomogram of Lopez et al Reference Lopez14 is preferable for the assessment of Z-scores of the sinus of Valsalva in children diagnosed with Marfan because measurements are made in accordance with the paediatric guideline, Reference Lopez13 an underlying theoretical approach is used and heteroscedasticity has been solved correctly.
Recently, other new nomograms have also been published. Cantinotti et al Reference Cantinotti21 included 1151 Caucasian children with a body surface area ranging from 0.12 to 2.12 m2. Measurements were made using 2D echocardiography in maximum systolic dimension, following recommendations of the American Society of Echocardiography. Reference Lopez13 However, only 5.3% of the included patients had a body surface area ≥ 1.5 m2, while children with Marfan are known to have a large body surface area.
The difficulty in using Z-scores based on body surface area in children with Marfan is that these children often have different anthropometric measurements. Nomograms are based on healthy children, who could have a large body surface area due to a greater height or being overweight. The use of an adjusted nomogram rather than a standard nomogram seems appropriate for routine clinical screening in this specific group of patients with deviant body surface areas. Reference Rozendaal11 As long as no normal values for Marfan patients according to the current guidelines are available, the use of the Lopez et al Reference Lopez14 Z-scores for the routine screening and follow-up of Marfan patients is suggested.
The major drawback of the current study is that it is impossible to determine the exact clinical consequences of the use of the different nomograms in the diagnosing and surgical intervention of individuals. Furthermore, it would be interesting to study the effects of the different nomograms in patients with other connective tissue disorders, such as the Ehlers-Danlos syndrome.
Conclusion
The use of different nomograms for calculating Z-scores of aortic dilation in children with Marfan syndrome could lead to clinically relevant variations on an individual level. Especially in children with a relatively large aortic root diameter, the differences were significant. The Z-scores for Lopez et al Reference Roman12 that were recently published are in line with the recommendations of the American Society of Echocardiography and fulfill important criteria, but they do result in higher Z-scores for the sinus of Valsalva when compared to the existing nomograms. This could lead to more patients being diagnosed with Marfan and could also have impact on the medical and surgical treatment of these patients.
Supplementary material
To view supplementary material for this article, please visit https://doi.org/10.1017/S1047951121001311
Acknowledgements
None.
Financial support
This research received no specific grant from any funding agency, commercial, or not-for-profit sectors.
Conflicts of interest
None.
Ethical standards
The authors assert that all procedures contributing to this work comply with the ethical standards of the Dutch guidelines on human experimentation and with the Helsinki Declaration of 1975, as revised in 2008. Because no interventions or extra measurements were performed and only anonymized routinely collected data were used, the Medical Research Involving Human Subjects Act (WMO) was not applicable.


 Open access