

What explains unequal representation in contemporary democracies? In the wake of rising economic inequality, a recent literature has cumulated evidence that legislators in representative institutions, ranging from the US Congress to legislative assemblies in Europe and Latin America, are more responsive to (or more congruent with) the preferences of high-income constituents and business interests than to the preferences of those with average incomes and particularly the poor (e.g., Bartels Reference Bartels2008; Elsässer, Hense, and Schäfer Reference Elsässer, Hense and Schäfer2017; Gilens Reference Gilens2012; Gilens and Page Reference Gilens and Page2014; Lupu and Warner Reference Lupu and Warner2022a; Mathisen et al., volume; but see Elkjær and Iversen Reference Elkjær and Iversen2020). However, there is no consensus on the main mechanisms driving unequal representation. Surprisingly divergent views are combined with only limited evidence on the impact of organized interests on political inequality in legislatures.
In this chapter, we start by reviewing the scholarly debate and identify a central area of disagreement about the relative importance of interest groups and the mechanism through which they shape substantive political inequality. Then, we present a synthetic model that captures a representative democracy with organized interests that can seek to influence policy through electoral selection and postelectoral lobbying. We use the model to derive positive implications on the context-varying nature of interest group influence and to clarify the challenges faced by scholars trying to uncover interest group influence and to unbundle competing mechanisms using empirical observations.
Broadly speaking, a fundamental difference among theories of unequal democracy is their relative emphasis on electoral selection or postelectoral influence as drivers of unequal representation. Prominent explanations that take an electoral selection perspective include partisan differences and descriptive representation (Bartels Reference Bartels2008; Carnes Reference Carnes2013; Carnes and Lupu Reference Carnes and Lupu2015; Curto-Grau and Gallego, this volume; Mathisen et al., this volume; Rhodes and Schaffner Reference Rhodes and Schaffner2017). This analytical perspective focuses scholars’ attention on explaining unequal influence over election outcomes (e.g., based on campaign finance, electoral laws, organized labor, or voter psychology). Alternative explanations highlight the importance of postelectoral channels of influence and focus on lobbying, broadly construed (Flavin Reference Flavin2015b; Hacker and Pierson Reference Hacker and Pierson2010; Hertel-Fernandez, Mildenberger, and Stokes Reference Hertel-Fernandez, Mildenberger and Stokes2019; Kelly et al. Reference Kelly, Morgan, Witko and Enns2019).
Interest groups may influence political representation through both channels, electoral selection and postelectoral influence. But we know little about the relative importance of these two channels. Moreover, there is no agreement on the overall contribution of interest groups to political inequality. A better understanding of possible mechanisms provides foundations for studying the total impact.
One the one side, organized groups that represent business interests and high-income professionals are an important explanation for why policy outcomes deviate substantively from the preferences of average citizens. This perspective is called Biased Pluralism (Gilens and Page Reference Gilens and Page2014). While direct tests are still rare, the study of Gilens and Page (Reference Gilens and Page2014) covers nearly two thousand policy issues in the United States. It concludes that organized interests have a substantial impact on public policy, beyond the preferences of average citizens and economic elites, and that this is especially pronounced for business-oriented groups. Related research on legislative voting rather than policy adoption uses an instrumental-variable approach and finds evidence that labor unions can dampen the pro-rich bias in the US Congress (Becher and Stegmueller Reference Becher and Stegmueller2021). The view that organized interests matter for political equality is of course not restricted to American politics. Mancur Olson’s theory of collective action implies that narrow, concentrated interests are more likely to be represented in the interest group universe than broad-based groups of citizens (Olson Reference Olson1965). It is not hard to find scholars of contemporary democracy in Europe who, after looking at the available data, are worried about biased pluralism. For example, recent comparative research shows that European campaign finance systems are unequal, benefiting the rich and corporations more than the poor through tax exemptions and other rules, and that higher campaign spending is linked to electoral results (Cagé Reference Cagé2020).
On the other side, the quantitative empirical literature on the role of money in politics has grappled with the difficulty of showing that interest groups’ financial contributions affect legislative votes. Reviewing dozens of roll-call studies on the link between interest group contributions and legislative voting in the United States, Ansolabehere, Figueiredo, and Snyder (2003: 116) conclude that the evidence that financial contributions to candidates affect their votes “is rather thin.” Rather, based on their own analysis they conclude that “Legislators’ votes depend almost entirely on their own beliefs and the preferences of their voters and their party.” They add the methodological recommendation that scholars trying to assess the impact of money on votes using observational data should include legislator fixed effects to control for legislators’ own preferences, party, and constituency influence. By doing so, scholars are implicitly or explicitly trying to isolate a postelectoral channel of influence. However, this strategy can be problematic and lead to misleading inferences when electoral selection and postelectoral influence are complements.
We argue that electoral selection and postelectoral influence are likely to go hand in hand in polarized environments. Ignoring this complementarity, researchers may wrongly conclude that only electoral politics matters as a channel through which interest groups affect political equality in legislatures. This issue matters both for tests of positive theories of unequal democracy as well as normative evaluations. Without a better understanding of mechanisms, it remains difficult to devise strategies to mitigate substantive political inequality against the backdrop of economic inequality and populist challenges to democratic institutions.
We set forth our argument using a simple formal model that is then used to generate simulated legislatures. It captures a two-stage political process with an electoral and a postelectoral stage. The model assumes a political process where electoral influence and postelectoral influence are not perfect substitutes. An organized interest – whether pro-poor or pro-rich – aiming to shape policy has to first ensure that their preferred politician is elected. But the story does not end on election night. Legislators have a constrained agenda and will carefully choose which issues to prioritize even among those they principally agree with. So the organized group will also have to lobby (friendly) legislators (Austen-Smith and Wright Reference Austen-Smith and Wright1994; Hall and Deardorff Reference Hall and Deardorff2006).
Our model illuminates how the strategies of organized interests vary across context. When party polarization is relatively low, they can focus on swaying legislators through postelectoral lobbying. Increasing polarization incentivizes organized interests to focus some of their energy on helping to select like-minded politicians. However, lobbying will not be fully substituted by electioneering. Rather, when polarization is high, and with politicians facing competing demands, organized interests will have to engage in both activities. This leads to an important but largely neglected challenge for empirical research on unequal representation (and the related, but largely separate, literature on lobbying): what can be learned about mechanisms from the data alone might be limited by the strategic actions of political actors.
The problem of analyzing mechanisms is not simply due to confounding or omitted variable bias. Assume that a researcher can identify the causal effect of the group on legislative behavior (e.g., via an exogenous or instrumented measure of group strength, or a natural experiment). The key question then is how much of the treatment effect is due to electoral selection of a friendly legislator versus postelectoral lobbying. To empirically illustrate this point, we simulate thousands of possible legislatures arising from a known data generating process (our theoretical model) where without postelectoral lobbying legislators would not support an interest group’s preferred policy. We then apply statistical models commonly used in the literature and show that researchers risk drawing incorrect conclusions from such analyses, overstating the relevance of elections as a channel through which groups affect legislative responsiveness. Furthermore, we illustrate the issue using roll-call votes in the US House of Representatives.Footnote 1
Empirical research on lobbying usually faces the problem that postelectoral effort cannot be inferred from observable data. However, as we show in this chapter, our conclusion still stands even when researchers can fully observe postelectoral effort (or correct for the known lack of reliability of a measure). The reason is that the group lobbies friendly legislators. In equilibrium, the selection of a friendly legislature and lobbying can be highly (but not perfectly) correlated. Empirically, this leads to a form of simultaneity bias. As a result, based on standard empirical analyses, scholars may erroneously conclude that all that matters for unequal representation is electoral politics. Again, this empirical problem exists even though scholars can causally estimate the total effect of group power on legislative responsiveness.
Income and Legislative Responsiveness
The idea that all citizens should count approximately equally in the political process underpins various normative theories of democracy since antiquity (Müller Reference Müller2021). Political equality is conceived as the “equal advancement of interests” (Christiano Reference Christiano2008: 95) and is about substantive or de facto representation, not just equal political rights. This is what Dahl (Reference Dahl1971) calls equal responsiveness and the social choice literature calls the anonymity axiom. Political equality is a yardstick, not a prediction. Several positive theories of democratic politics suggest that pervasive socioeconomic inequalities can limit equality in policymaking. For example, interest groups’ monetary contributions can influence postelectoral policymaking (Grossman and Helpman Reference Grossman and Helpman2001) as well as electoral outcomes (Cagé Reference Cagé2020). In the wake of rising economic inequality (Lupu and Pontusson, this volume; Piketty Reference Piketty2014), political scientists and other social scientists have paid increasing attention to the implications of economic inequality for substantive political equality.
Building on pioneering research on the US Senate (Bartels Reference Bartels2008) and policy adoption in the United States (Gilens Reference Gilens2012), numerous studies have found evidence that elected policymakers in legislative assemblies are more responsive to the preferences of relatively rich constituents at the expense of middle-income and poor constituents (e.g., Elsässer, Hense, and Schäfer Reference Elsässer, Hense and Schäfer2017; Gilens Reference Gilens2016; Hertel-Fernandez, Mildenberger, and Stokes Reference Hertel-Fernandez, Mildenberger and Stokes2019; Kalla and Broockman Reference Kalla and Broockman2016a; Lupu and Warner Reference Lupu and Warner2022a; Mathisen et al. in this volume; Peters and Ensink Reference Peters and Ensink2015; Rigby and Wright Reference Rigby and Wright2013). Responsiveness here refers to the relationship between the opinions of constituents differentiated by income and legislative actions of officeholders, usually legislative votesFootnote 2, or the relationship between national public opinion differentiated by income and policy outcomes. When policy questions are polarized by income, many of these studies suggest that the views of the rich matter more, whereas the views of the poor matter little or not at all (but see Brunner, Ross, and Ebonya Reference Brunner, Ross and Ebonya2013; Elkjær and Iversen Reference Elkjær and Iversen2020). Perhaps not surprisingly, populist parties and politicians have capitalized on the perception that democracy favors the affluent (Müller Reference Müller2021).
The degree and relevance of unequal responsiveness is a matter of ongoing debate (Erikson Reference Erikson2015). One view is that elected representatives should not pander to the views of the largely uninformed public. Rather, good representatives ought to lead by making choices that are in the enlightened interest (however defined) of citizens. We agree with Federalist Paper 71 and game-theoretic models of pandering (Canes-Wrone, Herron, and Shotts Reference Canes-Wrone, Herron and Shotts2001) that there can be too much responsiveness. However, these models cannot justify complacency about unequal responsiveness in the democratic process that lies at the center of this volume and chapter. Many disagreements about policy between rich and poor citizens concern economic bread-and-butter issues and are based on differences in material conditions or ideals. Indeed, an established political economy literature predicts and documents rational sources of disagreement. For example, consider income redistributive policies, minimum wage increases, or stimulus spending in the wake of an economic depression. On these and similar economic issues, individuals in the United States and Europe with lower incomes are, on average, significantly more in favor of government action (Gilens Reference Gilens2009; Rueda and Stegmueller Reference Rueda and Stegmueller2019; Soroka and Wlezien Reference Soroka and Wlezien2008). Based on current textbook economics, one would be hard pressed to argue that citizens supporting these policies should somehow get less weight than citizens opposing them.
Assessing the degree of unequal responsiveness requires addressing challenging measurement and estimation issues that are discussed in more detail elsewhere (e.g., see Bartels in this volume). Our interpretation of the literature is that there is sufficient (if contested) evidence for the existence of unequal responsiveness to warrant investigation of its mechanisms.
Initial research on congressional or state-level representation in the United States was limited by small survey sample sizes, which poses the risk that estimates of unequal responsiveness are mostly due to sampling noise in the measures of (correlated) group preferences (Bhatti and Erikson Reference Bhatti, Erikson, Peter and Wlezien2011).Footnote 3 However, larger surveys, such as the Cooperative Election Study (CES, formerly the Cooperative Congressional Election Study), have reduced this problem. For instance, Bartels (Reference Bartels2016: Ch. 8) uses the 2010 and 2012 CES with more than 100,000 respondents and finds differential responsiveness in the Senate. Senators’ roll-call voting behavior is positively responsive to average constituent opinion, but this is mainly driven by responsiveness to the upper third of the income distribution. Bartels’ estimates imply that senators are five times more responsive to high-income than middle-income constituents and not at all responsive to low-income constituents. Subsequent work on the US House draws on additional CES waves and corrects for possible imbalances between the survey sample and district populations using micro-level census data (Becher and Stegmueller Reference Becher and Stegmueller2021). On average, the pattern in the House is very similar to the one found for the Senate by Bartels (Reference Bartels2016).
Field experimental research has added important insights by helping to identify in a more controlled fashion biases that tend to work against the poor and in favor of the affluent. Kalla and Broockman (Reference Kalla and Broockman2016a) find that legislators are more likely to meet donors than nondonors, which bolsters the argument that money buys access. Another study sends messages from (fictional) constituents to politicians, randomly varying name and ethnicity but keeping the same content (Butler Reference Butler2014). It reveals that politicians exhibit a significant socioeconomic bias when evaluating constituent opinion. Focusing on legislative staffers in Congress, Hertel-Fernandez, Mildenberger, and Stokes (Reference Hertel-Fernandez, Mildenberger and Stokes2019) find that staffers systematically misestimate public preferences in their district. This mismatch is partially explained by personal views and contacts with business groups. Through an experiment, the study also documents that staffers are less likely to view correspondence from ordinary citizens as being representative of constituent preferences than correspondence from businesses.
Importantly, scholars extended the study of unequal representation to assemblies in Europe, Latin America, and elsewhere (e.g., Bartels Reference Bartels2017; Elkjær and Iversen Reference Elkjær and Iversen2020; Elsässer, Hense, and Schäfer Reference Elsässer, Hense and Schäfer2017; Lupu and Warner Reference Lupu and Warner2022a; Mathisen et al. 2021; Peters and Ensink Reference Peters and Ensink2015). One approach in the comparative literature is to match data on government spending with data on public spending preferences by income groups from multiple survey waves and multiple countries. Estimating time-series cross-section models on such data, some studies find that changes in policy are positively related to changes in spending preferences of the rich but not the poor (Bartels Reference Bartels2017; Peters and Ensink Reference Peters and Ensink2015). On the other hand, Elkjær and Iversen (Reference Elkjær and Iversen2020) show that these findings can be model-dependent. In their preferred regression specification, policy appears to respond only to middle-income preferences. Lupu and Warner (Reference Lupu and Warner2022a) combine elite and mass surveys in fifty-two countries over three decades to calculate the distance between the views of citizens and legislators. They find that legislators’ views are more congruent with those of the rich.
While future research will surely refine estimates of the degree of unequal representation in a larger set of democracies, one can conclude that much of this preliminary evidence runs counter to normative theories of democracy stressing substantive political equality at the policymaking stage.
Interest Groups and the Hunt for Mechanisms
It remains an open question why there is so much political inequality in the legislative arena and what can be done about it. Surveying the literature, Bartels notes that there “is clearly a great deal more to be learned about the mechanisms by which economic inequality gets reproduced in the political realm” (2016: 267). The analysis of mechanisms in this body of scholarship has often focused on the importance of unequal political participation, knowledge, or individual campaign contributions (Bartels Reference Bartels2016; Erikson Reference Erikson2015; Gilens Reference Gilens2012).
We take a complementary perspective and ask how organized interests shape substantive political inequality. Interest groups may focus their efforts on shaping election outcomes or on swaying incumbent policymakers, whatever their partisan stripes. To what extent is unequal legislative responsiveness driven by an electoral selection channel rather than a postelectoral lobbying channel? So far, the existing evidence does not provide a clear answer about the relative importance of these two mechanisms. We will demonstrate that common empirical strategies may fail to provide a clear answer, and potentially also underestimate the overall impact of interest groups on unequal responsiveness.
One of the few studies that directly examines the relevance of organized interest for unequal responsiveness concludes that national policy in the United States is significantly biased toward economic elites and organized groups representing business interests (Gilens and Page Reference Gilens and Page2014). Related research at the subnational level finds that US states with stricter lobbying regulations exhibit less political inequality at the policymaking stage (Flavin 2015). However, these results stand in contrast with findings from a separate literature on lobbying and money in politics. It concludes that interest groups’ monetary contributions have little discernible impact on legislative voting (Ansolabehere, Figueiredo, and Snyder Reference Ansolabehere, de Figueiredo and Snyder2003) and that groups with more resources do not necessarily have much higher success rates than other groups (Baumgartner et al. Reference Baumgartner, Berry, Hojnacki, Kimball and Leech2009).
Political Selection as a Pathway to (In)equality
Partisanship
From an electoral selection perspective, unequal responsiveness in lawmaking is driven by what types of politicians are elected to office. Partisanship is often the strongest predictor of legislative voting (Bartels Reference Bartels2008; Lee, Moretti, and Butler Reference Lee, Moretti and Butler2004; McCarty, Poole, and Rosenthal Reference McCarty, Poole and Rosenthal2006), and the partisan composition of governments shapes key public policies over which people with different incomes tend to disagree (Pettersson-Lidbom Reference Pettersson-Lidbom2008). In partisan theories of political competition and public policy, different parties represent different socioeconomic groups and political competition does not lead parties to convergence to the median voter (Hibbs Reference Hibbs1987). Once in office, politicians try to implement their policy agenda and are not very sensitive to lobbying efforts to do otherwise. The account implies that reducing political inequality in a legislature requires first and foremost to balance the electoral arena.
Are legislators from different parties unequally responsive to rich and poor constituents? Examining the US Congress, Bartels (Reference Bartels2016: 248–249) finds that Republican House members and senators are more responsive to high-income than to middle-income constituents and largely irresponsive to the poor. While Democratic members of Congress are generally also responsive to high-income constituents, they do respond to the views of low-income and middle-class constituents (sometimes to the extent that there is no statistical difference in rates of responsiveness). An analysis drawing on rich individual-level voter registration data confirms this basic pattern (Rhodes and Schaffner Reference Rhodes and Schaffner2017).Footnote 4 A comparative analysis of policy adoption in four European countries finds that unequal responsiveness is less pronounced when Left parties are in power in three out of the four countries (Mathisen et al., this volume).
Descriptive Representation
Political selection does not only concern partisanship. Individuals vary on many attributes and some of them are bound to shape how they behave in the political arena. In particular, descriptive representation matters because the composition of many legislatures is imbalanced in terms of gender and tilted toward the highly educated and well-off. Thus, one might ask, as did John Stuart Mill in his Considerations on Representative Government, if “[p]arliament, or almost any of the members composing it, ever for an instant look at any question with the eyes of a working man” (Mill Reference Mill1977 [1861])? There is ample evidence that the occupational class background of politicians matters for legislative voting in the United States (Carnes Reference Carnes2013) and, comparatively, for the positions endorsed by legislators (Carnes and Lupu Reference Carnes and Lupu2015) and the fiscal policy choices of mayors (Curto-Grau and Gallego, this volume). Politicians with a working-class background are more responsive to the views of the relatively poor, even after controlling for political party. Similarly, characteristics like gender and race shape the responsiveness of politicians (Butler Reference Butler2014; Swers Reference Swers2005).
This line of research on the link between descriptive representation and inequality in legislatures implies that barriers to entry in politics for less advantaged individuals are part of the process driving unequal political responsiveness.
What Shapes Selection?
Economic inequality may favor the selection of policymakers more inclined to consider the opinions of the affluent. For example, increased economic inequality may incentivize higher contributions by those who have most to lose from redistribution and thus change the partisan composition of the legislature (Campante Reference Campante2011).
It may be tempting to think that the electoral influence of resource-rich interest groups is predominantly an American phenomenon due to its outsize levels of campaign spending. But what matters in electoral contests is the relative financial advantage of one group over another. For example, Cagé (Reference Cagé2020) documents that in Europe, funding is not equally distributed across political parties; it tends to favor conservative over Left parties. The richest sections of society and corporations contribute the bulk of private political contributions, and their spending is not electorally neutral. For instance, while Germany has a public campaign finance system, it imposes no limits on corporate donations (with carmakers being leading contributors). In the UK, election spending is strictly regulated, but parties can receive large amounts of cash in the form of donations.Footnote 5
Electoral institutions may also matter for selection. In the absence of credible commitments by parties, one theory goes, majoritarian electoral systems experience a bias in favor of low-tax and low-redistribution parties on the Right (Iversen and Soskice Reference Iversen and Soskice2006). The bias may vary with economic inequality because Left parties will have more incentives to solve their commitment problem as inequality increases (Becher Reference Becher2016).
Organized labor can also be a force for more political equality. In our own previous work, we find that stronger local labor unions enhance political equality in the US House of Representatives (Becher and Stegmueller Reference Becher and Stegmueller2021), consistent with state-level evidence (Flavin Reference Flavin2018). While unions are endogenous to politics, we use an instrumental variable approach to reduce concerns about omitted confounders. In line with the evidence on partisan gaps in responsiveness just discussed above, we also find evidence that the impact of unions works at least in part through the electoral selection channel. Relatedly, Carnes and Lupu (this volume) show across countries that unionization is positively correlated with the proportion of legislators with a working-class background.
Postelectoral Influence as a Pathway to (In)equality
Other accounts of unequal democracy emphasize the importance of postelectoral politics. While campaign contributions shape elections, they and other material inducements (e.g., dinners, vacations, well-paid board appointments, revolving doors) are often thought to make the incumbent, who looks forward to the next election, more pliable to the views of well-organized groups (Grossman and Helpman Reference Grossman and Helpman2001). Economic inequality entails resource advantages for corporations and the wealthy over average citizens and mass organizations. As a result, even supposedly pro-poor politicians may join the legislative coalition in favor of the economically advantaged (Hacker and Pierson Reference Hacker and Pierson2010).
Postelectoral influence can take various forms, such as exchange or persuasion. Due to well-known measurement and causal identification issues, empirically testing the political efficacy of lobbying is difficult (Baumgartner et al. Reference Baumgartner, Berry, Hojnacki, Kimball and Leech2009; Figueiredo and Richter Reference Figueiredo and Kelleher Richter2014). The literature has paid particular attention on how to isolate the impact of organized groups’ monetary contributions on legislators’ behavior from that of legislators’ party, ideology, and constituency. To improve the veracity of regression analyses of legislative votes in this respect, the review article of Ansolabehere, Figueiredo, and Snyder (Reference Ansolabehere, de Figueiredo and Snyder2003) recommends controlling for legislators’ party affiliation or, if possible, to include legislator fixed effects that capture policymakers’ time-invariant attributes. While intuitively appealing, it is noteworthy that this approach equates interest group influence with postelectoral lobbying. This strategy can fail to estimate the relevance of the postelectoral channel if preelectoral influence and postelectoral influence are strategic complements. Below, we argue that this is likely to be the case in times of party polarization.
Field experiments support the idea that money (or even the promise thereof) provides access to legislators (Hertel-Fernandez, Mildenberger, and Stokes Reference Hertel-Fernandez, Mildenberger and Stokes2019; Kalla and Broockman Reference Kalla and Broockman2016a). Also consistent with a postelectoral influence view, observational research has found that the revenue of lobbyists connected to legislators drops substantively once their former employer leaves the legislature (Blanes i Vidal et al. Reference Blanes Vidal, Draca and Fons-Rosen2012). A study of the congressional agenda based on legislative speeches finds that corporate contributions are associated with lower attention by legislators to issue like inequality and wages and higher attention to upper-class issues (Kelly et al. Reference Kelly, Morgan, Witko and Enns2019). Labor contributions are associated with higher attention to inequality and wages and lower attention to upper-class issues. These results hold conditional on partisanship and committee assignment.
Theories differ on whether organized groups should mainly lobby opposed legislators, legislators that are on the fence on the issue, or legislators who are friendly toward their position (Austen-Smith and Wright Reference Austen-Smith and Wright1994; Grossman and Helpman Reference Grossman and Helpman2001; Hall and Deardorff Reference Hall and Deardorff2006). Following the formal model of Hall and Deardorff (Reference Hall and Deardorff2006) and an older interest group literature, we argue that organized groups will often concentrate their lobbying efforts on friendly legislators.
Why should organized groups lobby friendly legislators? One useful way to think about lobbying is as providing a matching grant or legislative subsidy that assists like-minded legislators to achieve their own objectives (Hall and Deardorff Reference Hall and Deardorff2006). For example, a conservative legislator may generally believe that the corporate tax rate should be cut, but there are numerous issues on the legislative agenda that require her attention. Given limited time and resources in a legislature that considers thousands of issues each term, providing assistance (e.g., resources and information) enables the legislator to actively support the issue: drafting bills or amendments, convincing constituents, convening with cross-pressured colleagues, and finally casting a corresponding vote. In addition, lobbying friendly legislators counteracts lobbying of opposing groups (Austen-Smith and Wright Reference Austen-Smith and Wright1994).
Selection and Postelectoral Influence as Complements
Rather than being alternative drivers of political (in)equality, electoral selection and postelectoral lobbying may go hand in hand. Organized interests maximizing their influence over the policy outcome pursue two objectives. First, ensuring that legislators already friendly to its interests are elected and, second, providing the elected friendly legislators with support to achieve their goals in the postelectoral arena. Then it will be especially difficult to unbundle the mechanisms empirically and applying standard statistical approaches to study mechanisms is likely to lead to wrong conclusions.
To clarify this argument, the section below introduces a simple formal model of a two-stage political process with an electoral and a postelectoral stage. Assuming that both channels may be complementary, the model highlights the resulting behavior of organized interests and legislators. The political equilibrium is then used as input for generating simulated legislatures. The main point of the model is to provide clear analytical foundations for the data generating process used in the simulation, and for this purpose, it prioritizes accessibility and transparency over technicality. Each of the model’s key components is based on a rich literature and more elaborate game-theoretic analysis. The strategic interaction of electoral selection and postelectoral lobbying we present here is relatively novel and has implications for empirical research on unequal responsiveness in legislatures that are not as apparent without the guiding light of the model.
A Two-Stage Model
An organized group,  , cares about the policy action of an elected policymaker,
  . The policymaker may be an individual legislator or a collective legislative body. Group
  may represent the interest of the relatively poor (e.g., organized labor), or that of the relatively rich (e.g., corporate interest groups).
  faces a binary policy choice
  .
.  ’s utility from policy
  versus policy
  is given by
  and
and  , respectively. To fix ideas, we assume throughout that
  , so that
  strictly prefers policy
  to policy
  . The model can be interpreted in two ways without affecting the analysis. First, think of
  as a labor union supporting a policy,
  , of more social protection for individuals in the lower half of the income distribution over policy
  that would remove such protections. Here, the group will balance the proclivity of the policymaker to side with economic elites and business interests documented in the literature. One possible implication is that the decline in organized labor as a countervailing power is an important driver of political inequality. Second, one can think of
  as corporate interests pushing for lower taxes on corporations or top incomes. Here,
  wants legislators to support a policy that is not preferred by middle-income and low-income constituents. For concreteness, we will focus on the first interpretation in the text. But it is important to keep in mind that the model also applies to the second case.Footnote 6
Policy is made in a representative democracy, where  can influence policy in two distinct stages of the political process: via lobbying elected representatives and by affecting what type of legislator is elected in the first place. To impact the latter in an election,
  can take some costly action, such as campaign contributions, get-out-the-vote campaigns, or advertisement, to stochastically improve the chances that its preferred type of policymaker is elected. To impact the former,
  can lobby elected representatives to increase the probability of them supporting a given policy. Policymakers differ in their policy priorities, be it due to party membership or categories such as gender, race, or class background. We assume that there are two types of legislators,
  , where
  indicates left and
  right, to capture the most important aspect of current partisan polarization. Then group
  may choose to lobby a policymaker after the election and
  then chooses either policy
  or
or  . The model developed below considers a strategic group and agent-based policymakers acting under political uncertainty.
The Electoral Stage
During the election,  chooses a level of mobilization effort, denoted by
  , that may be low (
 ) or high (
 ). All that we need to assume is that a higher mobilization effort translates into a higher probability that the group’s preferred type of politician wins the election. In a two-candidate race in a first-past-the-post system, this requires winning just more than 50 percent of the vote. Say
  ’s policy interests are more in line with Left policymakers so that
  prefers
  over
over  . We model an electorate with a large number of voters (i.e., there are no ties). Denote by
  the share of votes obtained by a candidate of type
  . The mobilization assumption made above then translates to
  .
.
A group’s mobilization capacity depends on two key factors. First, the cost of mobilization, which is represented by a nonnegative scalar,  . Second, the group’s exogenously determined strength, for example, its membership size or capital stock. We represent the total of the latter by nonnegative scalar
  . Groups with larger mobilization capacity have a larger impact on electoral politics:

The Postelectoral Stage
As already argued above, we consider the situation where electoral mobilization (and the resulting selection of  ) and postelectoral lobbying are not perfect substitutes. Managing to get a number of type
  politicians elected is not necessarily enough for
  to achieve its policy objectives. While
  policymakers are a priori more favorable toward
  than type
  policymakers, their support for the policy cannot be taken for granted by
  . Policymakers vary in their ideological or partisan constraints and commitments. Think of type
  politicians as having a large policy agenda and facing offers from other groups on other dimensions, so that they have to make a decision of whether to exert costly effort (e.g., drafting a proposal) to support
  . Thus, after the election,
  considers whether and how much to lobby any given elected policymaker. Lobbying may take varying forms such as exerting pressure or providing information and resources. We represent lobbying effort by a nonnegative real number,
  . Note, that due to the aforementioned heterogeneity in priorities and constraints, not all politicians are equally responsive to being lobbied by
  .
.
Rather than modeling the full complexity of postelectoral politics, we capture this logic in a reduced form by using a contest success function (Cornes and Hartley Reference Cornes and Hartley2005; Tullock Reference Tullock, James, Robert and Tullock1980). The probability that a policymaker chooses  over
over  is characterized by the effectiveness of group
  ’s lobbying in favor of
  relative to countervailing influences (such as lobbying efforts of competing interest groups or the opportunity cost of not pursuing other issues), which are captured by a hurdle factor
  :
:

Here  is
is  ’s exogenous strength and
  is the endogenous lobbying effort as defined above. The hurdle factor
  is a nonnegative real number that depends on the type of politician. For a given lobbying effort, Left politicians are more willing to support
  than Right politicians:
  . An instructive case is that only
  types are positively responsive to
  ’s lobbying (i.e.,
  is sufficiently large to render lobbying
  types prohibitive). Should
  decide not to lobby
  then policy
  is the certain outcome. Lobbying is costly and, following much of the literature using contest functions, we assume a linear cost structure.
Analysis
Given the sequential nature of the interaction, the analysis starts in the postelectoral stage. For a given type of the policymaker,  chooses lobbying effort
  to maximize the payoff:

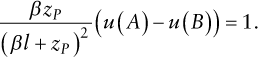
The first order condition implies that  chooses
  until marginal expected benefits of lobbying equal marginal cost:
For nonnegative values of  , group
  ’s optimal behavior is well defined and has a unique best response (Cornes and Hartley Reference Cornes and Hartley2005). Solving the equation above yields the optimal lobbying effort:

Two intuitive results emerge. First, higher policy stakes for the interest group, captured by a larger utility differential for policies  and
and  ,
,  , induce more lobbying effort. Second, the effect of the hurdle factor
  on postelectoral lobbying is nonmonotonic. As opposing forces make a legislator less inclined to support the policy preferred by
  for a given amount of lobbying, increasing
  ’s lobbying effort pays off when the initial hurdle is relatively low (
 ) but not when the hurdle is already high (
 ).
).
Given the optimal postelectoral lobbying behavior, we now show  ’s choice of costly mobilization effort. To simplify notation, consider the probabilities of the key outcomes. Denote by
  the probability of seeing a Left legislator elected given high mobilization effort,
  , and by
  given low mobilization effort,
  . Denote by
  the probability of obtaining the preferred policy given optimal lobbying of a type
  legislator,
  , and by
  the respective probability for a legislator of type
  .
.
Group  exerts costly mobilization effort at the electoral stage if and only if the expected value of mobilizing is larger than the cost:


Mobilization thus requires that the group is sufficiently strong (i.e.,  is sufficiently large), that the policy stakes
  ) are sufficiently high relative to the cost of mobilization (
 ), and that there is party polarization captured by the partisan gap in responsiveness to postelectoral lobbying effect (
 ).
).
Party polarization is low when legislators of either party have a similar probability of supporting policy  for a given amount of postelectoral lobbying. If party polarization is sufficiently low, then even a strong group will focus all its efforts on postelectoral lobbying. In the context of sufficiently high party polarization, the interest group will first engage in electoral mobilization on behalf of its preferred candidate, and then engage in postelectoral lobbying if its preferred candidate wins the election. This logic implies that interest group strategies systematically vary across context.
Consider the interaction of both stages in the case of high polarization such that only type  politicians are responsive to
  ’s lobbying (i.e.,
  is sufficiently large such that
  for feasible values of
  ). Then, a strong
  will exert mobilization effort and, if
  wins the election, postelectoral lobbying effort to achieve its preferred policy,
  . On the one hand, mobilization alone is not sufficient to affect the policy outcome. On the other hand, a rational group will not solely rely on lobbying. Everything else equal, the strength of
  , as parameterized by
  , improves both the electoral and the postelectoral chain of influence:
  is more likely to prevail in the election and more likely to choose policy
  . In equilibrium, the selection of the preferred type of politician and the use postelectoral lobbying are strongly correlated.
Evidence from Simulated Legislatures
We trace the implications of our model for empirical analysis using a simulation approach. We create 5,000 simulated legislatures, each with 435 legislators, whose composition is the result of an electoral process including strategic mobilization and whose policy choice is the result of strategic postelectoral lobbying. Each legislator faces the choice of supporting one of two policies,  or
or  , in a roll-call vote (or prior action such as cosponsorship).
The simulation captures a situation where policy  is preferred over policy
  by citizens in the middle and lower part of the income distribution, but economic elites and business interest groups generally have opposing preferences. In this environment, mass-based organizations like labor unions may be a force for more political inequality in legislatures (Becher and Stegmueller Reference Becher and Stegmueller2021; Flavin Reference Flavin2018). Continuing with this running example, we would like to know to what extent the effect of organized labor on legislative responsiveness works through political selection rather than postelectoral bargaining. Nothing changes with respect to the identification challenges for unbundling the mechanisms if one prefers to interpret unions as enhancing inequality or if one thinks of the organized group
  as a business group that has preferences add odds with the majority of voters (Gilens Reference Gilens2012; Gilens and Page Reference Gilens and Page2014; Grossman and Helpman Reference Grossman and Helpman2001).
Table 6.1 shows the parameter values used in our simulation. To generate variation in the ability of the group to affect legislative behavior and thus substantive political equality, the group strength parameter across the 435 districts is drawn from a uniform distribution ranging from 0.05 to 0.21. This represents district-level variation in union strength (e.g., number of union members). We base this range on district-level membership estimates found in the data of Becher, Stegmueller, and Kaeppner (Reference Becher, Stegmueller and Kaeppner2018).
Table 6.1 Parameter values
| Parameter | Label | Value |
|---|---|---|
 | Group strength | U (0.05, 0.21) |
 | Policy polarization | 5 |
 | Lobbying hurdle | 0.06 |
 | Mobilization costs | 0.15 |
 | Left vote share under  | U (0.30, 0.61) |
 | Number of legislators | 435 |
In the absence of any mobilization effort by the group, the vote share of Left legislators can vary from 0.3 to 0.61; the expected value of Left vote share is  .Footnote 7 Thus, Left candidates are electorally disadvantaged compared to their Right competitors but with a narrow enough margin to make electoral mobilization worthwhile in expectation for a well-organized group.Footnote 8 Realistically, there is significant political polarization, as represented by the utility difference between policy
  and policy
  . Organized interests face a complementarity between partisan selection and lobbying. The positive lobbying hurdle for Left politicians (
 ) implies that without being lobbied by
  , even like-minded legislators would not support policy
  ; right politicians are never willing to support
  for feasible lobbying efforts by
  .Footnote 9 This setup produces partisan voting patterns that are in line with many key votes.Footnote 10
Common Statistical Specifications
We now turn to analyses of the simulated legislatures using standard regression approaches used in the literature on legislative voting and representation. A key parameter of interest is the regression coefficient for  , which captures the average effect of
  ’s strength in a legislator’s district on representational inequality. A common specification would regress a legislator’s support for policy
  (i.e., a recorded roll-call vote) on the group strength variable and a set of district characteristics. We have constructed the data-generating process such that there is no endogeneity problem with respect to group strength and legislative behavior.Footnote 11 This is to focus on the mechanism problem. It illustrates the difficulties that can arise even when researchers have an exogenous measure of the group’s power in each district.Footnote 12 A key decision when deciding on a model specification is the choice of how to treat the partisan identity (or descriptive characteristics) of the legislator, captured by an indicator variable equal to 1 if
  . We begin with a specification that does not include this indicator, followed by a specification where it is included. The reasons for its inclusion are usually given in terms of either “controlling for partisanship” or in an informal attempt to capture the selection channel and distinguish it from a residual “direct” channel.Footnote 13 Partisanship has a key practical advantage for researchers. It is directly observable and measured with little error. This contrasts with a group’s lobbying effort, which can use multiple instruments and only some of them are observable to researchers (Figueiredo and Richter Reference Figueiredo and Kelleher Richter2014).
Table 6.2 shows the resulting estimates obtained from linear probability models (accompanied by the required heteroscedasticity-consistent standard errors). Column (1) shows that group strength significantly increases the support for policy  . A marginal increase in group strength increases the probability of a legislator supporting the policy by
  percentage points. Expressed in substantive terms, a one standard deviation increase in group strength increases the probability by about 7 percentage points. This represents the “total impact” of an increase in group strength on policy adoption both via changing the likelihood of the election of Left legislators and via changing their support for the policy via lobbying once elected. A researcher including the partisan identity of legislators in the specification would obtain the results displayed in column (2). The estimate for the partisanship variable is large and clearly statistically different from zero (
 ). The coefficient for group strength is drastically reduced and almost five times smaller compared to specification (1). Given the size of its standard error, one would have to conclude that it is statistically indistinguishable from zero. Faced with these empirical results, a researcher might reach the conclusion that only partisan selection matters for the support of policy
  – which is clearly incorrect given the model that generated the data, in which the selection channel alone is not sufficient to change substantive representation in the legislature. Recall that without any lobbying of friendly legislators (something that does not occur in equilibrium), all legislators would support policy
  .
.
Table 6.2 Group strength, electoral selection, lobbying, and legislative responsiveness
| (1) | (2) | (3) | ||||
|---|---|---|---|---|---|---|
| Est. | s.e. | Est. | s.e. | Est. | s.e. | |
Group strength  | 1.559 | (0.484) | 0.327 | (0.307) | 0.005 | (0.143) |
Left legislator  | 0.753 | (0.031) | 0.919 | (0.159) | ||
| Postelection effortFootnote a | −0.108 | (0.106) | ||||
Notes: Based on  simulated legislatures with 435 members. Intercepts not shown. Estimates from linear probability model with heteroscedasticity-consistent standard errors.
a Postelection effort observed without measurement error (or measured via proxy with known and adjusted reliability). Correlation of postelection effort with electoral mobilization,  0.023; correlation with left election winner,
  0.962.
Just Omitted Variable Bias?
Are these stark results simply the result of omitted variable bias, namely omitted postelection lobbying effort? Specification (3) of Table 6.2 includes a measure of the intensity of lobbying after the election. More precisely, we include the level of optimal postelection effort (parameter  in our model). Usually, researchers will not have access to this variable, but work with an imperfect proxy or one or several of its components, which raises issues of errors-in-variables bias. Here, we show a best-case scenario, where a researcher either fully observes
  or corrects for known reliability of the variable measured with error. As the estimate for
  signifies, the inclusion of lobbying effort does not recover the impact of group strength when the true data-generating process exhibits strategic complementarities.
Can Mediation Analysis Recover the True Effect?
Given advances in the statistical analysis of causal mechanisms, researchers explicitly interested in mechanisms may go beyond the regression analysis above and opt for an explicit effect decomposition. The goal of this approach is to decompose the effect of group strength on policy choice into an indirect component channeled via partisanship and a direct or remaining component (e.g., Pearl Reference Pearl2001). Imai et al. (Reference Imai, Keele, Tingley and Yamamoto2011) define the former as an average causally mediated effect (ACME) and the latter as an average direct effect (ADE). We follow their definition and their guidance about best empirical practice (Imai, Keele, and Yamamoto Reference Imai, Keele and Yamamoto2010).
Panel (A) of Table 6.3 shows the resulting causal effect decomposition estimates.Footnote 14 The ACME is  indicating a substantively and statistically significant impact of group strength via the selection of a Left legislator. In contrast, the ADE of group strength is only
  and not statistically distinguishable from zero. Almost 80 percent of the total effect of group strength is mediated by the selection of a Left legislator. Again, these findings would tempt a researcher into drawing a conclusion contrary to the true model generating the data. Namely, they might conclude that it is the partisanship of the legislator, and thus the selection mechanism, that matters most for the support of a policy in the legislature and that, as indicated by the remaining effect of group strength, postelectoral influence plays a comparatively small (even “insignificant”) role.
Table 6.3 Mediation analysis
| Estimate | s.e. | |
|---|---|---|
| A: Causal decomposition estimates | ||
ACME of group strength [ ] via Left legislator [ ] via Left legislator [ ] ] | 1.232 | (0.387) |
ADE (remaining effect of  ) ) | 0.327 | (0.307) |
Proportion of total effect of  mediated by mediated by  | 0.783 | |
| B: Omitted M-Y confounder | ||
Sensitivity analysis:  where where  | 0.813 | |
True value of   | 0.962 | |
Test  [ [ -value] -value] | 0.000 | |
Notes: Based on  simulated legislatures with 435 members. Causal decomposition estimated following Tingley et al. (Reference Tingley, Teppei Yamamoto, Keele and Imai2014) with standard errors based on 500 bootstrap draws.
A careful decomposition analysis will always include a sensitivity analysis for omitted confounding variables. A researcher realizing that unobserved variables (including postelectoral effort) are likely confounding the mediator-outcome relationship would conduct a sensitivity analysis by simulating various degrees of residual correlation,  , between the mediator and outcome equation (Imai, Keele, and Yamamoto Reference Imai, Keele and Yamamoto2010). In Panel (B) of Table 6.3, we report a common quantity that emerges from this exercise: the value of
  where the estimated ACME becomes zero. In our simulated data, this occurs when
  is about 0.8. Because of the large size of this correlation, a researcher might well conclude that only an unrealistically large correlation induced by omitted confounders would negate the strong estimated role of the partisan selection channel. But again, under a true data-generating process with strategic complementarity, this empirical result provides a false sense of security: the true
  value is larger than 0.8 – on average the correlation between an elected Left legislator and postelectoral lobbying effort is
  .
.
Roll Call Voting in the US Congress
A reader might wonder if the issues discussed in this paper do indeed show up in common empirical applications. While we attempted to choose realistic parameter values in our simulations, it is possible that empirical research might not encounter similarly stark patterns. In Table 6.4, we summarize typical analyses of four key votes in the 110th and 111th Congress. We chose votes on issues that enjoyed broad support among low-income constituents, such as the Fair Minimum Wage Act of 2007 or the Foreclosure Prevention Act of 2008. The first specification regresses roll-call votes on union strength (measured as district-level union membership calculated from administrative data in Becher, Stegmueller, and Kaeppner Reference Becher, Stegmueller and Kaeppner2018) to capture the impact of group strength on the behavior of elected representatives. Union strength does indeed have a positive impact on representation: the coefficient of (logged) union membership is of sizable magnitude and statistically significant for all four key votes.
Table 6.4 Estimates of group strength on roll-call votes for some key bills with high support among low-income constituents
| Roll-call vote | Low inc. supportFootnote a | Democratic legisl. votesFootnote b | Group strength estimates | ||
|---|---|---|---|---|---|
| Union sizeFootnote c | Union size + DemocratFootnote d | ||||
| Lilly Ledbetter Fair Pay Act | 0.62 | 223 | (96%) | 0.140 (0.030) | −0.000 (0.006) |
| Fair Minimum Wage Act | 0.82 | 233 | (100%) | 0.097 (0.025) | 0.011 (0.012) |
| Foreclosure Prevention Act | 0.70 | 227 | (96%) | 0.109 (0.028) | −0.001 (0.020) |
| Affordable Care Act | 0.64 | 219 | (87%) | 0.156 (0.033) | 0.046 (0.018) |
Note: Linear probability models with state fixed effects. Robust standard errors clustered at the state level.
a Average share of low-income citizens in 435 districts supporting the policy. Constituency preferences derived from Cooperative Election Study questions corresponding to roll-call vote. District-level small area estimation via matching to the Census population using random forests. See Becher and Stegmueller (Reference Becher and Stegmueller2021).
b Number of yea votes among Democrats. Percentage of Democratic caucus voting yea in parentheses.
c Coefficient of logged district union membership numbers. District-level union membership calculated from administrative data in Becher, Stegmueller, and Kaeppner (Reference Becher, Stegmueller and Kaeppner2018).
d Coefficient of logged district union membership numbers after adding an indicator variable for partisanship of legislator.
The final column of Table 6.4 presents a specification likely to be explored by many researchers at some point (or to be demanded by reviewers): an analysis of roll-call votes and union strength while “controlling” for a legislator’s party. We have shown above that this strategy yields misleading inferences for the impact of group strength when postelectoral influence and selection are strategic complements. This is likely the case in our empirical example given high levels of party polarization in the US Congress, where the addition of legislator partisanship drastically changes the group strength coefficient. For many key votes, the impact of logged union membership is essentially nil with coefficients statistically indistinguishable from zero. Interpreting these results as evidence for the overwhelming importance of partisan selection or of the irrelevance of unions would be misleading.
Using arguably exogenous variation in union strength based on historical mining locations, Becher and Stegmueller (Reference Becher and Stegmueller2021) find, in line with theoretical intuition, that stronger unions make it more likely that Democratic candidates win congressional elections. However, it is possible that postelectoral lobbying remains a relevant mechanism at play. Theory and evidence suggest that electoral selection and lobbying may go hand in hand when parties exhibit divergent ideologies.
Using individual-level data linking contributions and lobbying by firms, Kim, Stuckatz, and Wolters (Reference Kim, Stuckatz and Wolters2020) find that a campaign donation to a member of Congress by a firm increases the probability that the same legislator is also lobbied by 8–10 percentage points, on average. Our theoretical model highlights that even a fairly small correlation between electoral and postelectoral effort can lead to a very high correlation between electoral selection – having a friendly legislator win the election – and lobbying.
Conclusion
Interest group influence is sometimes perceived as the main source behind unequal representation in legislatures around the world. For example, the power of corporations to shape policies that diverge from the interests of much of the population is a frequent topic of news stories. Relatedly, the weakening of organized labor may have critically reduced the political voice of non-elite workers. However, academic scholarship on the issue is far from settled. Trying to understand why there appears to be so much substantive political inequality in the policymaking process, the rapidly growing unequal democracies literature has paid only limited attention to the role of organized interests. This is in part due to data constraints but may also reflect lack of theoretical attention. For European observers, it is tempting to think that interest groups and the money they bring to politics are mainly a problem for democracy in America and less institutional presidential systems in other parts of the world. While comforting, this is a deceiving thought. Recent research has revealed remarkable inequalities in campaign finance systems in European countries and positive theory highlights the potential power of special interest groups in proportional electoral systems commonly found in continental Europe.
We have highlighted through a simple model and model-based simulation the value of analyzing interest groups’ incentives on how to use their resources in the electoral and postelectoral lobbying stage. Our analysis shows that when party polarization is low, interest groups have incentives to focus on lobbying incumbent politicians, regardless of their partisan affiliation. When parties are polarized, efforts to shape the selection of partisan policymakers in elections and postelectoral lobbying go hand in hand in political equilibrium. Thus, electoral selection becomes more important as party polarization increases. This testable implication from our model may help to explain variation in interest group strategies across countries. Furthermore, ignoring this relationship may lead scholars to underestimate the importance of interest groups for political inequality.
The model also clarifies that interest group efforts to shape selection complement lobbying efforts rather than substitute them. Thus, even in times of high polarization, lobbying remains substantively important even though it can be empirically difficult to untangle its effects from that of the selection mechanism. With respect to policies aiming to enhance the ideal of substantive political equality, the logic outlined in the chapter implies that reforms aiming to limit the scope of the selection channel do not render the lobbying channel ineffective and must not be ignored. It also stands to reason that well-endowed interest groups face less of a trade-off between the two mechanisms, electoral selection and postelectoral influence, possibly explaining their clout.
Our argument and empirical illustration also highlight a neglected methodological issue with implications for our understanding of unequal representation. When analyzing data on legislative behavior or policy adoption, researchers may wrongly conclude that interest group influence mainly works through electoral selection. Furthermore, if interest group influence is equated with postelectoral lobbying, as is sometimes done implicitly or explicitly in efforts to mitigate concerns about confounding, then researchers can wrongly conclude that there is no interest group influence on policy and political inequality at all. When the regression coefficient appears to assign large weight and statistical significance to a variable like party that was determined in an election, the obvious interpretation may be that interest groups do not really matter much. But this conclusion is wrong for data that are generated from a political process similar to the one we studied here. This point is relevant for research on political inequality, but it also applies to the lobbying literature at large. Admittedly, we offer no easy fix for this problem. But theoretical awareness helps researchers to triangulate different types of data and come up with innovative research designs. For instance, findings on the importance of political selection must be interpreted against evidence on the link between contributions and access.
Extending our theoretical framework, one avenue for future research would be to derive comparative statics about the effect of electoral institutions on interest group strategies and how they impact unequal representation. Doing so requires additional modeling choices about institutional variation, the internal organization of political parties, and multiparty systems. Suppose for a moment that the effectiveness of lobbying is reduced by higher party discipline, which itself varies with electoral rules. Then an increase in party discipline can shift in the balance of total effort toward postelectoral lobbying. Because a focus on electoral selection alone is not sufficient to achieve the desired policy outcome, the group (think, if you would like, of a labor union) has to increase its lobbying effort. This occurs if the group has sufficient exogenous resources. Up to a point, the result still holds even if returns to electoral mobilization are also comparatively lower under PR. This implication appears broadly consistent with the empirical finding that firms’ lobbying efforts in closed-list PR systems appear to increase with district magnitude (Campos and Giovannoni Reference Campos and Giovannoni2017). However, an opposing view suggests a different prediction: under higher party discipline, lobbying can be rationally targeted at party leaders and party organizations as a whole and thus be more efficient. For organized interests, the result may be more bang for the buck in PR systems. Thus, the impact of the institutional environment may hinge assumptions made about within-party organizational features and details of the electoral rules.Footnote 15
Politicians have on average much higher levels of education than citizens (Bovens and Wille Reference Bovens and Wille2017; Gaxie and Godmer Reference Gaxie, Godmer, Cotta and Best2007; Gerring et al. Reference Gerring, Oncel, Morrison and Pemstein2019). This empirical regularity is consistent across countries and over time, but is the overrepresentation of highly educated citizens in office justified? A long tradition sees highly educated politicians as more desirable on the basis that education is a sign of competence or “quality” (Dal Bó and Finan Reference Dal Bo and Finan2018): highly educated individuals are considered as better able to understand politics, as better managers, as having more authority on others, and as being more committed to the well-being of their communities than the less educated. In empirical research, numerous studies use the education of politicians as a proxy of their unobserved “quality” (e.g., Artiles, Kleine-Rueschkamp, and Leon-Ciliotta Reference Artiles, Kleine-Rueschkamp and León-Ciliotta2021; Baltrunaite et al. Reference Baltrunaite, Bello, Casarico and Profeta2014; Becher and Menendez Reference Becher and Menendez2019; Gagliarducci and Nannicini Reference Gagliarducci and Nannicini2013; Galasso and Nannicini Reference Galasso and Nannicini2011). This argument would provide a normative defense for the overrepresentation of some types of citizens in politics. In turn, this overrepresentation of some points of view is at the core of some elite-centered explanations of unequal representation, as discussed in the introduction of this volume (see also Bartels in this volume).
However, existing evidence about the actual consequences of having highly educated politicians on policy outcomes is scarce and conflicting. Some studies have argued that educated political leaders produce positive outcomes such as better economic performance (Besley, Montalvo and Reynal-Querol Reference Besley, Montalvo and Reynal-Querol2011; Congleton and Zhang Reference Congleton and Zhang2013) or an increase in the provision of public goods (Martinez-Bravo Reference Martinez-Bravo2017). But other studies find that the education of politicians is irrelevant for policy outcomes (Carnes and Lupu Reference Carnes and Lupu2016b; Freier and Thomasius Reference Freier and Thomasius2015) or find mixed evidence (Lahoti and Sahoo Reference Lahoti and Sahoo2020).
This chapter studies if the education level of politicians in government affects fiscal policies and performance using detailed local government data. While previous empirical research either views education as a sign of the quality of politicians or finds that highly and less-educated politicians implement similar policies, our research introduces a third possibility, which is that governments led by more-educated politicians implement more conservative fiscal policies. This idea is complementary to other elite-centered explanations in this volume, including the chapter by Mathisen et al. on the importance of parties; the chapter by Hacker, Pierson, and Zacher on the importance of communication; and Becher and Stegmueller on the role of interest groups to help understand why politicians fail to represent the views of citizens.
To study how the education of politicians affects government performance, we present detailed analyses based on data from Spanish municipalities between 2003 and 2011. We construct an original dataset with information about the gender, age, and education of all mayoral candidates in local elections and match it to local policy outcomes, including fine-grained information about budget items, tax rates, and spending in several policy areas. To address endogeneity concerns, we follow previous research that applies regression discontinuity designs to study the effects of partisanship and the characteristics of politicians on various outcomes (e.g., Ferreira and Gyourko Reference Ferreira and Gyourko2009; Gerber and Hopkins Reference Gerber and Hopkins2011). Our identification strategy, which is tailored to the PR system employed in Spanish municipal elections, exploits close races between mayoral candidates with and without a university degree to examine if performance and fiscal policy differed in municipalities where a candidate with a university degree just won or just lost an election.
The RD estimates suggest that when highly educated politicians closely win an election, municipalities do not have better outcomes in respect to unemployment, population growth, primary deficit, or a close match between projected and realized spending, nor are these governments more likely to be reelected. Our analysis of budget items and spending categories provides evidence that, on average, less-educated mayors choose higher levels of capital spending and increase spending in basic infrastructure projects. In ancillary analyses, we also find that the positive effect of electing left-wing governments on capital spending is reduced when the mayors of left-wing parties have a university degree. Overall, our results suggest that educated and noneducated politicians differ on preferences rather than on ability.
This chapter complements recent work on how the social class background of politicians affects government outcomes (Carnes Reference Carnes2013; Carnes and Lupu Reference Carnes and Lupu2015; Pontusson 2015; O’Grady Reference O’Grady2019). Our study joins others that claim that a lack of descriptive representation by socioeconomic status is normatively problematic, as argued by Bartels in this volume. The large overrepresentation of highly educated citizens in office does not produce obvious benefits in terms of better government performance, and our findings suggest that it can introduce a conservative bias in public policy.
Theory
Our work is motivated by studies which demonstrate that public policies are not determined by the median voter and political institutions alone, but also by the identity of political leaders (Bhalotra and Clots-Figueras Reference Bhalotra and Clots-Figueras2014; Chattopadhay and Duflo Reference Chattopadhay and Duflo2004; Jones and Olken Reference Jones and Olken2005; Pande Reference Pande2003). This claim has wide-ranging implications. Above all, when the composition of governments and legislatures differs from the composition of the population, policies will deviate from the counter-factual situation in which politicians resemble the population. Policy bias will, in all likelihood, favor the overrepresented groups. The most important respect in which politicians stand out in advanced industrial democracies is their privileged socioeconomic background, as discussed in the chapter by Carnes and Lupu in this volume. Whereas the underrepresentation of women and minorities has improved markedly over time, it has only worsened for workers, the less educated, and low-income citizens (Bovens and Wille Reference Bovens and Wille2017; Carnes Reference Carnes2013; Gaxie and Godmer Reference Gaxie, Godmer, Cotta and Best2007; O’Grady Reference O’Grady2019).
Different dimensions of socioeconomic advantage such as income, occupation, and education are highly correlated, but education has differential features that justify a separate assessment.Footnote 1 Highly educated governments have been defended based on the purported higher ability of their members. However, education is not only the result of higher ability and a vehicle of social mobility, but also a mechanism for the reproduction of inequality (Lee and Seshadri Reference Lee and Seshadri2019). Having parents of a higher socioeconomic and educational background predicts educational attainment and ultimately income, beyond differences in ability.Footnote 2 Education can affect the preferences of citizens through a variety of channels, some of which are separate from income or occupation (as we discuss in detail later). The distinctive features of education justify the need for a careful analysis of both valence and positional outcomes that could reveal trade-offs.
Previous Studies: Better Performance or No Effects?
A first strand of studies finds that highly educated politicians are more competent. Besley, Montalvo, and Reynal-Querol (Reference Besley, Montalvo and Reynal-Querol2011) exploit the death of leaders due to natural causes to identify the effects of their education on economic growth and find that the departure of highly educated leaders from office reduces economic growth. Martinez-Bravo (Reference Martinez-Bravo2017) exploits a large education program in Indonesia and finds that highly educated village heads govern more efficiently and deliver more public goods than less-educated village heads. Lahoti and Sahoo (Reference Lahoti and Sahoo2020) find that educated politicians produce better educational outcomes in developed states in India, but not in less-developed states.
There are several reasons why highly educated politicians may perform better. Educated people score higher on cognitive and noncognitive traits which predict job performance, including crystallized and fluid intelligence and personality traits such as openness to experience, conscientiousness, and emotional stability (Heckman and Kautz Reference Heckman and Kautz2012). Skills acquired through formal training or job experience, such as accounting skills, team management, or legal knowledge, can be transferred to government tasks. The correlation of education and desirable abilities and traits may be due to a mixture of self-selection of people with these traits to pursue postsecondary education and to formal education enhancing abilities such as mathematical, verbal skills, or grit. Whatever the direction of causality, if this positive correlation holds among politicians, we should expect highly educated politicians to deliver better outcomes than less-educated politicians on indicators of economic performance.
The dominant view that highly educated politicians perform better than less-educated politicians has been challenged empirically by Carnes and Lupu (Reference Carnes and Lupu2016b) who reanalize Besley, Montalvo and Reynal-Querol’s (Reference Besley, Montalvo and Reynal-Querol2011) data using a broader set of outcome measures and fail to find a positive effect on performance. They confirm these null results using further evidence from close elections in US congressional elections and mayoral elections in Brazil. Similarly, Freier and Thomasius (Reference Freier and Thomasius2015) do not find an effect of education on local spending and debt in German municipalities.
Two reasons stand out that may explain these null effects. Politicians may simply not be able to influence policy outcomes much, perhaps because other factors are more important or because governments have little power. The lack of effect of education on performance may also be due to self-selection. As in the case of female politicians (Anzia and Berry Reference Anzia and Berry2011), less-educated citizens may be less likely to run and to obtain support, holding quality equal. As a consequence, only the most exceptional less-educated citizens will run in elections and win office. Adverse selection may operate among highly educated citizens. If the salaries of politicians are lower than the salaries of highly educated workers in the private sector, perhaps only those with a low ability among the highly educated choose to run. As a result of both processes, even if there is a positive correlation between education and ability in the population, this correlation could be weakened among politicians. The prediction of this argument is that the education of politicians should not affect governmental performance.
Education and Economic Preferences
A third possibility is that educated politicians have different preferences and implement more fiscally conservative policies than less-educated politicians. This view links the strands of literature that link the preferences of citizens about redistribution (see Cavaille, Ares and Häusermann in this volume) to unequal representation in elite-centered explanations, also discussed in this volume. Perhaps individuals with different characteristics have different preferences. If some are more likely to be representatives than others, this introduces a bias in the political process that helps explain unequal representation.
The more general theoretical argument, in line with citizen-candidate models of representation (Besley Reference Besley2006), is that the individual characteristics of politicians are informative about their preferences and shape their actions in office. The main testable hypothesis is that the identity of politicians predicts public policies, a general claim that has been applied to multiple individual characteristics (Burden Reference Burden2007).
Education can shape preferences through multiple channels, some common to other socioeconomic characteristics and others specific to education. The first is the income channel: Educated people have higher incomes and income potential and hence different material interests. As an illustration of this well-known correlation for the Spanish case, according to the yearly Survey on Life Conditions conducted by the National Statistics Institute, citizens with university degrees had incomes more than twice as high, on average, as citizens with lower secondary education. Given the progressive structure of the tax system, this means that more-educated citizens pay relatively more taxes than less-educated citizens. Higher incomes also give educated citizens better access to privately provided healthcare, education, and other services. Because they pay more in and get less out, they should have a preference for a smaller size of the state.
A slightly different material interest channel relates to the risk of unemployment. Less educated citizens face much higher economic risks (Hacker, Rehm and Schlesinger Reference Hacker, Rehm and Schlesinger2013) and hence are more reliant on social protection. In Spain in 2007, people aged between 25 and 64 who had primary education were twice as likely to be unemployed than people with university education. The unemployment rate was 9.9 and 4.8 respectively. In 2010, the gap was even larger at 28 and 10.5. As a consequence of both their different incomes and risk levels, citizens – and politicians – with low levels of education should prefer a larger and more generous state.
There are several nonmaterial channels through which education can produce more fiscally conservative preferences, some of which are particularly relevant in the case of politicians. First, education strongly affects the composition of people’s networks. Educated politicians will have fewer acquaintances in their networks in situations of unemployment and economic hardship, which should limit the salience of these issues. Vicarious exposure to economic hardship also affects perceptions about the deservingness of those affected and hence views on economic issues (Newman, Reference Newman2013). A second reason why the educational composition of the networks of policymakers is important is that less-educated politicians should be more likely than highly educated politicians to be approached and lobbied by less-educated citizens (because networks facilitate access). Note that this “access channel” does not operate through the preferences of politicians.
Independently of income, risk, and networks, educated politicians may have more conservative economic views because of their different socialization experiences in educational environments during their formative years. Independently of their background, educated politicians have been socialized in secondary and university environments, in which peers of privileged backgrounds abound. Experiences lived in privileged educational environments lead to the development of more conservative worldviews (Mendelberg, McCabe, and Thal 2016). In addition, educated citizens (either because of self-serving biases or because of exposure to the rigors and delayed gratification of schooling) may be more likely to endorse “just-world” beliefs and view inequalities as a result of meritocracy.
Empirically, education has been repeatedly found to predict preferences for economic and welfare policies among citizens. For instance, education is associated with less support for redistribution (Rehm Reference Rehm2009) and social policies (Häusermann, Kurer, and Schwander Reference Häusermann, Kurer and Schwander2016), more support for economic globalization (Naoi Reference Naoi2020), and opposition to protectionism (Hainmueller and Hiscox Reference Hainmueller and Hiscox2006).Footnote 3 Also in Spain, education is associated with right-wing economic policies (Calzada and Del Pino Reference Calzada and Del Pino2008).
We expect governments led by educated politicians to reduce the size of the state and use less interventionist and expansionary policies. The most relevant evidence supporting this expectation is provided by Carnes and Lupu (Reference Carnes and Lupu2015) who find that politicians with a working class background (which correlates very strongly with education) sponsor more “leftist” bills and have more leftist ideal points. These authors look at legislative activity and do not examine if the class of legislators ultimately affects policy outcomes. There is some indirect evidence that the educational background of decision-makers may affect the fiscal conservatism of the policies they adopt and the economic results they obtain. For instance, the education and professional background of central bankers affect monetary policies (Adolph Reference Adolph2013; Gohlmann and Vaubel Reference Gohlmann and Vaubel2007), as well as the resulting inflation and unemployment rates. These studies focus mostly on the type of university education achieved and do not examine elected politicians but high-level economic decision-makers. Dreher et al. (Reference Dreher, Lamla, Lein and Somogyi2009) examine the effect of the educational level and background of the heads of government on the adoption of market-liberalizing reforms and find that, in some specifications, educated heads of government are more likely to initiate such reforms. Our main hypothesis is thus that governments led by educated politicians implement more conservative fiscal policies.
Testing this hypothesis poses an important identification challenge because of the correlation between the education of the population, of politicians, and of municipal- and party-level characteristics. Our research attempts to disentangle the effect of educated governments using a quasi-experimental regression discontinuity design focusing on municipal elections in Spain.
Institutional Background and Data
To examine the impact of education on government performance and fiscal policies, it is crucial to understand the constraints faced by politicians in a particular context. As our empirical analyses are focused on Spanish local governments, in this section we describe their main features with emphasis on how the members of the city council are elected, the structure of local public finances, and the capacity of local politicians to influence fiscal policy. We also discuss the data used to test the hypotheses and the construction of our main variables.
Spanish Local Elections
Spain has a decentralized political system with elected governments at the national, regional, and municipal level. Since 1979, citizens elect local councils every four years in about 8,000 municipalities, but our analysis only includes municipalities with more than 1,000 inhabitants.Footnote 4 Depending on their size, municipalities elect nine councilors or more using a closed party list proportional representation system (PR). In the first meeting, the local council elects a mayor, which is usually the first candidate of the party list with the most votes. The city council is the main decision-making body during the legislature and is responsible for approving the budget, tax codes, laws, regulations, and zoning.
Spanish local governments have considerable influence on the well-being of citizens. By law, municipalities are required to provide a number of services such as waste collection, street cleaning, public lightning, sewerage, and roads pavement. In addition, larger municipalities must provide other services depending on their size. They can also provide additional goods and services on a voluntary basis. Municipalities manage about 14 percent of total public expenditure. This figure is similar to countries like Belgium, Austria, Portugal, or Germany. They are, however, an important employer at 647,000 employees in 2015 according to the Ministry of Territorial Policy and Administration. Section S1.1 in the supporting information complements this description with further details about Spanish electoral law.
Local Public Finances
The revenues of local governments come from own resources and transfers from other levels of government. Municipalities can levy a number of taxes and fees, and receive fixed shares of the revenues of indirect taxes and the income tax. In 2009, taxes and fees amounted to 43 percent of total revenues. Current transfers amounted to 27 percent of revenues, with the main grant being the revenue-sharing grant transferred by the central government using a fixed formula based on population size and other parameters. Most other grants, including European grants, are earmarked for specific purposes. Regarding expenditures, the bulk of local expenditure (84 percent) was approximately equally distributed between three categories: personnel (29.4 percent), current goods and services (28.3 percent), and real investment (26.9 percent). The empirical analyses focus mostly on the largest categories.
As in other countries, the discretion that local governments have over expenditures is greater than their capacity to raise revenues. Municipalities have a limited capacity to issue debt and can mostly influence revenues by raising or reducing local taxes and by attracting grants.Footnote 5
Data: Politicians, Performance, and Fiscal Policy
Our analyses draw on an original dataset with individual-level information about the characteristics of local councilors elected in Spain in 2003 and 2007. Municipalities collect the data and send it to the Spanish Ministry of Finance (Ministerio de Hacienda y Administraciones Publicas), which granted the authors access. The dataset details the education, gender, age, and occupation of local council members.Footnote 6 Our dataset contains information on around 1,200 municipalities with more than 1,000 inhabitants for two terms of office (2003–2007 and 2007–2010). This coincides with a broadly expansionary economic cycle during the Spanish housing boom which lasted approximately until 2008, which was then followed by a deep economic crisis.
In our dataset, as expected, highly educated citizens are overrepresented among politicians. On average, the education of local councilors in our sample is thirteen years with a standard deviation of 2.42. The level of education of mayors is slightly higher at fourteen years. This is significantly higher than the education of the Spanish adult population, which according to the census is less than ten years on average.Footnote 7
We complement the dataset about the individual characteristics of local politicians with extensive municipal-level information on electoral results, performance outcomes, and fiscal data. The share of votes for the different parties is obtained from the Spanish Ministry of Home Affairs (Ministerio del Interior), which also provides data about population size, the number of registered voters, and the party of the mayor. We collect a variety of performance indicators to test whether educated mayors perform better,Footnote 8 suggesting that they have higher “quality.”
We view unemployment as an important indicator of economic performance. Although unemployment is not directly affected by municipalities, they can create jobs through public hiring or stimulating the local economy. Another performance indicator is population growth, which may be a proxy for the attractiveness of the municipality. We use deficit per capita as an additional measure of performance, although we acknowledge that this is debatable given that municipalities could use deficit to counteract economic cycles. Our next indicator of quality is the share of the vote for the incumbent party at the next election. Finally, we calculate the deviation between the budget approved for a given year (forecasted) and the actual amount spent in that year. This measures the ability of governments to administer their budgets as they intend to.
For our analyses about the effect of education on fiscal policies, we gather data from the annual budgets (liquidaciones) provided by Spanish municipalities and collected by the Ministry of Finance (Ministerio de Hacienda y Administraciones Publicas). We focus on the most important categories, these are total nonfinancial revenues and expenditures per capita and their main categories: capital transfers, current transfers, taxes and fees, capital spending, and spending on current goods and personnel.
Each observation in our dataset represents one municipality during a mayoral term. Compared to the original sample, our final sample is reduced significantly for several reasons. First, we exclude all municipalities with less than 1,000 inhabitants because, as mentioned, many variables are not available for these municipalities. We also exclude places where the mayor is not among winner and runner-up (2 percent) and where both the winner and runner-up have a university degree.
Empirical Strategy
As educated politicians are not randomly assigned to municipalities, many time-invariant and time-varying unobservable factors can be correlated with both the education of mayors and economic outcomes. For example, changes in voter preferences or in the composition of the population may influence both demand for different fiscal policies and for more-educated politicians. Thus, empirical approaches such as fixed-effects models are unable to establish causal links. To overcome concerns about endogeneity, we employ a Regression Discontinuity (RD) design to estimate the effect of the education of mayors on government performance and fiscal policies in Spanish municipalities. The intuition of the RD design is that municipalities where the party with the most educated candidate wins are very similar to municipalities where the most educated candidate lost (i.e., the latter are a good control group for the former). At the limit, the outcomes of these elections can be treated as random, which allows obtaining quasi-experimental estimates of the effects of interest.
We focus on municipalities in which the two parties with the highest and second highest number of seats (usually the main government and opposition parties) vary in the university attainment of their leading candidates. That is, we include only municipalities where one of the two main candidates had a university degree, while the other did not have it. To construct our forcing variable, we calculate the vote margin (vit) of the party with a university-educated candidate as the percentage of votes this party needs to win (lose) to become the winner (the runner-up) in terms of seats.
The RD approach has been mostly applied to majoritarian electoral systems such as the United States. By contrast, Spain has a PR system in which the party that wins an election may not be in government if it has less than 50 percent of seats and other parties can form a coalition with a majority of seats. In about 94 percent of municipalities in our sample, the mayor belongs to the winning party. We follow Curto-Grau, Sole-Olle, and Sorribas-Navarro (Reference Curto-Grau, Sole-Olle and Sorribas-Navarro2018) and Folke (Reference Folke2014) and implement a fuzzy set regression discontinuity design adapted to PR systems.
More formally, we estimate the following equations:
 (1)
(1) (2)
(2)where uit equals 1 if the mayor in municipality i at time t has a university degree. The variable yit refers to the outcomes of interest in fiscal year t. Our forcing variable – the margin of victory of the candidate with a university degree – is represented by vit and we construct a dummy variable dit that equals 1 if this margin is positive and 0 if it is negative. The margin of victory is based on the outcomes of the most recent election.Footnote 9 The function f (vit) is a function of the forcing variable fitted on each side of the threshold.
We report estimates using local linear regressions and a data-driven optimal bandwidth as per Calonico, Cattaneo, and Titiunik (Reference Calonico, Cattaneo and Titiunik2014a, Reference Calonico, Cattaneo and Titiunik2014b). All specifications report cluster standard errors at the municipality level and include time and region fixed effects as Spain presents significant regional heterogeneity in political and economic characteristics. The coefficient of interest, α1, is the Local Average Treatment Effect (LATE), which is a robust estimate of the causal effect for observations near the threshold.
Validation of the RD Strategy
The validity of the RD estimates relies on the assumption that the forcing variable, in this case the margin of victory of the party with a university-educated candidate, is not manipulated by political parties. When the margin of victory is very narrow, winning or losing the election should be a random event not influenced by electoral fraud. To check this assumption, we use the manipulation test proposed by Calonico, Cattaneo and Titiunik (Reference Calonico, Cattaneo and Titiunik2015). Figure 7.1 shows that, at the threshold, the density of the forcing variable is not discontinuous. This means that when candidates of different education levels compete in a close election, neither the more-educated nor the less-educated candidate has a significantly higher likelihood of winning.
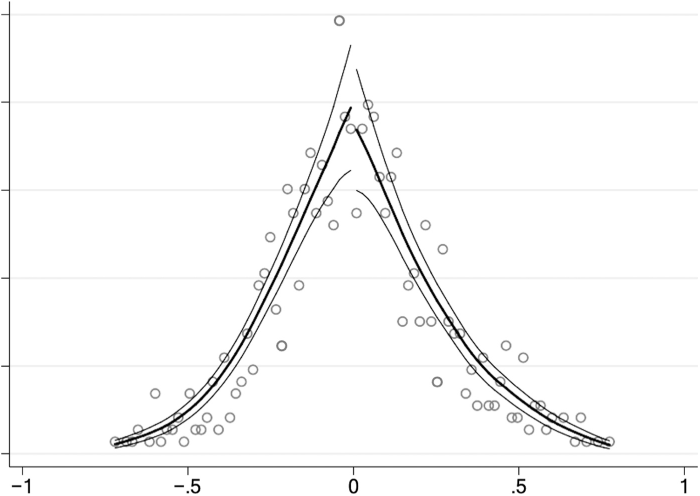
Figure 7.1 Continuity of the forcing variable
Note: Density plot of the forcing variable computed with rddensity Stata program.
In Table 7.1, we test for the presence of discontinuities for key political and socioeconomic variables. We find discontinuities in the mayors’ gender. This reflects the fact that female candidates tend to be better educated than male candidates. To address concerns that differences in the gender of mayors might affect our results, we control for this variable on both sides of the threshold in the main analyses. We also find a discontinuity in the percentage of retired citizens living in the municipality and control for this in the analyses.
Table 7.1 Discontinuities in political and socioeconomic covariates
| Coef. | SE | |
|---|---|---|
| Female mayor | 0.273* | (0.111) |
| Mayor’s age | 4.624 | (2.695) |
| Party alignment with regional government | 0.176 | (0.152) |
| Party alignment with central government | 0.208 | (0.157) |
| Party alignment with provincial government | 0.085 | (0.153) |
| Left-wing mayor | 0.182 | (0.152) |
| Majority government | 0.082 | (0.159) |
| Mayor is manager | −0.152 | (0.122) |
| Turnout | −0.020 | (0.031) |
| Initial debt per capita | −24.99 | (15.66) |
| Population | 7.338 | (4.963) |
| Density | 731.0 | (474.7) |
| % Population <14 | 1.068 | (0.995) |
| % Population >65 | −4.716* | (2.107) |
| Income | −0.063 | (0.0474) |
| Weight of tertiary sector | 4.074 | (4.355) |
| % Foreigners (EU) | 0.0773 | (0.658) |
| % Foreigners (non-EU) | −0.955 | (0.118) |
| % College education | −1.150 | (2.631) |
Note: *p < 0.1.
In addition, the descriptive analyses provide information about the education of the politicians involved in the mayoral races. Almost 46 percent of mayors have a university education and the figure is very similar for politicians who ended up in the second position.
Additional analyses show that in 49 percent of municipalities, the percentage of local government politicians educated in university is higher than the percentage of local opposition politicians educated in university. This finding suggests that mayoral races are on average balanced in terms of the education of politicians who win or lose the election (i.e., it is not the case that more-educated politicians managed to win close races at a higher than expected rate). This finding is confirmed when we look at an alternative indicator, the average years of education of government (thirteen years) and opposition members (13.2 years). Although the average is close to zero, Figure 7.2 shows that there is sizeable variability in the education levels of government and opposition members in individual races. On average, government members have 0.17 fewer years of education on average than opposition members (the mean difference is negative), but the standard deviation is 2.9 years, suggesting significant variation across municipalities.
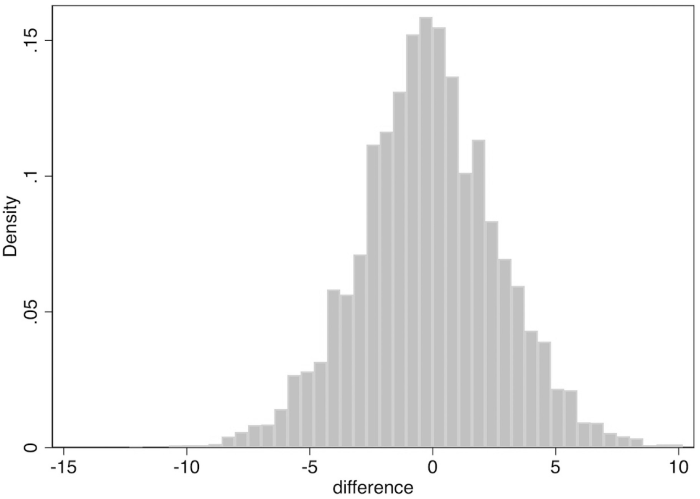
Figure 7.2 Distribution of difference in average years of education of government and opposition members
Results
In the empirical analyses, we first examine if educated politicians perform better in office using a variety of indicators. After showing that this is not the case, we present the main empirical analyses which test the hypothesis that the educated governments choose more conservative policies with extensive data on local finances.
Education and Government Performance
This section provides evidence about the causal effect of education on several performance indicators. To start, in column 1 of Table 7.2, we regress unemployment rates on the level of education of the government and find that electing mayors with a university degree leads to an increase of 0.36 percentage points in local unemployment rates, a 4 percent increase in unemployment. As discussed earlier, given the characteristics of the Spanish economy, we regard unemployment as a particularly important indicator of performance. Educated politicians perform worse in this respect.
Table 7.2 Effect of mayors with university degrees on performance outcomes
| Unemployment rate | Population growth | Incumbent vote at t+1 | Deviation from exp. budget | Primary deficit pc | |
|---|---|---|---|---|---|
| Education | 0.357 | −0.215 | −0.646 | −1.148 | 2.163 |
| (0.194)* | (0.634) | (1.003) | (1.296) | (5.526) | |
| Bandwidth | 0.185 | 0.190 | 0.158 | 0.168 | 0.173 |
| Mean outcome | 8.29 | 4.99 | −1.40 | 1.38 | −5.47 |
Notes: Standard errors clustered at the municipality level in parentheses, *p < 0.1, **p < 0.05, ***p < 0.01. All RD estimates are obtained by local linear regression and optimal bandwidth as per Calonico, Cattaneo, and Titiunik (Reference Calonico, Cattaneo and Titiunik2014a). All specifications include time and region fixed effects. Unemployment growth = percentage change in unemployed people (as a share of working-age population) between the first and last year of the legislature. Primary deficit and total expenditures (columns 3 and 4) are expressed in euros per capita. Deviation from exp. budget = percentage difference between the actual expenditure budget and its initial forecast approved by the local government.
We also test whether the government’s education affects population growth, which can signal quality if people are attracted to municipalities with a better provision of public goods and services. In column 2 of Table 7.2, we present the estimates of regressing municipal population growth from the start to the end of four-year electoral terms (hence the smaller number of observations) on the average education level of the government and find no statistically significant effect. Balanced budgets can also be regarded as indicators of good government performance, although deficit and surplus can also be a counter-cyclical fiscal policy used by governments. In column 3, we show the results of regressing the level of primary deficit per capita on the level of education. There is no evidence that more educated governments run smaller deficits.
Another indicator of government performance is the vote share of the incumbent in the next election. Voters should reward good governments such that the vote share of a well-performing incumbent party should be higher than the average incumbent. We test this hypothesis in column 4 and find that more-educated politicians do not perform better. Lastly, we examine whether more-educated governments are better at forecasting the spending needs of the municipality and able to stick to their own proposed budget. We construct a variable that measures the percentage difference between the actual expenditures and their initial forecast approved by the local government at the start of the fiscal year. The estimates in column 5 show that the education of the government has no statistically significant effect on this indicator.
The Effect of Education on Fiscal Policies
This section analyzes if the education of politicians affects the choice of fiscal policies. Table 7.3 presents LATE estimates using key spending and revenue categories of the local budget as dependent variables. We focus on the largest budget chapters, as discussed earlier. Except for current revenues, local governments have considerable discretion to influence these chapters.
Table 7.3 Effect of mayors with university degrees on fiscal outcomes
| Variable | Coef. | SE | Mean outcome |
|---|---|---|---|
| Nonfinancial expenditures | −36.114 | (12.493)*** | 949.98 |
| Personnel spending | −5.57 | (4.94) | 290.48 |
| Goods and services spending | −8.52 | (5.24) | 281.77 |
| Capital spending | −15.71 | (7.18)** | 288.59 |
| Nonfinancial revenues | −32.41 | (11.67)*** | 965.24 |
| Current transfers | −6.23 | (5.18) | 289.69 |
| Capital transfers | −12.60 | (5.41)** | 180.86 |
| Taxes and fees | −8.85 | (8.94) | 410.23 |
Notes: Standard errors clustered at the municipality level in parentheses, *p < 0.1, **p < 0.05, ***p < 0.01. All RD estimates are obtained by local linear regression and optimal bandwidth as per Calonico, Cattaneo, and Titiunik (Reference Calonico, Cattaneo and Titiunik2014a). All specifications include time and region fixed effects. The dependent variables are expressed in euros per capita and the figures represent averages over the four-year term of office.
The results indicate that more-educated mayors reduce expenditures and revenues per capita. Mayors with university degrees decrease total spending per capita by 36 euros (3.8 percent lower expenditures) and total revenues per capita by 32 euros (3.3 percent less funds). The negative effect of mayors’ education on local public spending is driven by lower capital spending, while the effect on current spending (expenditures on both personnel and current goods) is statistically insignificant. We find that electing a university-educated mayor decreases capital expenditures by 35 euros per capita (11 percent lower investment, on average). With regards to revenues, only capital transfers are affected by the education of mayors. University-educated mayors decrease capital transfers by13 euros per capita (7 percent). Given that capital transfers are used to finance public investment, the negative effect we observe can be attributed to lower capital spending. Although we cannot demonstrate that increased investment reduces unemployment, this is a plausible possibility. By contrast, our results suggest that it is unlikely that less-educated mayors reduce unemployment by increased public hiring, a classical clientelistic strategy.
These analyses suggest that better educated governments are more fiscally conservative, in the sense that they prefer smaller governments than less-educated politicians. Lower total revenues and expenditure are driven by the fact that educated governments invest less and receive lower capital transfers. To shed some light on the areas to which this increased investment may be going, the next section examines spending by “functional” area. This is also informative about the revealed policy priorities of politicians.
The Effect of Education on Key Revenue Categories
Besides capital transfers, city councils can influence some other revenue categories, the most important being revenues from fees and direct taxes. In Table 7.4, we present the RD estimates of the effect of the education of governments on those categories. In contrast to capital transfers, we do not find any effect on the other revenue categories at conventional significance levels.
Table 7.4 Effect of mayors with university degrees on key revenue categories and tax rates
| Coef. | SE | Bandw. | N | Mean outcome | |
|---|---|---|---|---|---|
| Revenues from: Fees | 8.587 | (9.373) | 0.13 | 1,016 | 177.57 |
| Direct taxes | −19.258 | (21.388) | 0.17 | 1,262 | 250.63 |
| Tax rates: Urban property tax | 0.006 | (0.008) | 0.13 | 1,169 | 1.38 |
| Rural property tax | 0.009 | (0.011) | 0.16 | 1,208 | 0.65 |
Notes: Standard errors clustered at the municipality level in parentheses. *p < 0.1, **p < 0.05, ***p < 0.01. All RD estimates are obtained by local linear regression and optimal bandwidth as per Calonico, Cattaneo, and Titiunik (Reference Calonico, Cattaneo and Titiunik2014a). All specifications include time and region fixed effects.
To investigate the influence of education on taxation, we narrow the analysis to the taxes on which city councils have most discretion: the urban and rural property tax. The coefficients are positive, but they are insignificant and the magnitudes are very small. Thus, it is unlikely that the education of governments influences tax revenues to a large extent.
The findings about taxes and fees are relevant because they once more disconfirm the claim that less-educated governments have a lower quality. We found earlier that less-educated governments spend more, but these analyses suggest that they are not incurring more deficit nor are they increasing fiscal pressure. Hence, their higher spending is not financed through strategies that could be detrimental in the long term. Rather, it seems that less-educated governments finance higher spending by attracting capital transfers from other administrations.
Effects on Spending Areas
Our dataset provides information about how total spending is distributed across policy areas. These functional data are rare and valuable, but much noisier than the data about types of spending presented earlier. First, many municipalities do not report this data, leading to a higher number of missing values. Second, the classification of budget items to policy areas is often subjective and the internal organization of areas in policy departments varies substantially across municipalities, leading to more measurement error.
In 2009, two out of eight investment items, production of public and social goods and production of economic goods absorbed 87.4 percent of local capital expenditures and 62 percent of total spending. The most important areas in budgetary terms are housing, community welfare (including waste and water management), culture, and basic infrastructure. By contrast, spending on areas such as health and education is low because municipalities only have residual powers on these policy areas.
Table 7.5 presents the findings regarding the effect of the education of mayors on total expenditures (including capital spending and other types of spending) in the two main functional categories and their corresponding subcategories. For each expenditure area and each year, we compute the share of total expenditures allocated to that function. Following previous work (e.g., Gerber and Hopkins Reference Gerber and Hopkins2011), we use this measure because it reflects policy preferences better than per capita spending. The results indicate that electing a mayor with a university degree decreases spending on basic infrastructure, transportation, and agrarian infrastructure. These results are also important. Basic infrastructure and transportation projects may be one of the targets of the increased investment we detected in previous analyses. This again is consistent with our interpretation that less-educated politicians adopt more Keynesian policies.
Table 7.5 Effect of governments’ education on key areas
| Expenditure by function | Coef. | SE | Mean outcome |
|---|---|---|---|
| Production of public and social goods | 1.216 | (0.746) | 47.02 |
| Health | 0.189 | (0.245) | 1.68 |
| Education | 0.209 | (0.178) | 3.87 |
| Housing and urban planning | 0.558 | (0.532) | 14.14 |
| Community welfare | 0.034 | (0.313) | 10.87 |
| Culture | 0.218 | (0.314) | 13.00 |
| Other social and community services | −0.081 | (0.270) | 3.63 |
| Production of economic goods | −1.008 | (0.497)** | 10.96 |
| Basic infrastructure and transportation | −0.890 | (0.481)* | 9.91 |
| Communications | 0.019 | (0.018) | 0.13 |
| Agrarian infrastructure | −0.115 | (0.060)* | 0.63 |
| Research | 0.019 | (0.014) | 0.034 |
| Basic information and statistics | −0.031 | (0.031) | 0.15 |
Notes: Standard errors clustered at the municipality level in parentheses, *p < 0.1, **p < 0.05, ***p < 0.01. All RD estimates are obtained by local linear regression and optimal bandwidth as per Calonico, Cattaneo, and Titiunik (Reference Calonico, Cattaneo and Titiunik2014a). All specifications include time and region fixed effects. The control variables included in all regressions are: % female government members, mayor’s education, average years of education of the opposition members, and a binary variable for left-wing mayors. Revenues from fees and direct taxes are measured in euros per capita.
Robustness Checks
Placebo Tests
We conduct a series of placebo tests in order to increase confidence in the validity of our findings. The most relevant test is to examine the effect of the education of mayors on dependent variables lagged one period.Footnote 10 The estimates presented in Table 7.6 show that the education of mayors elected in certain year does not have any statistically significant effect on fiscal outcomes of the previous term as politicians do not have the capacity to influence such outcomes. This increases our confidence that the results presented in this chapter are not due to chance.
Table 7.6 Effect of mayors with university degrees on lagged fiscal outcomes
| Variable | Coef. | SE |
|---|---|---|
| Total expenditures | −15.50 | (17.22) |
| Personnel spending | 1.63 | (5.70) |
| Goods and services spending | −4.61 | (6.43) |
| Capital spending | −14.09 | (11.25) |
| Total revenues | −19.16 | (17.44) |
| Capital transfers | −1.47 | (8.36) |
| Current transfers | 2.02 | (6.24) |
| Financial revenues | −3.33 | (3.94) |
| Taxes and fees | −13.74 | (12.09) |
Notes: Standard errors clustered at the municipality level in parentheses, *p < 0.1, **p < 0.05*** p < 0.01. All RD estimates are obtained by local linear regression and optimal bandwidth as per Calonico, Cattaneo, and Titiunik (Reference Calonico, Cattaneo and Titiunik2014a). All specifications include time and region fixed effects. The dependent variables are expressed in euros per capita with one period lag (i.e., the education of governments during term t is regressed on fiscal outcomes of the previous term that this government cannot influence).
The results confirm that the education of governments has no statistically significant effect either on the revenues obtained through direct taxation or on financial expenditures.
Who Is Driving These Results?
We examine whether the effects of the education of mayors on economic outcomes and fiscal policy differ for left- and right-wing governments. To estimate heterogeneous local average treatment effects (HLATE), we interact the explanatory variable of interest (university-educated mayor) with a dummy variable that equals one if the mayor is left-wing (Left). Table 7.7 shows these results. The estimates suggest that the role of education in affecting nonfinancial and current expenditures does not differ significantly for left- and right-wing governments, although we note that all interaction coefficients are negative. Columns 3 shows that the preference of left-wing governments for more capital spending is lower when the mayor is more educated. Specifically, electing a mayor with a university degree reduces the large effect of having a left-wing government on spending by 35 euros per capita. The interaction term Education × Left is also significant for nonfinancial and capital expenditures and indicates that the effect of having a left-wing mayor on revenues is decreased by 42 euros per capita when the mayor has a university degree. All in all, the results suggest that highly educated left-wing mayors choose more fiscally conservative fiscal policies.
Table 7.7 Heterogeneous effects of governments’ education: left- and right-wing parties
| Nonfinancial expend. | Current expend. | Capital expend. | Nonfinancial rev. | Capital rev. | |
|---|---|---|---|---|---|
| Education | −49.448 | −6.133 | −14.082 | −23.048 | 14.859 |
| (60.023) | (20.223) | (30.701) | (51.658) | (23.560) | |
| Left | 610.845 | 9.510 | 478.887 | 441.623** | 251.832 |
| (367.438)* | (136.194) | (197.334)** | (316.019)* | (138.052)* | |
| Education × Left | −44.466 (27.785) | −1.204 (10.359) | −35.293 (15.070)** | −41.615 (23.860)* | −17.577 (10.486)* |
Notes: Standard errors clustered at the municipality level in parentheses, *p < 0.1, **p < 0.05, ***p < 0.01. All RD estimates are obtained by local linear regression and optimal bandwidth as per Calonico, Cattaneo, and Titiunik (Reference Calonico, Cattaneo and Titiunik2014a). All specifications include time and region fixed effects.
While these results are suggestive, the reasons why they are driven by left-wing parties are unclear. One possibility is that the pathways to political office are different for individuals in left-wing parties with high or low levels of education. Traditional working-class organizations, such as trade unions or other organization, such as agrarian cooperatives, may affect the political preferences and policy priorities of less-educated politicians (making them more likely to embrace what we label “Keynesian” policies) and also be ways in which individuals are recruited and helped to achieve a runner-up position in mayoral races. While this is an interesting possibility, other data would be needed to explore it.
Conclusion
Some scholars believe that educated citizens are more capable political leaders (Dal Bó and Finan Reference Dal Bo and Finan2018). Recent empirical research echoes this elitist view and uses education as a proxy measure of leader quality. Using a detailed dataset about performance outcomes and fiscal policies at the local level, we find that highly educated leaders do not perform better on a variety of indicators. Instead, we find evidence supporting the claim that more educated politicians implement more fiscally conservative policies, both raising less revenue and spending less money. Our database allows us to pin down some aspects of how the actions of more- and less-educated politicians differ. We find that less-educated governments are more expansionary, in the sense that they increase both revenues and spending, but we do not find that they use strategies that may be harmful in the long run. These results suggest that education should not be used as a proxy of leader quality.
Our substantive findings have broad-ranging implications. In sharp contrast to gender or ethnicity, the descriptive representation of less-educated citizens has worsened over time in lockstep with the declining influence of trade unions. Our analyses suggest that the secular decline in the share of less educated politicians within left-wing parties can shift the policies of these parties in a more conservative economic direction (see also O’Grady Reference O’Grady2019). The result could be a mismatch between the preferences of the party leadership and their constituencies, leaving the door open for political entrepreneurs to appeal to the traditional supporters of the left. While we cannot provide direct evidence about the political consequences of the changing composition of politicians, it is noteworthy that the ongoing realignment in advanced industrial democracies (Beramendi et al. Reference Beramendi, Häusermann, Kitschelt and Kriesi2015) is driven in part by changes in how more- and less-educated citizens vote. It is plausible that the increasingly elitist educational makeup of politicians is one reason, among others, why the traditional constituencies of center-Left parties feel disconnected from mainstream parties and search for alternatives such as populist parties.
Our results are also relevant for research about the unequal responsiveness of politicians to the preferences of affluent citizens (Bartels Reference Bartels2016; Giger, Rosset, and Bernauer Reference Giger, Rosset and Bernauer2012; Gilens and Page Reference Gilens and Page2014). A well-known finding is that when the preferences of citizens with a high or low socioeconomic background differ, politicians are more responsive to the preferences of the rich. The mechanisms that generate unequal responsiveness are largely unexplored, though (see Becher and Stegmueller, this volume). One possible mechanism suggested by our findings is the similarity in educational backgrounds between privileged citizens and elites. If educated citizens and elites share preferences and worldviews, it is unsurprising that when the preferences of the public diverge, elites side with people who are descriptively like them.
To be sure, our empirical analysis has limitations. We cannot tease out the relative effect of education, income, and occupation. An important follow-up question is if different types of education and degrees affect preferences in different ways. For instance, the share of lawyers, engineers, or economists in governments may have different effects on policies. Our work focuses on local elections in Spain in a specific time period and further research should establish if the results hold in other political arenas, geographic contexts, and time periods. Although we scrutinize a wide range of outcome measures, we lack some relevant measures of performance such as economic growth, which is not measured at the local level, or corruption. As is well known, RD estimates are internally valid, but they may not apply to contexts in which the margin of victory was not close.
Despite these limitations, the results of our analyses support the view that the education of who is in government affects fiscal policies. According to Hanna Pitkin, having representatives with a similar distribution of politically relevant characteristics as the represented population is important not on its own sake but mainly because we “tend to assume that people’s characteristics are a guide to the actions they will take” Pitkin (Reference Pitkin1967: 89). Our results show that education does guide the actions of politicians and suggest that increasing the substantive representation of these disadvantaged citizens would change fiscal policies and make them less conservative.
Working-class citizens – people employed in manual labor, service industry, clerical, informal sector, and labor union jobs – rarely go on to hold elected office in the world’s democracies. Whereas workers typically make up majorities of most countries’ labor markets,Footnote 1 people who had working-class jobs when they got into politics rarely go on to hold more than 5 percent of the seats in most national legislatures (e.g., Best Reference Best2007; Best and Cotta Reference Best and Cotta2000; Carnes and Lupu Reference Carnes and Lupu2015; Reference Carnes and Lupu2023b; Joshi Reference Joshi2015; Warburton et al. Reference Warburton, Muhtadi, Aspinall and Fossati2021).
These kinds of inequalities in the social class makeup of governments can have important consequences for public policy.Footnote 2 Politicians from the working class – like working-class citizens in most democracies – are more likely than other legislators to have proworker or leftist views about economic issues, preferring state intervention into the economy and a robust social safety net, and they tend to behave accordingly in office, at least to the extent that they have some personal discretion in their official decisions. These differences in politicians’ attitudes and choices – coupled with the sharp numerical underrepresentation of leaders from the working class – seem to tilt policy outcomes in favor of the more rightist preferences of white-collar professionals on economic issues (Alexiadou Reference Alexiadou2020; Borwein Reference Borwein2021; Carnes Reference Carnes2013; Reference Carnes2018; Carnes and Lupu Reference Carnes and Lupu2015; Curto-Grau and Gallego, this volume; Hemingway Reference Hemingway2020, Reference Hemingway2022; O’Grady Reference O’Grady2019).Footnote 3 This may help to explain why rising inequality in recent decades has not been met with the kind of compensatory redistribution that canonical theories might expect (see Lupu and Pontusson, this volume).Footnote 4
Why, then, are working-class citizens so sharply underrepresented in the world’s legislatures? If holding public office can have significant consequences for public policy, it is natural to wonder: What keeps workers out office?
As it stands, no one really knows. Some studies have tested hypotheses that might shed light on why so few working-class citizens go on to hold office in the world’s democracies. Most have been inconclusive; they have yielded null results, or the associations they have uncovered have stopped far short of accounting for the vast underrepresentation of workers. Moreover, all of the existing studies that might help explain why workers are so badly underrepresented have focused either on small numbers of countries (e.g., Carnes and Lupu Reference Carnes and Lupu2016a; Hemingway Reference Hemingway2020; Joshi Reference Joshi2015; Vivyan et al. Reference Vivyan, Wagner, Glinitzer and Eberl2020) or on just one country at a time (e.g., Carnes Reference Carnes2018; Dal Bó et al. Reference Dal Bó, Finan, Folke, Persson and Rickne2017; Griffin, Newman, and Buhr Reference Griffin, Newman and Buhr2019; Matthews and Kerevel Reference Matthews and Kerevel2022; Wüest and Pontusson Reference Wüest and Pontusson2018).
The time seems right for broader cross-national research that explores why so few working-class people go on to hold public office. In that spirit, this chapter takes stock of what scholars know about the causes of working-class officeholding and uses new data on the social class backgrounds of national legislators in the OECD to present initial analyses of several common country-level explanations that have never been tested before using data from a large sample of countries.
Our findings suggest that some hypotheses have promise and warrant future research: working-class people more often hold office in countries where labor unions are stronger and income is distributed more equally. However, some common explanations do not pan out in our data – neither Left-party strength nor proportional representation are associated with working-class officeholding. Moreover, the various country-level explanations that scholars have put forward in the past do not take us very far toward a complete explanation of the phenomenon of working-class underrepresentation; they account for at most 30 percent of the gap between the share of workers in the public and in national legislatures.
Future research would do well, we think, to explore some country-level explanations in more detail, but there may also be limits to what we can learn from country-level analyses. If scholars wish to understand why working-class people so rarely go on to hold office in the world’s democracies, it may be helpful to focus comparative analyses on individual- and party-level explanations as well, and to consider the possibility that there are factors common to all democracies that limit working-class officeholding.
Unequal Officeholding and the Working Class
Research on the numerical underrepresentation of any social group generally tries to answer two questions: when are members of the group screened out of the candidate selection process at disproportionately high rates, and why are they screened out at those stages?
The question of when is the more straightforward of the two, since it is essentially a descriptive question. Broadly speaking, the candidate selection process can be thought of as a series of semidiscrete stages (see e.g., Carnes Reference Carnes2018; Fox and Lawless Reference Fox and Lawless2005; Lovenduski Reference Lovenduski2016; Norris and Lovenduski Reference Norris and Lovenduski1995): (1) a person must have the qualifications and abilities that allow someone to run (i.e., they must be what scholars sometimes refer to as potential candidates); (2) they must have some intrinsic desire to run or hold office (what scholars call nascent political ambition); (3) they must formally declare their candidacy (expressive ambition); (4) in many countries, their party must select them and decide how strongly to support them; and, finally, (5) they must win enough votes to take office. Scholars differ in how granular their accounts of this process are, but at bottom, to determine when a social group is screened out, researchers simply divide the candidate entry process into stages and then measure the group’s representation at each stage in order to determine when, exactly, that group is disproportionately removed from the process of political selection.
The question of why social groups are screened out is more complicated. We can generally divide scholars’ hypotheses into three categories based on the kinds of political phenomena they study: micro- or individual-level explanations, macro- or polity-level explanations, and meso-level explanations.Footnote 5
Individual- or micro-level explanations posit that groups are screened out because of the attitudes and choices of individual citizens, usually potential candidates or voters. This research aims to understand the most immediate reasons why members of a given social group are less interested in running, less capable campaigners, less likely to win votes, and so on. Most scholarship in this category focuses either on the characteristics of potential or actual candidates (Why are qualified women in the United States less interested in running for office? Are attorneys more likely to run because they are better at fundraising?)Footnote 6 or on the characteristics and motivations of voters (Do voters see working-class candidates as more relatable?). In either case, the focus is on the attitudes or choices of ordinary citizens and the immediate antecedents to those choices.
Of course, scholars recognize that individual choices and attitudes are driven by larger macro-level forces like political institutions or economic and social conditions. Researchers who carry out macro-level studies attempt to determine whether there are features of entire cities, states, or nations that might help explain the shortage of candidates or officeholders from a given social group. The most common explanations focus on things like election rules, unionization rates, and economic conditions; studies in this category often begin by simply examining whether the numerical representation of a social group is associated with the aggregate-level characteristics of entire polities. Whereas an individual-level study will usually focus on one discrete stage of the candidate entry process, macro-level research often focuses broadly on whether the characteristics of a country or state is associated with the rate at which a social group holds office, or perhaps the rate at which members of that social group run.
Some explanations are positioned in between the polity and the individual; the most common of these meso-level explanations focus on political parties, hypothesizing that party rules or platforms or the attitudes and behaviors of the leaders of formal party organizations help explain the shortage of a social group in the candidate pipeline (e.g., Norris and Lovenduski Reference Norris and Lovenduski1995; Thomsen Reference Thomsen2017). Of course, the importance of parties in the candidate entry process varies from country to country, but parties are at least influential – if not the exclusive drivers of – the candidate entry process in virtually every democracy. As such, when many scholars seek to understand why a given social group is underrepresented, they focus on the biases and behaviors of political parties and other large, stable organizations within countries.
These different levels of explanation are not mutually exclusive, of course, or inherently in tension with one another. To the contrary, they are often complementary, differing more in terms of where in the theorized causal process they focus (e.g., individual choices, or the groups and institutions that structure those choices). In any given country, theories at all three levels might be useful: people from a given social group might be reluctant to run because they worry that they will not receive needed support (an individual-level explanation) because party leaders so rarely recruit or support them, fearing that they will make worse candidates (a meso-level explanation), which in turn happens because fundraising is so important in elections in that country (a macro-level explanation). In most democracies, we would expect the underrepresentation of a social group to be linked to processes that occur at all three levels. When studying the reasons why a social group is numerically underrepresented in public office, all three levels of analysis can help illuminate the obstacles the group faces.
These frameworks for thinking about when and why a social group is screened out of the political selection process can be used to study any social group in any country. To date, however, there are few studies that use these approaches to shed light on why so few working-class citizens go on to hold office in the world’s democracies. Some of the gaps in the literature are simply geographic: there are roughly 120 electoral democracies in the world, but to date, research on working-class officeholding has only been conducted in around twenty of them. More broadly – and more pressing – there simply are not many studies in this literature in the first place.
On the question of when workers are screened out, most existing studies focus on a single country or a single stage of the political selection process. They usually find no evidence that working-class citizens are screened out because of differences in qualifications or nascent ambition: workers seem just as likely as nonworkers to have characteristics that make them attractive potential candidates (Carnes Reference Carnes2016; Reference Carnes2018), and they appear to be just as interested as nonworkers in running for office (Carnes and Lupu Reference Carnes and Lupu2023a). Numerous studies have also looked at whether working-class candidates perform worse than nonworkers in elections. While some find evidence that workers perform worse (Matthews and Kerevel Reference Matthews and Kerevel2022; Wüest and Pontusson Reference Wüest and Pontusson2018), others find that they perform about as well as – and sometimes better than – nonworkers (Albaugh Reference Albaugh2020; Campbell and Cowley Reference Campbell and Cowley2014; Carnes Reference Carnes2018; Carnes and Lupu Reference Carnes and Lupu2016b; Griffin, Newman, and Buhr Reference Griffin, Newman and Buhr2019; Kevins Reference Kevins2021; Hemingway Reference Hemingway2020; Sadin Reference Sadin2012; Vivyan et al. Reference Vivyan, Wagner, Glinitzer and Eberl2020).Footnote 7 Related studies also find that working-class candidates are often evaluated more positively (Carnes and Lupu Reference Carnes and Lupu2016a; Hoyt and DeShields Reference Hoyt and DeShields2021), especially by working-class voters (Heath Reference Heath2015).
Even if some of the explanation has to do with the election stage, workers seem to be mostly screened out of the candidate entry pipeline at the decision to formally run or apply to run. In England, Norris and Lovenduski (Reference Norris and Lovenduski1995, 121) find that nonprofessionals (a close approximation to working-class people) were less likely to apply to be candidates for the House of Commons (but no less likely to be selected by the party), and in the United States, Carnes (Reference Carnes2018) finds that in state and local elections, working-class people made up over half of the labor force, but less than 5 percent of the people who actually ran for state, county, and local offices (and 3 to 5 percent of the people who won).
Although this body of “when” research points generally to one stage in the candidate pipeline (expressive ambition), there are still many gaps in this literature. So far, the work has been piecemeal, focusing on just one country and just one stage at a time. To our knowledge, no study has ever comprehensively analyzed the candidate pipeline from start to finish in a single country; that is, no study has analyzed a single sample of citizens to check for social class gaps in qualifications, nascent ambition, expressive ambition, party selection, and winning, all in a single, directly comparable group of people. Moreover, almost every published study has focused on just one country; we know of just three that have studied more (Carnes and Lupu Reference Carnes and Lupu2016a; Hemingway Reference Hemingway2020; Kelly Reference Kelly, Morgan, Witko and Enns2019). There is still a great deal of room for research that asks the basic descriptive question of when working-class people are screened out of the political selection process.
The research on when workers are screened out is still emerging, so naturally, research on why they are screened out is scarce and piecemeal as well. We know of just two studies that present positive evidence to support an individual-level explanation about resource constraints (Carnes Reference Carnes2018; Hemingway Reference Hemingway2020) and just a few that test party-level explanations (Carnes Reference Carnes2016; Reference Carnes2018; Hemingway Reference Hemingway2020; Norris and Lovenduski Reference Norris and Lovenduski1995). Some studies note that certain types of parties appear more likely to recruit working-class candidates (Best and Cotta Reference Best and Cotta2000; Joshi Reference Joshi2015; Matthews and Kerevel Reference Matthews and Kerevel2022; Tarditi and Vittori Reference Tarditi and Vittori2021). In particular, leftist parties typically have less affluent core constituencies (Garrett Reference Garrett1998; Huber and Stephens Reference Huber and Stephens2001; Korpi and Palme Reference Korpi and Palme2003), so their voters may prefer working-class candidates, or these parties may be more likely to recruit workers as candidates.
The most common explanations focus on the macro level, highlighting four key factors. One such factor is the strength of labor unions (Carnes Reference Carnes2016; Feigenbaum, Hertel-Fernandez, and Williamson Reference Feigenbaum, Hertel-Fernandez and Williamson2018; Hemingway Reference Hemingway2020; Sojourner Reference Sojourner2013). Where unions are strong, they may have formal arrangements with certain political parties that make it more likely that workers will get on the ballot (Aylott Reference Aylott2003; Høyer Reference Høyer2015; Norris and Lovenduski Reference Norris and Lovenduski1995). Alternatively, since unions often mobilize votes for leftist parties (e.g., Korpi Reference Korpi1983), they may simply help workers already on leftist party lists get elected just by increasing the vote share of leftist parties.
Another macro explanation has to do with features of the electoral system (Carnes Reference Carnes2018; Hemingway Reference Hemingway2020; Joshi Reference Joshi2015). For instance, proportional representation (PR) systems are often thought to ensure that a larger proportion of the electorate is represented (e.g., McDonald and Budge Reference McDonald and Budge2005), promoting a closer connection between voters and representatives (Bernauer et al. Reference Bernauer, Giger and Rosset2015). And PR is also associated with better descriptive representation for other social groups (e.g., Kittilson and Schwindt-Bayer Reference Kittilson and Schwindt-Bayer2010; Schwindt-Bayer and Mishler Reference Schwindt-Bayer and Mishler2005).
Campaign costs, which vary tremendously across countries, are routinely cited by scholars of US politics as obstacles to working-class candidacy and officeholding (Carnes Reference Carnes2018). Finally, places where economic resources are distributed unequally may give more affluent citizens disproportionate political influence (Erikson Reference Erikson2015; Rosset et al. Reference Rosset, Giger and Bernauer2013).
To date, however, most studies of macro explanations focus on just one country or, at best, a handful (see Best and Cotta Reference Best and Cotta2000; Hemingway Reference Hemingway2020), making it hard to draw general inferences about the global phenomenon of working-class underrepresentation. The time seems right, then, for scholars interested in the shortage of working-class politicians to expand their focus to a broader range of democracies and to delve more deeply into the questions of both when and why working-class people are screened out of the political selection process. There is still a lot of ground to cover here.
As a step in that direction, in this chapter, we ask how working-class officeholding varies with four types of macro-level forces that have been cited by scholars in the past as possible drivers of working-class underrepresentation: the strength of Left parties, electoral rules (proportional vs. majoritarian), the costs associated with campaigning (the availability of public financing), and labor market conditions (economic inequality and unionization rates). Using a new dataset, we study the thirty-seven OECD member nations, the largest sample of countries in which these macro-level explanations have been analyzed.
What can we learn from a large cross-national analysis of working-class representation? Can macro-level characteristics like these help explain why so few working-class people hold office in the world’s democracies?
Working-Class Officeholding in the OECD
To find out, we collected an original dataset with a team of collaborators (Carnes et al. Reference Carnes, Golden, Lupu, Nazrullaeva and Wolton2021). This dataset includes individual-level information about the last occupation held by each member of the unitary or lower chamber of the national legislature in each of the world’s 103 large electoral democraciesFootnote 8 during one legislative session between 2016 and 2018 – a total of over 20,000 individual legislators.
Like past research on politicians (e.g., Carnes and Lupu Reference Carnes and Lupu2015; O’Grady 2018) and social class analysis more generally (see Oesch Reference Oesch2013), we focus here on occupations as our measure of social class. Occupational information about politicians is universally observable (unlike income and wealth data), even if the data are not always easy to collect. Moreover, alternative measures like income can vary over a person’s life cycle (a construction worker and a PhD student might earn similar annual incomes but belong to very different social classes) and education often does not determine labor market outcomes (e.g., Bill Gates does not have a college degree). And although politicians often discuss their parents’ occupations, research on parental occupations is mixed at best; studies of lawmakers find that parental occupations are not associated with legislative conduct (e.g., Carnes Reference Carnes2013; Carnes and Lupu Reference Carnes and Lupu2015) or only associated under certain conditions (e.g., Grumbach Reference Grumbach2015; Pilotti Reference Pilotti2015), and studies of ordinary citizens find that for people with similar adult social classes, there is little evidence of a link between the social class of their parents and their adult political views (Barber Reference Barber1970; Langton Reference Langton1969). As Manza and Brooks (Reference Manza, Brooks, Lareau and Conley2008, 204) explain:
Occupation provides the most plausible basis for thinking about how specifically class-related political micro processes and influences occur…. Workplace settings provide the possibility of talking about politics and forging political identity, and work also provides a springboard for membership in organizations where class politics are engaged: unions, professionals associations, business associations, and so forth.
As such, we focus here on lawmakers who had working-class occupations as adults.Footnote 9
We focus in this chapter on data on the occupational backgrounds of legislators in the thirty-seven OECD member countries. With these data, we can carry out simple tests of several hypotheses about the factors that discourage working-class officeholding using new, accurate, aggregate-level data on national legislatures (which to our knowledge did not previously exist; we know of no prior database that includes complete information about the share of working-class lawmakers in the national legislatures of a large number of democracies).Footnote 10
Figure 8.1 plots the rates at which working-class people held office in these thirty-seven countries. For each country, we plot the percentage of lawmakers who were primarily employed in working-class occupations when they were first elected to public office (darker bars) and the percentage of the country’s labor force made up of working-class jobs (lighter bars). We define the working class as people who work in manual labor, service industry, clerical, and informal sector jobs, and people who work for unions that represent these kinds of occupations.Footnote 11
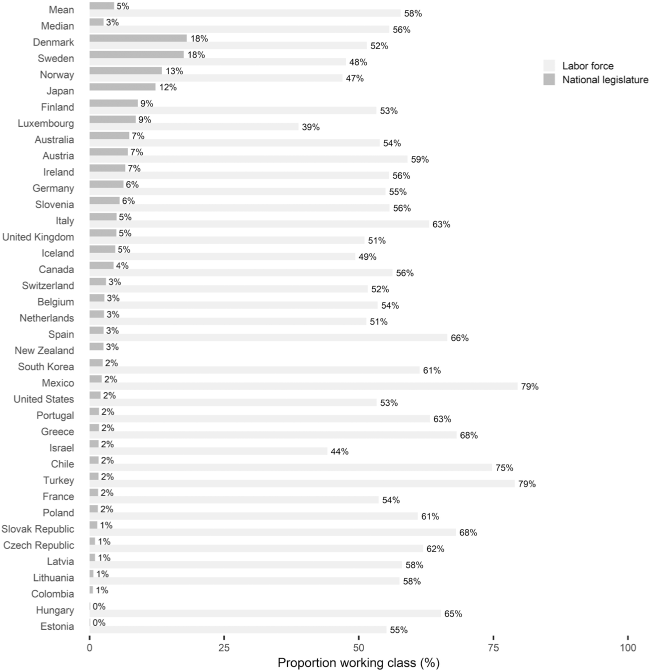
Figure 8.1 Working-class representation in the OECD
As the figure illustrates, working-class citizens are vastly numerically underrepresented in OECD legislatures. In the average country, working-class jobs make up 56 to 58 percent of the labor force, but former workers make up just 3 to 5 percent of the national legislature, a 53-percentage-point gap in the absolute numerical representation of working-class people in elected institutions.Footnote 12 The size of the disparity varies from country to country, of course; it is smallest in Luxembourg, a country that reports below-average rates of working-class jobs in its labor force (due to its exceptionally high rates of employment in white-collar or professional occupations, in particular banking). But even in this best-case scenario of sorts, working-class citizens still make up around four out of every ten employed citizens but just one out of every ten elected legislators, and nonworkers – who we refer to as professionals or white-collar citizens – still make up 90 percent of the legislature, only a little less than what they make up in the average OECD country.
As other studies have argued, the shortage of working-class politicians seems to be essentially orthogonal to the well-documented underrepresentation of women in public office (see also Carnes Reference Carnes2015; Reference Carnes2020). In the individual-level OECD data summarized in Figure 8.1, 4.4 percent of male legislators and 4.9 percent of female legislators came from working-class jobs. If we focus only on the legislators who had working-class occupations, 29.7 percent were women; among nonworkers, 27.2 percent were women. Unfortunately, at this time, we cannot check for racial or ethnic balances with these data.
Does the variation across OECD countries seem to track major macro-level characteristics of countries like Left-party strength, electoral systems, campaign costs, economic inequality, or unionization rates? Do traits like these have the potential to help us understand why so few working-class people hold office in most electoral democracies?
Macro-Level Explanations
Left-Party Strength
Figure 8.2 begins to answer these questions by plotting the representation of working-class people in OECD legislatures (vertical axis) against the rate at which Left partiesFootnote 13 hold office in the same national legislatures (horizontal axis). There is no relationship: workers are no more or less likely to hold office in countries with more Left-leaning national legislatures.
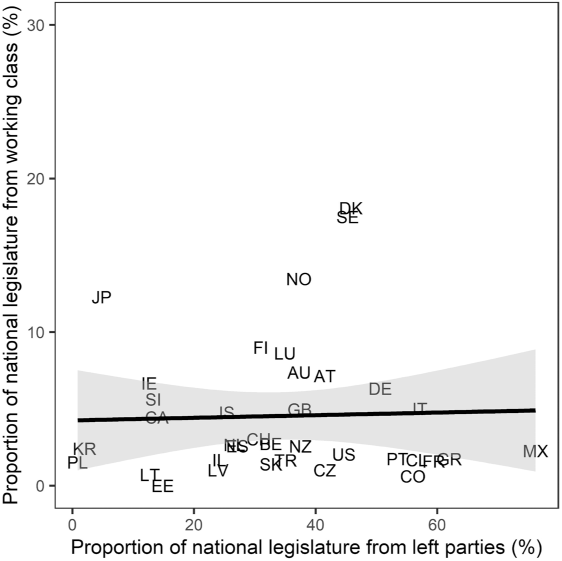
Figure 8.2 Left-party representation and worker representation
Some patterns seem evident, however, in more fine-grained data on the types of Left and Right parties in OECD countries. Among the three leftist party families identified by the Comparative Manifestos Project (ecological, left, and social democratic), the proportion of working-class legislators was 4.3 percent, 6.5 percent, and 6.6 percent, respectively; for the rightist parties, it was 1.7 percent (liberal), 4.3 percent (Christian democratic), 3.1 percent (conservative), 8.1 percent (nationalist), and 4.7 percent (agrarian). In the OECD countries, there is no broad or narrow category of political party in which a large percentage of legislators are drawn from working-class occupations, but the variations here also seem to square with basic intuitions about party families. Left and social democratic party legislators – those from the traditional party families associated with the working classes – are two percentage points more likely to be from working-class occupations than green party legislators, which tend to represent more affluent constituencies. Among the rightist parties, legislators from nationalist parties (many relative political newcomers) are four percentage points more likely to come from working-class occupations, and legislators from liberal parties (the traditional parties of business and capitalism) are three percentage points less likely than others to come from working-class occupations. The differences are modest, but there seems to be a basic logic to the distribution of working-class politicians across party families. These differences do not align with a simple expectation that Left parties will tend to have more working-class politicians, but they suggest that certain party families may be associated with more working-class representation.
Of course, the differences are only marginal; in the OECD countries, the gap between the party families with the most and least working-class legislators in just six percentage points, far smaller than the overall shortage of workers (roughly 53 percentage points). Something beyond simple differences in the party makeup of national legislatures is driving the shortage of working-class legislators.
Electoral Systems
What about electoral systems? Proportional representation systems tend to be associated with greater representation for groups like women and racial or ethnic minorities, and scholars often speculate that PR systems may be more accessible to candidates from the working classes. Pilotti’s (Reference Pilotti2015, 247, emphasis added) research on Sweden found hopeful evidence that “the ratio of elected representatives from working-class families increased after the introduction of PR: less than 10% before the constitutional change to about 15–17% after the reform and until the 1970s–1980s” (see also Joshi Reference Joshi2015). Are legislators who had working-class occupations themselves better represented in proportional representation systems in the OECD?
Figure 8.3 plots the average representation of working-class people, disaggregating OECD countries by the broad category of electoral system they use (proportional, majoritarian, or mixed) and the narrower electoral rules listed in the V-Dem dataset (Coppedge et al. Reference Coppedge, Gerring, Henrik Knutsen, Lindberg, Teorell, Altman, Bernhard, Cornell, Fish, Gastaldi, Gjerløw, Glynn, Hicken, Lührmann, Maerz, Marquardt, McMann, Mechkova, Paxton, Pemstein, von Römer, Seim, Sigman, Skaaning, Staton, Sundtröm, Tzelgov, Uberti, Wang, Wig and Ziblatt2021).Footnote 14 In contrast to research on the representation of other social groups in proportional representation systems, there is no evidence that PR systems tend to have more working-class politicians in their national legislatures (and none of the differences documented in Figure 8.3 are statistically significant). We do not find evidence that the ratio of elected representatives from working-class occupations is higher or lower in proportional or mixed systems relative to countries with majoritarian elections. (Figure 8.A2 in the online appendix reports similar analyses comparing countries by district magnitude and the number of seats in the national legislature.) As far as we can tell, there is nothing about the broad form of national electoral systems that helps account for why so few working-class people hold office in the OECD.
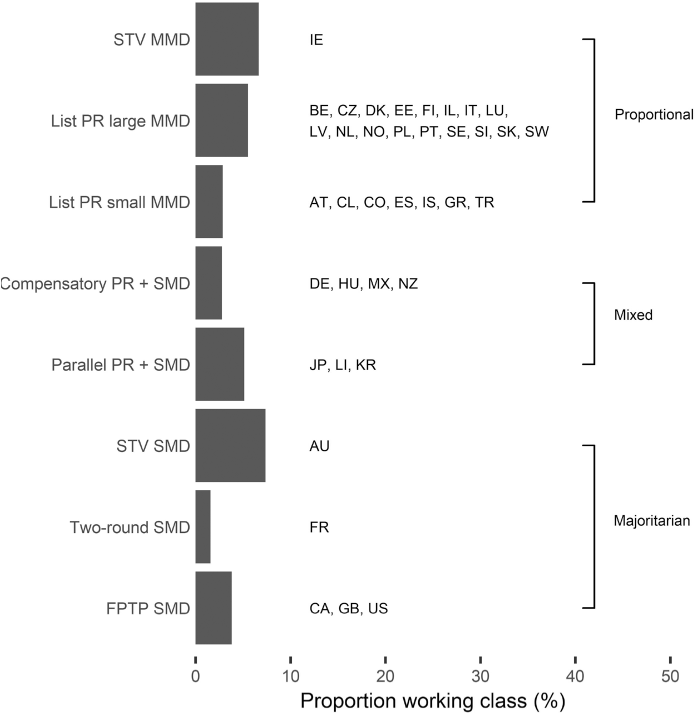
Figure 8.3 Worker representation, by electoral system
Public Financing
Public financing, in contrast, is at least weakly associated with working-class officeholding. Figure 8.4 plots our original data on the occupational backgrounds of elected leaders in the OECD against V-Dem’s measure of public financing liberalism.Footnote 15 In countries where public financing funds a large share of most parties’ expenditures (closer to a 4 on the underlying scale), workers hold office slightly more often, although the difference is not statistically significant (p < 0.06).
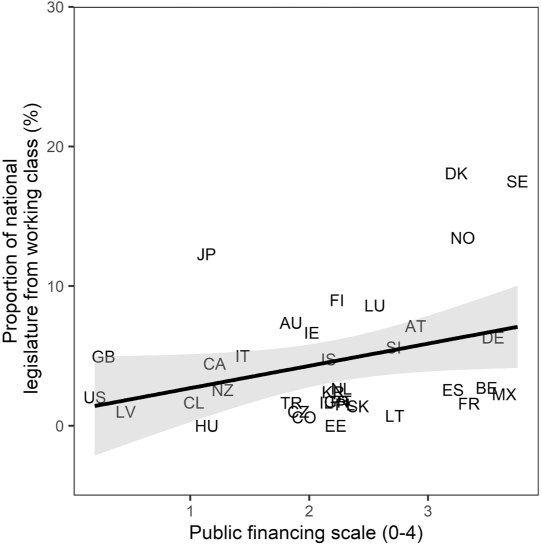
Figure 8.4 Public financing predicts modest differences in worker representation
Like the differences between the party families with the most and fewest working-class members, the differences between countries with the most and least generous campaign finance systems are modest. Extrapolating from the data in Figure 8.4, workers make up close to 0 percent of the average national legislature in a country with no public financing but only about 6 percent of the national legislature in the average country with the most generous public financing system, still almost 50 percentage points short of a complete explanation for the shortage of working-class politicians in the world’s democracies. That is, the campaign finance landscape seems to explain (at most) only a marginal difference in working-class officeholding – far less than a complete explanation for why so few working-class citizens go on to hold office.
Economic Environment
Of the four kinds of macro-level characteristics we examined, the economic characteristics of countries were by far the most strongly associated with working-class officeholding. In Figure 8.5, we focus on three important economic characteristics of the OECD member nations: GDP, economic inequality (measured here as the share of total posttax/transfer income earned by the lowest-income half of the country; results are similar with pretax income), and the country’s unionization rate. All three are statistically associated with working-class officeholding, and the differences are substantial: countries with higher GDPs, more egalitarian income distributions, and more heavily unionized labor forcesFootnote 16 do, in fact, have more working-class people in their national legislatures.
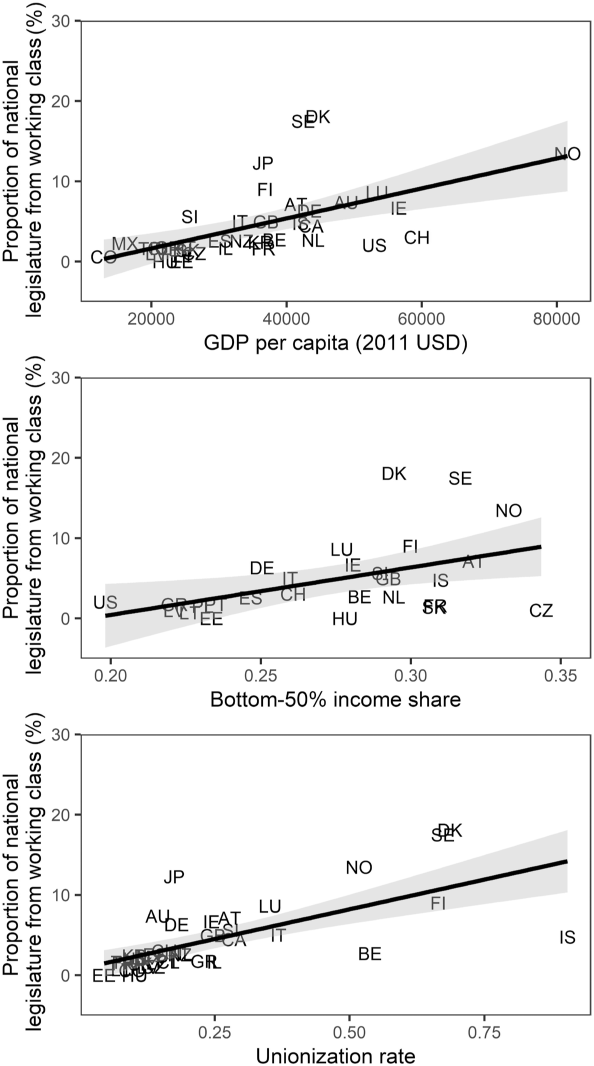
Figure 8.5 Economic characteristics of society matter on the margin
Of course, this kind of analysis – like all the preceding findings – cannot discern the nature of the causal relationships, and in this preliminary study we will not attempt to push the data further than simply documenting these bivariate relationships. It could be that the better economic fortunes of the working classes in these countries cause workers to go on to hold office at higher rates, or it could be that working-class officeholders encourage countries to adopt policies that promote shared prosperity, or both (or neither, if the associations are spurious).
Even if we assume that any of these economic characteristics truly cause working-class representation, these kinds of explanations seem to have the potential to take us only part way to an explanation for why so few workers go on to hold office. Increasing GDP from $20,000 to the maximum in this sample, $80,000, is associated with an increase of 10 percentage points, under one fifth of the total gap between working-class representation in the labor forces and national legislatures of these countries. As unionization rates approach 100 percent or bottom 50 percent income shares approach 50 percent, working-class representation is still projected to be below 20 percent. Even considered in tandem, these three economic variables do not take us far; they are all positively correlated, so if we regress the working class’s percentage in the national legislature on all three variables, then predict worker representation setting all variables at their theoretical or observed maximums (100 percent unionization, 50 percent income going to the bottom 50 percent, and $80,000 per capita GDP), the expected share of workers in the national legislature is just 20 percent. That is, together, these variables only seem to explain about 30 percent of the observed gap between workers and politicians, even when we make the heroic assumption that all three are true causes of working-class representation.
Of course, 30 percent is not trivial. These country-level explanations each warrant future research. But there is still far more to the story of why so few working-class people go on to hold office. Perhaps the country-level variables scholars have often discussed interact in important ways: perhaps proportional representation makes more of a difference in countries where elections are also inexpensive, or perhaps Left-party government matters more in states with strong labor unions. And maybe there are country-level variables we have yet to consider. Or, perhaps there are traits that are common across all modern democracies that discourage working-class officeholding.
Where Should We Go Next?
Our aim with this simple analysis was not to close the case on why so few working-class people hold office in the world’s democracies, but rather to open it in the first place. There has never been broad cross-national research on the question of why so few working-class people go on to hold elected office in the world’s democracies. Our analyses suggest that scholars could learn a great deal from comparative studies that analyze large samples of countries. There is meaningful variation across countries (see Figure 8.1) that differs in some promising ways (like the analysis of economic conditions in Figure 8.5) and also that does not differ much in ways that defy some ideas scholars have put forward about the factors that might be discouraging working-class people to hold office (like the analyses of Left-party strength, proportional representation, and public financing in Figures 8.2, 8.3, and 8.4). The simple first-cut analysis seems to suggest that some popular scholarly explanations may provide a partial explanation for why workers so rarely hold office (but only a partial one), while others may not ultimately be borne out in the data.
Where does this leave us? There is still a great deal that scholars need to learn about the basic question of when in the candidate pipeline working-class people are screened out in most democracies. In almost every democracy in the world, no one actually knows whether working-class citizens are less qualified, less interested in running for office, less likely to run, less likely to be chosen by parties, and/or less likely to win.
The results of this first cross-national analysis suggest, moreover, that scholarship on why so few working-class people hold office should continue exploring in more detail the country-level factors that discourage working-class officeholding. Here we have looked at just four kinds of variables – there are, of course, many more characteristics of countries that deserve our attention. The variables we studied here also beg for more detailed analyses to determine the extent to which the associations (and nonassociations) we document are causal and generalizable.
The fact that all OECD countries have large shortages of working-class officeholders also raises a possibility that transcends even country-level analyses, namely, that perhaps there are universal features of democracies that discourage working-class officeholding. In addition to individual-, meso-, and macro-level analyses, scholars should consider universal-level analyses. Understanding the traits common to democracies will almost certainly require more advanced methodologies than the simple cross-sectional comparisons that have been a staple of research on this topic in the past.
Another way forward might be to engage in cross-national analyses of meso-level forces, in particular the role of political parties and interest groups in facilitating or discouraging working-class representation. Figure 8.6 replots the country-level data on working-class officeholding from Figure 8.1. But now we compare the share of working-class lawmakers in each country’s national legislature (darker bars) and the share of working-class lawmakers in the political party with the highest rate of worker representation in each country’s national legislature (excluding parties with fewer than five delegates; lighter bars).
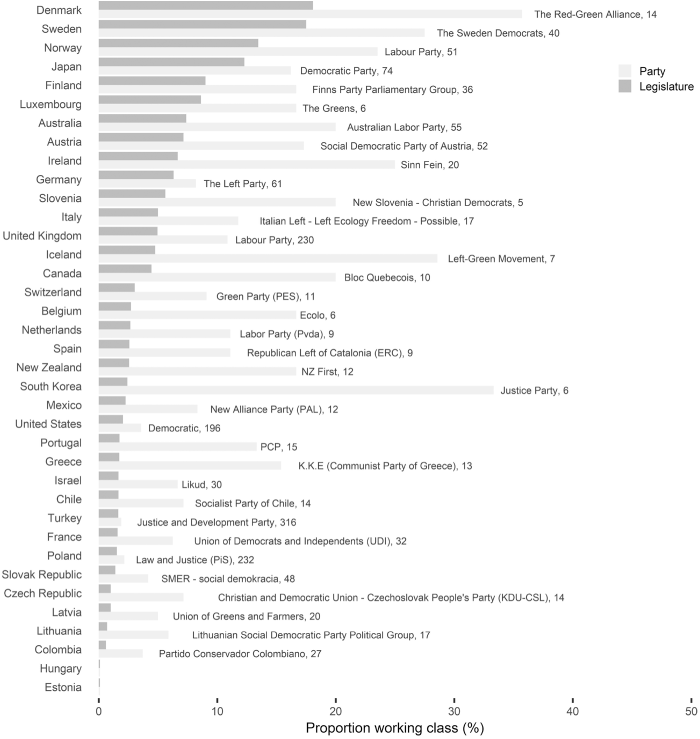
Figure 8.6 Worker representation varies more in parties than countries
Note: Bars report the share of working-class lawmakers in the national legislature (darker bars) and in the party with the highest rate of working-class officeholders (excluding parties with fewer than five members; lighter bars), along with the names of parties and the total numbers of legislators they elected.
Viewed this way, it is easy to see that political parties are far more varied in how well-represented working-class citizens are than countries as a whole. These differences do not seem to track neatly onto existing left-right distinctions or party typologies, nor are they confined only to smaller parties. Something else is driving some parties to run large numbers of working-class politicians and others to sidestep workers in favor of white-collar candidates. Understanding these party-level gatekeeping processes – as scholars have sometimes done in individual countries (e.g., Norris and Lovenduski Reference Norris and Lovenduski1995) – should be a high priority.
Above all, the work must simply move forward. As Thomsen (Reference Thomsen2019, 576) recently put it, “It is rare for scholars to have such an open empirical terrain.” Every approach to studying working-class officeholding – descriptive work on when workers are screened out, and micro-, meso-, macro-, and universal-level research on why workers are screened out – is currently in short supply. The empirical terrain is indeed open, and it is high time for cross-national research to move forward.
Research has demonstrated that public policy in many advanced democracies is biased toward the preferences of affluent and highly educated citizens. They respond little to the interests of the uneducated and poor – or even to those of the average citizen. These findings present a severe challenge for democracy, in which, theoretically, political equality is required. It is thus no surprise that scholars have sought to understand the workings of unequal representation. While there are various mechanisms that could potentially account for these outcomes, including the role of money in politics, descriptive representation, and a supply gap in the party system, we here focus on one complementary mechanism that traditionally has gotten the most attention in the literature: unequal political participation. Political research going back to the early 1970s has argued that systematic inequalities in, for example, who votes, contacts elected officials, demonstrates, and signs petitions, are bound to produce a political system that caters more to citizens who actively voice their opinions. Although the logic of this argument appears sound and much empirical work points to its credibility, scholars have noted a problem of endogeneity. Namely, is responsiveness unequal because of unequal participation, or is participation unequal because of unequal responsiveness? It might very well be that citizens who rarely see their preferences translated to policy are discouraged from participating in politics, and likewise, that citizens who feel that the government is listening to them view participation as effective and meaningful.
Determining the direction of the causal arrow is hard. In this chapter, we make an attempt at estimating the extent to which the reversed causality scenario (unequal representation affecting participation) occurs. Specifically, under the key assumption that unequal representation produces differences in participation mainly through citizens’ subjective perceptions of the system, we can calculate to what extent these beliefs account for gaps in participation across income and educational groups. That is, we can estimate to what extent participation gaps are caused by gaps in perceptions on whether the system can offer adequate representation. To this end, we use Oaxaca-Blinder Decomposition to decompose education and income gaps in participation and estimate counterfactually how large these gaps would have been if low-educated and poor citizens had the same beliefs about the system as the more-educated and affluent citizens. Using nine different measures of system satisfaction and looking at nine different forms of political participation, we find that the gap in voting between the bottom and top education/income quintile would be around 15 to 20 percent smaller if those groups were equally optimistic about the workings of the system and their possibilities for influence. Gaps in other forms of participation would change even less, or not at all. These results provide some evidence that unequal participation is mainly attributable to other factors than the system being perceived as unequally responsive.
Our chapter proceeds as follows. We first discuss previous findings regarding unequal representation, outlining the various approaches in this research as well as the scope of the problem. We then highlight the main findings regarding participation gaps in many developed democracies, including various forms of political participation. Further, we outline why participation would be expected to affect the representation of preferences before dealing with the potential reversed causality puzzle.
Differential Representation Based on Income and Education
The last fifteen years have seen an increasing number of studies exploring if, and to what degree, rich citizens are better represented politically than the less well-off in modern democratic states. Some of these studies compare public opinion with subsequent changes in public policy. Gilens (Reference Gilens2005, Reference Gilens2012) and Gilens and Page (Reference Gilens and Page2014), the most extensive studies of the kind (but see Jacobs and Page Reference Jacobs and Page2005), estimate the relationship between policy outcomes and the opinions of affluent, middle-class, and poor Americans with a dataset of nearly 2,000 policy issues. They conclude that economic elites have “substantial independent impacts on U.S. government policy,” while average citizens “have little or no independent influence” (Gilens and Page Reference Gilens and Page2014, p. 564). Importantly, however, ordinary citizens “often get the policies they favor,” but only because they often agree with economic elites, “who wield the actual influence” (576). Some scholars have criticized their methods and conclusions (Bashir Reference Bashir2015; Branham et al. Reference Branham, Soroka and Wlezien2017; Elkjær and Iversen, this volume; Enns Reference Enns2015; Soroka and Wlezien Reference Soroka and Wlezien2008), and the authors have in turn responded to the critiques (Gilens, Reference Gilens2009, respectively; Gilens Reference Gilens2015a, Reference Gilensb, Reference Gilens2016; Gilens and Page Reference Gilens and Page2016). Other studies of the United States have demonstrated responsiveness bias in favor of the rich with respect to roll-call voting in Congress (Bartels Reference Bartels2016), specific policies at the state level (Flavin Reference Flavin2012), and the broader policy orientations of the Democratic and Republican parties across the states (Rigby and Wright Reference Rigby and Wright2013).
Outside of the United States, single-country studies using more or less the same research design as Gilens (Reference Gilens2012) have been undertaken in Germany (Elsässer and Schäfer Reference Elsässer2018), the Netherlands (Schakel Reference Schakel2021), Sweden (Persson Reference Persson2023), Norway (Mathisen Reference Mathisen2023), as well as comparatively (Mathisen et al., this volume). All find similar results as Gilens, the only partial exception being Norway, where Mathisen (Reference Mathisen2023) finds the poor to have some independent influence on economic issues.
Other studies have taken a cross-national approach to unequal responsiveness using more aggregate policy measures, such as spending or the ideological orientation of governments and parties. Peters and Ensink (Reference Peters and Ensink2015, p. 596) match income-disaggregated support for redistribution with subsequent changes in government social spending for twenty-five European countries. They find that “[l]ower-income groups tend to be under-represented while higher-income groups appear over-represented” and that “low levels of turnout seem to emphasize” this pattern. Bartels (Reference Bartels2017) similarly finds what he calls a “social welfare deficit” of 10 to 15 percent in affluent democracies due to government spending being biased in favor of the preferences of the affluent. Examining congruence around the world by matching citizen and elite surveys, Lupu and Warner (Reference Lupu and Warner2022a) also find that the rich are generally overrepresented compared to the poor, specifically on economic issues. Moreover, Giger et al. (Reference Giger, Rosset and Bernauer2012, p. 57) find that “generally, the poor are represented worse than the rich” in terms of their distance to the nearest party and the government on a left-right scale. However, they observe “considerable variation in the effect” across twenty-one Western democracies. In subsequent work, the authors find that the unequal ideological proximity is smaller in PR systems (Bernauer et al. Reference Bernauer, Giger and Rosset2015) and in countries with lower levels of economic inequality (Rosset et al. Reference Rosset, Giger and Bernauer2013).
So far, this relatively young empirical literature has produced robust evidence suggesting that rich citizens are substantially better represented politically than the average citizen and the poor in Western states. This finding is strengthened by the wide variety of empirical strategies that scholars have utilized, all leading to similar conclusions. Indeed, Bartels (Reference Bartels2017, p. 10) notes that except for his unpublished manuscript on immigration in Europe (Bartels Reference Bartels2017), he has found no study “providing positive evidence of egalitarian responsiveness to the preferences of affluent and poor people.” Recent work by Lupu and Warner (Reference Lupu and Warner2022a), however, does find that the poor are overrepresented on certain cultural issues.
Compared to the work on differential responsiveness based on income, there is little work on the issue with respect to educational differences. Gilens (Reference Gilens2012) showed that in the United States, responsiveness does not increase with education the same as he found with income. On the other hand, Schakel (Reference Schakel2021) and Mathisen (Reference Matthews and Kerevel2022) find that responsiveness is actually more contingent on education than income in the Netherlands and Norway, respectively. Further, an additional study of the Netherlands found that the unequal representation of educational groups extended to both cultural and economic policy issues (Schakel and Van Der Pas Reference Schakel and Van Der Pas2021). These studies indicate that differential responsiveness is not limited to affluence but extends to educational differences.
Understanding Differential Representation
Scholars have identified a range of possible causes for existing political inequality based on income, ranging from an unequal influence of interest groups (Gilens and Page Reference Gilens and Page2014), a supply gap in the policy space covered by political parties (Rosset and Kurella Reference Rosset and Spohie Kurella2021), money in politics (Flavin Reference Flavin2015a), the structural power of business (Young et al. Reference Young, Banerjee and Schwartz2018), skewed descriptive representation (Butler Reference Butler2014; Carnes Reference Carnes2013; Carnes and Lupu Reference Carnes and Lupu2015), to the way that the media reports economic news (Jacobs et al. Reference Jacobs, Scott Matthews, Hicks and Merkley2021). Recently, Lupu and Warner combined different explanations of why some countries experience more affluence-based unequal representation than others and found that economic conditions and good governance are the most important determinants (2022b).
At the same time, scholars of political participation have long argued that the systematic inequality in participation is a main source of unequal representation (e.g., Dalton Reference Dalton2017; Lijphart Reference Lijphart1997; Schlozman et al. Reference Schlozman, Verba and Brady2012). We argue that, indeed, unequal political participation is a complementary explanation and likely contributes to unequal representation. Even if the important structural factors would not incentivize politicians to be more responsive to the rich and more educated, politicians would still struggle to represent preferences more equally because poorer and less-educated citizens tend to be less involved in politics. In this section, we provide an overview of the inequalities in participation that previous research has found and present some data to suggest that gaps in participation on the basis of education and income still exist today. Second, we outline the potential mechanisms that would lead unequal participation to cause unequal representation. We consider participation beyond voting alone because, while often less immediately consequential to political careers, other forms of participation emphasize the communication of preferences. Indeed, politicians may learn more about citizen preferences through alternative participation than through voting.
Unequal Political Participation
Democracies need the participation of its citizens in order to function, and because political participation informs governments about the policies that citizens want, citizens should participate in more or less equal ways. Often, however, this is not the case. Research has shown that people with some backgrounds are more likely to be involved than others. In many cases, citizens are not equally likely to engage in active forms of participation. Citizens with more resources, that is, time, money, and skills, are more likely to participate politically than those with fewer resources (see, in particular, Verba and Nie Reference Verba and Nie1972; Verba et al. Reference Verba, Schlozman and Brady1995). For one, citizens need to be able to understand something about politics, both in terms of the contents as well as the participation procedures. Politics can be complex, and not all citizens feel equally capable of participating effectively. Indeed, Gallego (Reference Gallego2010) demonstrates that in contexts where voting procedures are easier, and where there are fewer political parties, turnout inequality based on education is reduced. Moreover, with the decline of the welfare state and increasing labor market inequalities (Häusermann, Kemmerling, and Rueda Reference Häusermann, Kemmerling and Rueda2020), labor is now also more divided in being either more secure or more fragile. This development affects political preferences but is also likely to affect the available time and energy that some people have. It may, for example, imply that some people work double or even triple jobs in order to earn a sufficient income, leaving these people with little time resources. Labor market inequalities, thus, further emphasize a difference in resources, encouraging unequal participation.
The inequality in resources thus tend to lead to inequalities in participation. In their meta-analysis on the individual determinants of voting, Smets and van Ham (Reference Smets and van Ham2013) show that most studies find education, income, and social class to be important predictors of voting. It appears that a social-status gap exists in terms of who votes, where higher status individuals are more politically active (Dalton Reference Dalton2017, p. 57) and are thus more likely to communicate their preferences through a vote. These inequalities are not limited to voting, however, but apply to many forms of political participation. Income, education, and citizens’ occupation often affect the likelihood of being engaged in contacting, donating money, protesting, and online activism (see, e.g. Dalton Reference Dalton2017; Schlozman et al. Reference Schlozman, Verba and Brady2012). People from a higher social class and with a higher income are also more actively involved in party politics (e.g., Whitely and Seyd Reference Whitely and Seyd1996).
These types of involvement are important, in part to voice preferences to the political elite, in part to place issues on the political agenda. One important way through which legislators get their information about citizen preferences and the issues that they find important is through contacting (Butler and Dynes Reference Butler and Dynes2016; Fenno Reference Fenno1977); and again, not everyone is equally likely to contact politicians. In a clear illustration of such inequality in involvement, a survey among very wealthy Americans showed that these people are politically active through attending meetings, voting, and discussing politics, but are also very active in terms of contacting various politicians (Page et al. Reference Page, Bartels and Seawright2013). The wealthy Americans tend to have access and be close to public officials, with respondents indicating some form of personal familiarity with members of the political elite.
What is more, while these patterns are often driven by socioeconomic status, they are also reinforced through parental socialization. For instance, research has shown that political interest in part depends on parental socialization (Neundorf et al. Reference Neundorf, Smets and García-Albacete2013) and that conversations about politics in the family directly affect the frequency of participation of the children (Cornejo et al. Reference Cornejo, Rocha, Castro, Varela, Manzi, González, Jiménez-Moya, Carvacho, Álvarez, Valdenegro, Cheyre and Livingstone2021). Moreover, Schlozman et al. (Reference Schlozman, Verba and Brady2012) show that besides their own level of education and family income, the education of parents and their exposure to politics at home when younger affect the political activity by Americans. This research suggests that persistent socioeconomic inequalities through generations are, to some extent, also accompanied by persistent intergenerational inequalities in political participation.
The overall unequal patterns of participation have raised concerns for the health of democracy (Dalton Reference Dalton2017; Lijphart Reference Lijphart1997; Schlozman et al. Reference Schlozman, Verba and Brady2012; Verba et al. Reference Verba, Nie and Kim1978). It is important to note, however, that gaps in political participation are not equally large in all countries, and there are even places where the pattern is reversed. Kasara and Suryanarayan (Reference Kasara and Suryanarayan2015) show, for example, that the rich tend to turn out more than the poor in countries where redistribution preferences of the rich and poor diverge more, and where the state has the capacity to tax the rich. In a way, this implies that when the rich do not see a credible threat to their wealth, they also tend to participate less. Moreover, Amat and Beramendi (Reference Amat and Beramendi2020) show that the poor tend to turn out to vote at higher rates when inequality is high and capacity is low. In these cases, parties see a benefit and an easy opportunity to mobilize poorer voters, conditioning “the political voice of the poor as opposed to excluding them altogether” (p. 860). Gallego (Reference Gallego2015) further highlights that the gap in voting based on education varies considerably between countries, to the extent that some countries do not experience an educational bias or that the bias is reversed. She demonstrates that institutional structures affect inequality in voting, including electoral procedures, party systems, and unionization. This literature emphasizes that unequal participation among citizens can be remedied (or worsened) by how politics and participation are structured institutionally.
Figure 9.1 displays average levels of voting across the twenty-nine European countries in the ESS (2018) and Figure 9.2 provides this information for alternative forms of participation. They show that overall, there are substantial participation gaps between the rich and poor, and between the more and less educated. This is true for all forms of participation, sometimes with differences of around 20 percent on average. This is especially the case for forms that are overall less used, such as signing a petition. Figures 9.1 and 9.2 further highlight that gaps in participation tend to be larger between the more and less educated, than between the rich and poor, emphasizing the importance of the role of education in politics (Bovens and Wille Reference Bovens and Wille2017).
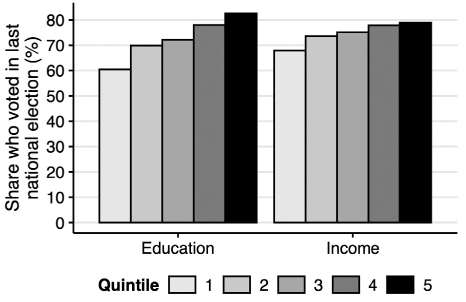
Figure 9.1 Voting, by education and income
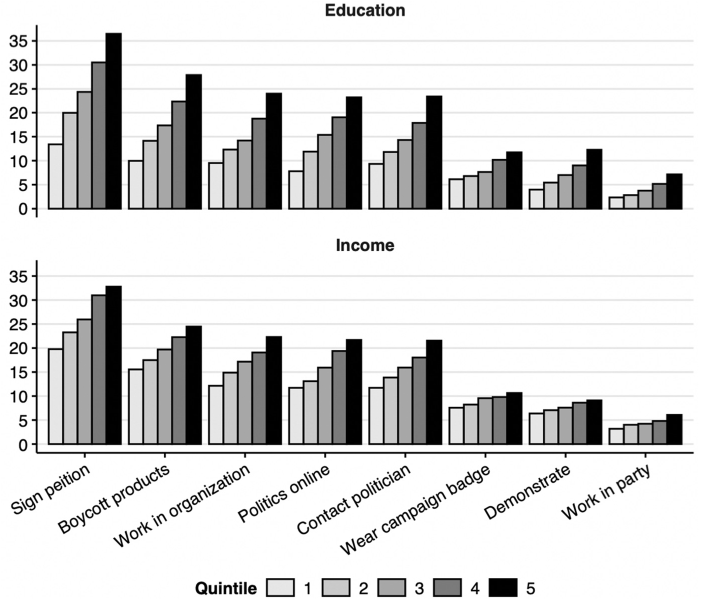
Figure 9.2 Alternative forms of political participation, by education and income
How Unequal Participation Can Translate to Unequal Representation Political participation can affect political representation through (1) the selection of parties and candidates into office, (2) the communication of preferences, and (3) the representatives’ strategic behavior in response to known participation patterns (see also Griffin and Newman Reference Griffin and Newman2005). First, citizens effectively select political parties and candidates who will make up the legislature and government through elections. To the extent that preferences in part depend on citizens’ wealth and educational background, this implies that nonvoters’ preferences are underrepresented in the legislative and executive bodies. With the larger absence of poorer and less-educated citizens, the pivotal median voter is richer and more educated than the median citizen contributing to representational biases (Larcinese Reference Larcinese2007). This may hold in terms of both policy and ideological considerations, as well as the specific candidates that are elected. Since people tend to appreciate candidates that are similar to them in certain relevant personal characteristics (Arnesen and Peters Reference Arnesen and Peters2018), one may expect that a bias in who votes also translates to who is elected to office. Furthermore, how people vote when they do vote may contribute to representational inequality. Some scholars have, for example, shown that some citizens tend to vote “incorrectly”, that is, not in the way that their preferences or interests would suggest they would vote (e.g., Ha and Lau Reference Ha and Lau2015). Predictions in the vote choice are less accurate for people with less education and less political interest. Moreover, Bartels (Reference Bartels2008) finds that the vote choice of the less wealthy is in part dependent on how much the wealthy improved their economic situation in an election year – not on their own economic situation. While there may be valid explanations for the deviations in expected vote choice, this research suggests some people may be more fortunate in the results of the elections than others in terms of preference reflection.
Second, various forms of political participation serve to communicate preferences to the political elite. In order for legislators to represent accurately, they require more or less accurate perceptions of public opinion (Miller and Stokes Reference Miller and Stokes1963). Research has found that representatives tend to align more with constituent opinion when they have more accurate information about it (Butler and Nickerson Reference Butler and Nickerson2011). Yet, some research has shown that legislators are indeed not always very accurate in knowing what citizens want (e.g., Belchior Reference Belchior2014; Hedlund and Friesema Reference Hedlund and Friesema1972). United States legislators, for example, appear to have a systematic conservative bias in their perception constituents’ preferences, which can be attributed to a bias in who contacts (Broockman and Skovron Reference Broockman and Skovron2018). A systematic bias in who participates politically would then also translate into a bias in the information that politicians have about their constituents and may consequently lead to a bias in representation. Communication of preferences, here, can include various forms of participation, and especially contacting and involvement in parties may be important in this respect.
Third, participation may matter through the strategic considerations of political candidates. If candidates are motivated by (re-)election, they would primarily be motivated to please people who may help them to get elected. On the one hand, this may be citizens with larger voting power, that is, groups that are (a) more likely to vote, (b) are less decided on who to vote, and (c) larger groups (Griffin and Newman Reference Newman2013). This suggests that the persistent inequalities in voting form, in part, the basis for decisions on who politicians aim to represent. On the other hand, politicians may be motivated to cater to the preferences of those who make political donations and/or campaign contributions, something that candidates need in some election contexts. Indeed, joining campaign work and/or donating money is often undertaken with the motivation to increase one’s impact beyond one’s own vote (Schlozman et al. Reference Schlozman, Verba and Brady2012: 239).
Some research has attempted to connect unequal participation to unequal representation, often suggesting that participation may have some effect, but that it is not the main driver of differential representation. Some scholars find that voters are better represented (Griffin and Newman Reference Griffin and Newman2005) and that turnout levels affect the representation gap between the rich and the poor (Larcinese Reference Larcinese2007; Martin and Claibourn Reference Martin and Claibourn2013; Peters and Ensink Reference Peters and Ensink2015), although it does not seem to be the main explanatory factor (Bartels Reference Bartels2008; Lupu and Warner Reference Lupu and Warner2022b). At the same time, Leighley and Oser (Reference Leighley and Oser2018) show that roll-call votes correspond better to the preferences of the politically active, and Adams and Ezrow (Reference Adams and Ezrow2009) show that parties in Europe respond better to the preferences of those who are politically engaged. Bartels (Reference Bartels2008) finds some evidence that contacting reduces the inequality gap. Aligning with some of the arguments regarding the role of money in politics, Barber (Reference Barber2016) finds that US senators are in general not very congruent to their constituents, though they do tend to respond to the preferences of the average financial contributor.
In addition to the potential mechanisms through which participation affects representation, the context of political supply may further affect this relation. On the one hand, there is the pool of candidates that run for office, effectively defining who can be elected by voters. Carnes and Lupu (this volume) show that workers are strikingly underrepresented both in the pool of candidates and among the elected legislators in many European countries. Indeed, looking at the composition of several European parliaments, Best (Reference Best2007) also shows that few representatives have a background in the primary sector and most have a university degree. Carnes (Reference Carnes2013) shows that in the United States, such gaps also exist: citizens are much more likely to have a working-class background, be without a college degree, or own less than a million dollars, than the political elite. The notion that not all citizens are likely to become part of the political elite is perhaps further supported by the change that political parties have experienced. European-focused research has indicated that parties are increasingly outside of civil society, the political elite has specialized and professionalized, and are more focused on output legitimacy (Mair Reference Mair2013). This suggests that the political elite has become a sphere on its own, without too strong ties to the citizenry in general terms. This type of bias, however, does not seem to be driven by specific citizen preferences for these higher socioeconomic candidates (Carnes and Lupu Reference Carnes and Lupu2016a; Griffin et al. Reference Griffin, Newman and Buhr2019), nor do working class citizens have less of a nascent political ambition (Carnes and Lupu Reference Carnes and Lupu2023). It appears that citizens are presented with a choice at the outset that limits the possibility to approach descriptive representation of poorer and less-educated citizens; something that may facilitate equal representation (e.g., Bratton and Ray Reference Bratton and Ray2002; Carnes Reference Carnes2012; Hakhverdian Reference Hakhverdian2015).
On the other hand, research has shown that the political offer in terms of policies and ideology is biased toward higher socioeconomic citizens. Rosset and Kurella (Reference Rosset and Spohie Kurella2021) show that preferences of the poor are less well reflected in the political offer that parties present. They show that parties cover different combinations of preferences for the middle incomes best, while both the rich and poor need to make a trade-off. In addition, they find that poorer voters take policy less in consideration, so that they do not make up their disadvantage in offer in the way that the rich tend to do. Furthermore, Weber (Reference Weber2020) discovers that party platforms cater mostly to male, educated, and affluent citizens while attempting to appear agreeable to others. This shows again that already before electoral choices are made, the political landscape favors citizens with a higher socioeconomic background.
At the same time, this political supply issue does not exist exogenously from citizens’ participation. Through their participation, citizens can affect who runs for office and what issues parties put on the agenda. But they also affect who gets elected, that is, even though the pool of candidates is in part given to voters, they select who represents them. Seeing how this may be affecting the composition of the parliament in that there is an overrepresentation of affluent and more-educated legislators (Carnes and Lupu; Curto-Grau and Gallego, both in this volume), it implies that descriptive representation and political participation would have both complementary and interactive effects on unequal representation.
The Endogeneity Problem: Is Participation Unequal Because Representation Is Unequal?
Can we conclude from the earlier discussion that policy outcomes are biased toward the preferences of the affluent and educated partially because they participate more in politics? Not necessarily. While we have discussed several reasons why one would expect unequal participation to translate into unequal representation, the causal arrow might very well go in the other direction. Figure 9.3 demonstrates this point. As we can see, the top three mechanisms in the figure imply that it is participation that influences representation (as we discussed earlier), while the bottom two imply that the causal relationship is the other way around. That is, participation could be unequal precisely because representation is unequal. If elected officials systematically favor the preferences of some citizens over others, one would expect this to have consequences for how citizens perceive the political system. Specifically, citizens who rarely see their preferences enacted in policy might feel that the system is rigged against them, that elected officials ignore their needs, and mainly attend to the interests of the privileged. Therefore, they might see little hope for changing the system through traditional forms of political participation. Conversely, citizens whose views are well represented might feel that the system is working as it should and view participation as effective and meaningful. Hence, the presence of unequal representation could produce unequal efficacy among the public.
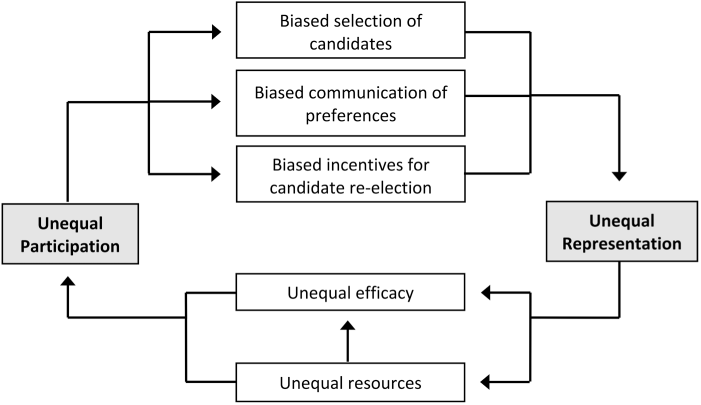
Figure 9.3 Possible mechanisms explaining the association between unequal participation and unequal representation
Notes: The top three mechanisms imply that it is participation that influences representation, while the bottom two imply that the causal relationship is the other way around: representation affects participation. In our empirical analysis, we estimate how much of the relationship that can maximally be attributed to unequal efficacy. That is, how much unequal participation would change under perfectly equal efficacy.
Unequal representation might produce unequal efficacy both directly – as described earlier – but also indirectly. Indirectly, when the voices of the well-to-do dominate the policymaking process, this is likely to produce policies that exacerbate existing inequalities in access to resources. The policy outcomes resulting from unequal representation might thus have important feedback effects on politics (Pierson Reference Pierson1993). Specifically, it might discourage certain strata from participating politically (Brady et al. Reference Brady, Verba and Lehmann Schlozman1995). As argued by Solt (Reference Solt2008: 58), when economic inequality increases, the nonrich are more likely to conclude that “politics is simply not a game worth playing” because the resources needed to play the game are so unevenly distributed.
In sum, we are left with an endogeneity problem (see Anderson and Beramendi Reference Anderson, Beramendi, Christopher and Beramendi2008), that is, does the lower participation rate of poor and less-educated citizens lead to unequal representation; or does unequal representation lead to lower participation rates among those these groups? Realistically, the causal arrow probably goes in both directions – so one could imagine a vicious cycle by which unequal participation creates unequal responsiveness, which in turn exacerbates future inequality in participation. Yet it matters whether the relationship is mainly driven by participation or representation. If participation is the driving factor, then equalizing political participation might produce more egalitarian representation. On the other hand, if unequal political participation is merely a consequence of unequal representation, then equalizing participation should not be expected to have any effect on representational inequality.
Tackling this question empirically is challenging. For example, trying to isolate the causal effect of unequal representation on participation is hampered by factors including a lack of comparable cross-country measures of unequal representation and the rarity of exogenously induced changes. However, under the key assumption that unequal representation, to the degree that it leads to unequal participation, would mainly do so through citizens’ subjective perceptions of the system (i.e., through unequal efficacy in Figure 9.3), we can estimate the effect. Specifically, we then estimate to what extent differential perceptions of the system account for gaps in participation across income and educational groups. We believe the assumption to be highly plausible. Of course, it cannot be ruled out that unequal representation could discourage the low educated and poor from participating without them knowing about it: Unequal representation might produce unequal access to resources, which might influence participation independently of citizens’ beliefs.Footnote 1 That is, worse access to resources could hamper the participation of certain strata, even if they believe the government is actually listening to them. It seems more likely, however, that if unequal representation produces unequal access to resources, then this would adversely affect citizens’ feelings of political efficacy and consequently reduce participation. That such an effect must mainly run through citizens’ subjective perceptions is tacitly assumed by Rennwald and Pontusson (Reference Rennwald and Pontusson2021) when they argue that “growing class bias in responsiveness can hardly be invoked to explain growing working-class support for populist parties” if “citizens have failed to register this development in their perceptions of political representation” (p. 21).
In order to examine to what extent gaps in participation across income and education can be accounted for by different beliefs about how the system works, we employ Oaxaca-Blinder Decomposition. Oaxaca-Blinder Decomposition (Blinder Reference Blinder1973; Oaxaca Reference Oaxaca1973) has become a standard method in economics for estimating how much of a wage gap (typically between males and females) is attributable to a set of predictors (typically occupation, working hours, and experience). However, the method can be used to explain any average difference in a numeric variable between two groups. The method has so far seen limited use in political science (for exceptions, see e.g., Dow Reference Dow2009; Kostelka et al. Reference Kostelka, Blais and Gidengil2019). We here use what is known as a “twofold” decomposition, which will decompose a difference in participation between two groups into the share that is attributable to group differences in a set of predictors, and the remaining, which is unexplained. The explained share is determined by counterfactually imputing the predictor levels of one group onto the other and then predicting with a regression model the level of participation under this scenario. The difference between this prediction and the actual observed level of participation is what is attributable to group differences on the predictors. Standard errors for the estimates are calculated (Jann Reference Jann2008).
Our data source is the European Social Survey Round 9 for twenty-nine European countries. This survey is well suited for our purposes since it contains multiple measures of both concepts in which we are interested: political participation and perceptions of the political system. Our decomposition model includes three types of predictors from the ESS: nine predictors tap into satisfaction with the political system, four predictors measure internal efficacy (i.e., personal abilities, confidence, etc.), and four predictors are sociodemographic variables about the respondent. Most of our predictors are measured on Likert scales from strongly agree to strongly disagree, which we treat as numeric variables in the analysis.
Results
We begin by examining the relationship between beliefs about how the political system works and propensity to participate. If it is indeed the poor and less-educated citizens’ lower satisfaction with the political system that drives their lower rates of participation, then satisfaction with the system needs to be positively associated with participation in the first place.Footnote 2 We use nine variables from the ESS to measure satisfaction with the political system: Agreement that the system allows people “like you” to have (1) influence and (2) say, (3) that everyone can participate, (4) that government considers the interests of all citizens, (5) satisfaction with the country’s democracy, (6) that the respondent feels closer to any of the parties, and lastly, trust in (7) politicians, (8) parties, and (9) parliament (see Table 9.A1 in the Appendix). To test in a simple manner whether these perceptions are related to participation, we made an index by linearly transforming the variables to the same scale and then averaging them for each respondent. We then assigned the respondents into quintiles based on the index distribution in their respective countries.Footnote 3 When it comes to voting, there are clear differences between the people who think the system is working properly and the ones who do not. People in the bottom quintile of the index are 65 percent likely to vote, while this number is 82 percent for the people at the top quintile, and 76 percent for the middle quintile. Furthermore, Figure 9.4 shows the estimated share of respondents who engage in different alternative forms of participation for different quintiles on the satisfaction with the system index. The results show that respondents who are more optimistic about the system are more likely to participate. This is especially the case for respondents who are in the top quintile on the index for their country. Differences are particularly large when it comes to working in organizations and parties or contacting politicians.
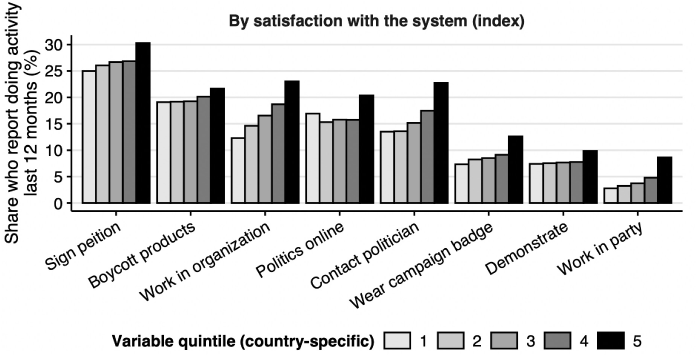
Figure 9.4 Participation by satisfaction with the system
Notes: Index averaging the nine measures of satisfaction with the system. Quintiles are based on each country’s respective distribution. See Table 9.1.
Next, Table 9.1 presents results from the Oaxaca-Blinder Decomposition for voting. Starting from the top of the table, it shows the average gap in voting between the top and bottom education quintile (18.3 percentage points) and between the top and bottom income quintile (10.7 percentage points). Furthermore, the results show that all the predictors we have included in the model (listed in italics) together explain 18 percent of the educational gap and 40 percent of the income gap. Simply put, this means that if the low educated and high educated had had the same values on all the predictors, the difference in voting would be reduced by 18 percent (from 18.3 pp to 14.9 pp; the income gap would go from 10.7 pp to 6.5 pp).
Table 9.1 Oaxaca–Blinder decomposition of the voting gap between high income/highly educated and low income/low educated
| Education | Income | |||
|---|---|---|---|---|
| Contribution (Std. Err.) | % of gap | Contribution (Std. Err.) | % of gap | |
| Overall | ||||
| Gap in voting between bottom and top quintile | 18.29 | 100.0 | 10.67 | 100.0 |
| Total explained | 3.35 (1.21) | 18.3 | 4.22 (0.08) | 39.5 |
| By variable | ||||
| Satisfaction with the system | 0.86 (0.19) | 4.7 | 1.03 (0.35) | 9.7 |
| System allows people like you to have influence | –0.03 (0.08) | –0.2 | 0.00 (0.09) | 0.0 |
| System ensures everyone can participate | 0.45 (0.05) | 2.5 | 0.43 (0.26) | 4.1 |
| Government considers interests of all citizens | –0.05 (0.05) | –0.3 | –0.28 (0.07) | –2.6 |
| Satisfied with working of democracy in country | –0.02 (0.01) | –0.1 | 0.10 (0.02) | 0.9 |
| Feel closer to any of the parties | 1.28 (0.07) | 7.0 | 0.74 (0.14) | 6.9 |
| Trust in politicians | –0.37 (0.25) | –2.0 | –0.15 (0.20) | –1.4 |
| Trust in parties | 0.01 (0.16) | 0.0 | 0.09 (0.15) | 0.9 |
| Trust in parliament | 0.50 (0.30) | 2.7 | 0.23 (0.02) | 2.1 |
| Sum | 14.3 | 20.6 | ||
| Internal efficacy | ||||
| Able to take active role in political group | 0.16 (0.17) | 0.9 | 0.52 (0.13) | 4.9 |
| Confident in own ability to participate in politics | 0.37 (0.31) | 2.0 | –0.01 (0.02) | –0.1 |
| Interest in politics | 3.06 (0.21) | 16.7 | 1.76 (0.12) | 16.5 |
| News consumption | –0.01 (0.01) | –0.0 | 0.06 (0.08) | 0.6 |
| Sum | 19.6 | 21.9 | ||
| Sociodemographic | ||||
| Income (education) quintile | 2.18 (0.43) | 11.9 | 4.85 (0.10) | 45.5 |
| Age | –4.75 (0.04) | –26.0 | –5.97 (0.02) | –56.0 |
| Gender | 0.03 (0.01) | 0.1 | –0.50 (0.15) | –4.7 |
| Born abroad | –0.31 (0.12) | –1.7 | 1.31 (0.05) | 12.3 |
| Sum | –15.7 | –2.9 | ||
Note: Percentages are interpreted as the expected share of the voting gap that would disappear if the bottom education/income quintile had the same levels on a given explanatory variable as the top quintile (or visa-versa, both scenarios weighted equally). Negative values suggest that the gap would be even larger if the two groups had the same levels.
If we look at the first block of predictors – those measuring satisfaction with the system – we see that they together account for 14 percent of the educational gap and 21 percent of the income gap. Among the survey items in this group, it is, The system allows people like you to have influence and Feel closer to any of the parties that explain the most on their own. Still, in the counterfactual world where citizens with very different levels of income and education have the exact same beliefs on all these nine opinion variables, at least 80 percent of the gap in voting would remain.
For comparison, we also included a set of predictors measuring a respondent’s internal efficacy, that is, one’s ideas on own political abilities and interests. These variables explain a little more of the voting gap than the previous block (20 percent for education; 22 percent for income). If we look closer, however, it is clear that within this block, one survey item – Interest in politics – does almost all the work (17 percent for both income and education).Footnote 4
Further, to separate the explanatory power of sociodemographic variables that are correlated with the first two blocks of opinion variables, we include a set of socio-demographic variables in the model. These are presented in the third block. They show, unsurprisingly, that equalizing income would reduce some of the educational gap in voting, and vice versa.Footnote 5
In the next step, we used the Oaxaca-Blinder method to decompose income and educational gaps in the alternative forms of participation. The results of this are summarized in Figure 9.5, which plots for each form of participation the percentage of the gaps explained by differential satisfaction with the system (i.e., the sum of the first block of predictors in Table 9.1). Two of the activities – working in organizations and wearing a campaign badge – would see the income/education gaps reduced about as much as voting (15–20 percent) if satisfaction with the system were equalized. The other six activities, however, would see less of a reduction or almost none. Inequalities in terms of who contacts politicians, works in parties, and signs petitions would be almost unchanged.
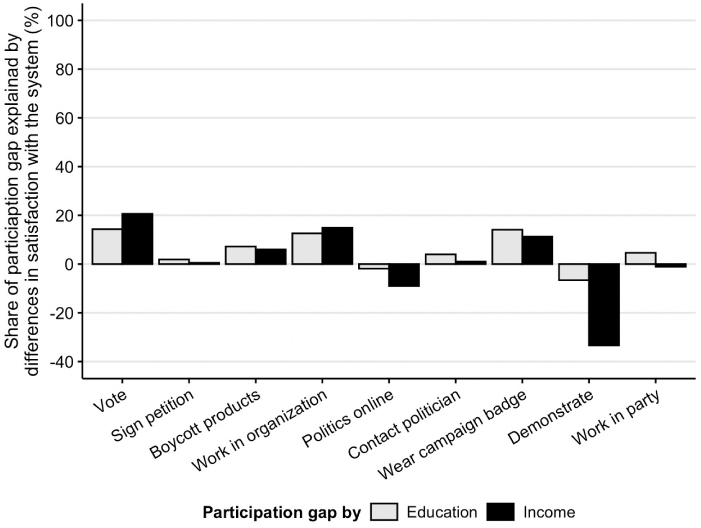
Figure 9.5 The power of differential satisfaction with the system in explaining differences in participation across income and education
Note: Estimated with Oaxaca-Blinder Decomposition using the same model as presented in Table 9.1 for different forms of participation.
In the last part of the analysis, we look at variation across countries in terms of how participation gaps would change if people at high/low income and education had the same satisfaction with the system. We do this for voting since it showed some of the largest reductions among the different forms of participation. Furthermore, since the Oaxaca-Blinder models are computationally demanding, we employ a simpler way of estimating the effect of equalizing beliefs about the system. Specifically, we estimate an OLS model for each country where the dependent variable is a vote dummy, and the main independent variable is a dummy for whether the respondent is in the first or fifth education quintile (only respondents in one of the two groups are included in the analysis). We also include the set of sociodemographic variables from the third block in Table 9.1. From there, we compare the coefficient for the education dummy with the same coefficient after we add the nine variables measuring satisfaction with the political system to the model. The difference represents the amount that the voting gap between the first and fifth education quintiles is reduced when holding constant these nine variables. We then do the same for income.
Figure 9.6 shows the results of this analysis. As one would expect, most of the countries follow the general pattern of little difference before and after taking satisfaction with the system into account. This goes for countries such as France, Germany, Sweden, and the Netherlands. On the other hand, in some of the Eastern European countries, such as Bulgaria, Lithuania, and Latvia, differential beliefs about the system explain more of the voting gaps than in most other countries. However, in none of the countries that have substantial voting gaps in the first place (e.g., above 5 pp), would the gap reduce by more than half if satisfaction with the system had been equal for income and educational groups?
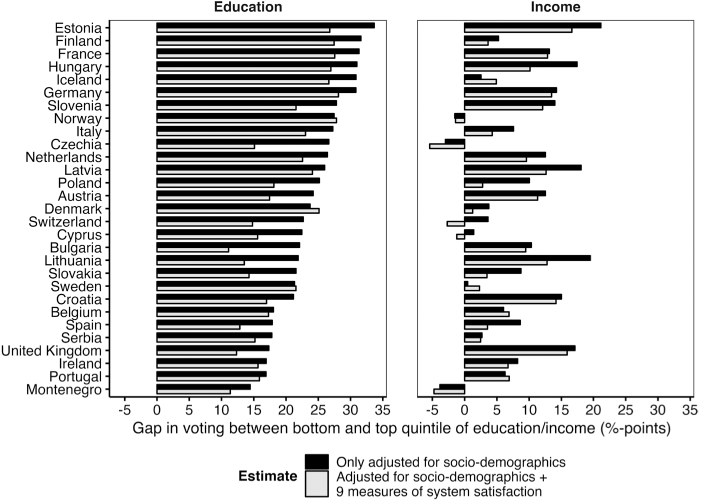
Figure 9.6 Country variation in the voting gap by income and education
Discussion
Over the past two decades, research has shown that representation of political preferences in established democracies tends to favor the richer and more-educated citizens. Since these findings present a severe challenge to the democratic idea of political equality, scholars have sought to find the various causes for the gaps in representation. One of the main explanations that has been discussed, even before the actual representational inequalities were demonstrated, is unequal participation. There tend to be structural inequalities that make it more or less likely for citizens to participate, mainly centering around the idea that individuals are facilitated in their political engagement through their resources (i.e., time, money, and skills). Consequently, those who participate more determine election outcomes, communicate their preferences, and are strategically better catered to by politicians who seek reelection. Indeed, while this area needs more research, there are some studies that have found a link between unequal participation and representation – even if it may not be the main explanatory factor.
However, because there are good arguments for the idea that people decide not to participate because they do not experience representation (while they may observe it for others), we are presented with an endogeneity problem. In this chapter, we sought to address this problem, at least in part, by examining whether participation gaps would narrow if the rich and poor, and more and less educated, would view the political system as equally well functioning. We find, in overall terms, that these participation gaps would likely be reduced in such a scenario – but only in limited ways.
Although there seems to be some support in the data for the argument that the poor and low educated participate less because they feel the system is not working properly, such perceptions account for a rather small part of the gaps in political participation across income and educational groups (15–20 percent for voting; less for other forms of participation). And in fact, if anything, we are probably overestimating rather than underestimating the effects. The reason for this is that the results from the Oaxaca-Blinder models assume that all of the relationship between satisfaction with the system and participation is causal. To the degree this is not the case (and the relationship is, for instance, explained by people viewing the system more favorably as a result of participating), the gap would see an even smaller change as a result of equalizing beliefs about the system. Moreover, it is not certain that having perfectly equal political representation at the system level would in fact equalize beliefs about the system. The poor and low educated could distrust the system for other reasons than unequal representation. Therefore, we should be careful when inferring from our analysis a specific amount by which unequal participation would be reduced if the political system was perfectly equally representative. Given the ways in which we are likely to overestimate that quantity here, a gap reduction on the order of 15 to 20 percent should be viewed as an upper bound.
While the reduction in the gap does not appear that large, it needs to be noted, however, that even such smaller effects may be consequential. We mentioned that the relationship between representation and participation is likely to go in both directions, at least to some extent. This means that if unequal participation exists, it may lead to (more) unequal representation. This in turn would affect gaps in participation somewhat, which then again translates into increased representational inequality. So, even if the effect of unequal representation on participation is minimal, we may be observing a part of the vicious cycle we highlighted earlier. Importantly, this cycle may reach a (an unspecified) threshold level, with potentially severe consequences for democracy. On the one hand, we could conclude that certain systems are in fact no democracies at all, but rather oligarchies (or plutocracies). On the other hand, however, we may in the future observe a strong, potentially revolutionary reaction among citizens who do not accept to be underrepresented while being told they are. Such processes have uncertain outcomes and may lead to even worse situations.
Finally, while most studies have found unequal representation of richer citizens, we see that, especially, education is a dividing factor regarding participation. And indeed, some research has already suggested that, at least in some contexts, the educational representational gaps are more important than the ones based on income (Mathisen Reference Matthews and Kerevel2022; Schakel Reference Schakel2021). Other research has also highlighted the importance of educational divides in politics (e.g., Bovens and Wille Reference Bovens and Wille2017; Gallego Reference Gallego2010), and it suggests that cleavages may have shifted within society. It also suggests that research should perhaps focus more deeply on the relation between education and politics, paying also special attention to potential country difference.


 Open access