

Safety and health policies are adopted to reduce harm to potential victims from accidents and other harmful events. However, such policies can induce offsetting behavior (Miljkovic, Nganje, and Onyango Reference Miljkovic, Nganje and Onyango2009) in which potential victims respond to the policies by relaxing their guard and increasing their exposure to the risk. As a result, the net benefits of food safety policies viewed in terms of reduction of food-borne illnesses can be much smaller than their predicted effects because of failure to account for such behavior. Economists have theoretically (Peltzman Reference Peltzman1975, Hause Reference Hause2006, Pope and Tollison Reference Pope and Tollison2010, Potter Reference Potter2011) and empirically (Crandall and Graham Reference Crandall and Graham1984, Yun Reference Yun2002, Peltzman Reference Peltzman2011) recognized that the direct effect of a policy aimed at mitigating harm can be attenuated and even reversed when safety policies induce consumers to alter their attitudes toward a risk and their behavior. An example of offsetting behavior is the increase in rates of head injuries from bicycle accidents by 10 percent between 1990 and 2000 (Barnes Reference Barnes2001) despite much wider use of helmets. Some safety analysts think that this occurred, at least in part, because victims began to engage in behavior that was more risky (Hause Reference Hause2006).
In other words, risk-reducing policies may affect people's risk preferences and, more specifically, cause them to be less risk-averse. Figure 1 presents the potential relationship between perceptions of risk, the actual degree of hazard, information, and demand for the risky commodity that can lead to this phenomenon. In communication theory, the gap between a person's perception of a risk and the actual degree of hazard can be represented by outrage (Sandman Reference Sandman1987), which, being largely a product of fear of the unknown, is driven primarily by information and can significantly affect demand. Initially, lack of accurate information about food safety or an outbreak will move perceived risk from the baseline risk perception (α). Positive information via creation of mandatory food safety regulations can subsequently modify consumers’ risk perceptions, bringing them gradually back to the baseline level (Lui et al. Reference Lui, Huang and Brown1998). Positive information also can provide consumers with a choice regarding whether to demand food that presents a relatively high risk, such as burgers served rare. In Figure 1, when positive information is held constant, the magnitude of the benefit of a mandatory regulation (its ability to reduce consumption of unsafe foods) is CD. The combination of outrage and positive information creates a new equilibrium at E rather than D. Circumstances in which the risk associated with E is greater than that of C represent dominant offsetting behavior.

Figure 1. Interaction between Perceived Risk, Hazard, Positive Information, and Demand
We hypothesize that the shift in risk-aversion related to offsetting behavior may be especially strong when information is imperfect, as is the case for processes such as the U.S. Department of Agriculture's (USDA's) mandatory pathogen-reduction, hazard analysis, and critical control point (PR/HACCP) system. The HACCP regulation requires meat processing plants to conduct hazard analyses to identify potential food safety hazards and to then implement plans for monitoring and controlling the hazards. Imperfect information also can result from consumers’ lack of awareness that other segments of the supply chain (farms and retail stores) are not required to implement PR/HACCPs. Again, these conditions affect the magnitude of E in Figure 1.
Our hypothesis is grounded in several observations. The first is that media reports on outbreaks of food-borne illnesses and recalls affect consumers’ attitudes toward the risk and demand for hazardous products (Piggott and Marsh Reference Piggott and Marsh2004). Other studies have concluded that any such change in behavior can be attributed to “herding behavior”—essentially, following the masses (Miljkovic and Mostad Reference Miljkovic and Mostad2007). However, there is ample evidence that consumers resume their purchases and consumption of food items once the Food and Drug Administration (FDA) announces that the recalls have ended (Adda Reference Adda2007). The magnitudes of such shifts are difficult to measure, but their existence suggests that positive food-safety news can fundamentally alter consumers’ behavior and perceptions of risk. We explore theories by Hause (Reference Hause2006) and Viscusi (Reference Viscusi1989) on offsetting behavior and use data from a large, nationally representative survey to test for the existence of offsetting behavior in response to mandatory PR/HACCPs. A prior experimental study (Miljkovic, Nganje, and Onyango Reference Miljkovic, Nganje and Onyango2009) has already suggested the potential for offsetting behavior, but the study's authors concluded that small sample size and nonrepresentative samples prevented them from generalizing their results.
Specifically, we test two offsetting behavior hypotheses regarding the impacts of food safety policies on perceptions of risk and consumer behavior associated with meat consumption: the impact of negative information and the impact of positive information. For negative information, the null hypothesis is that mean values of preferences for three methods of preparing hamburgers (how well-cooked they are) will not change when subjects are presented with negative information about potentially deadly E. coli O157 sometimes found in undercooked hamburgers. In the second case, the null hypothesis is that subjects who receive the negative information will have the same mean values for perception of risk as subjects who receive both the negative information and additional information regarding positive trends in food safety due to implementation of PR/HACCPs. The sequence from negative to positive information used here to test for offsetting behavior replicates actual events when policies such as PR/HACCP are developed and mandated after repeated/major outbreaks of food-borne illnesses and contamination. Our results provide empirical evidence of changes in consumers’ risk perceptions and consumption behaviors in response to positive but imperfect information from existing regulations like PR/HACCP.
Food Safety Policies and Offsetting Behavior
In 1996, the USDA Food Safety and Inspection Service (FSIS) introduced mandatory PR/HACCPs following repeated discoveries of E. coli and Salmonella in the U.S. food supply in the 1980s and early 1990s. The new regulations required food processing plants to identify critical control points (CCPs) in their production and processing operations. These points are defined as “any step in which hazards can be prevented, eliminated, or reduced to acceptable levels. CCPs are usually practices/procedures that, when not done correctly, are the leading causes of food-borne illness outbreaks. Examples of critical control points include: cooking, cooling, reheating, holding” (University of Rhode Island 2015). PR/HACCPs are mandated only at the processing level with the presence of Salmonella as the performance standard. Farms and retailers can participate voluntarily, and they use E. coli for process verification only. However, when consumers buy, process, or consume meat products, their perceptions of food safety depend extensively on perceived regulation of the entire production process. Consequently, consumers often view PR/HACCPs as more extensive than they actually are, creating imperfect information and mistaken reliance on positive food-safety information from the media and/or federal agencies.
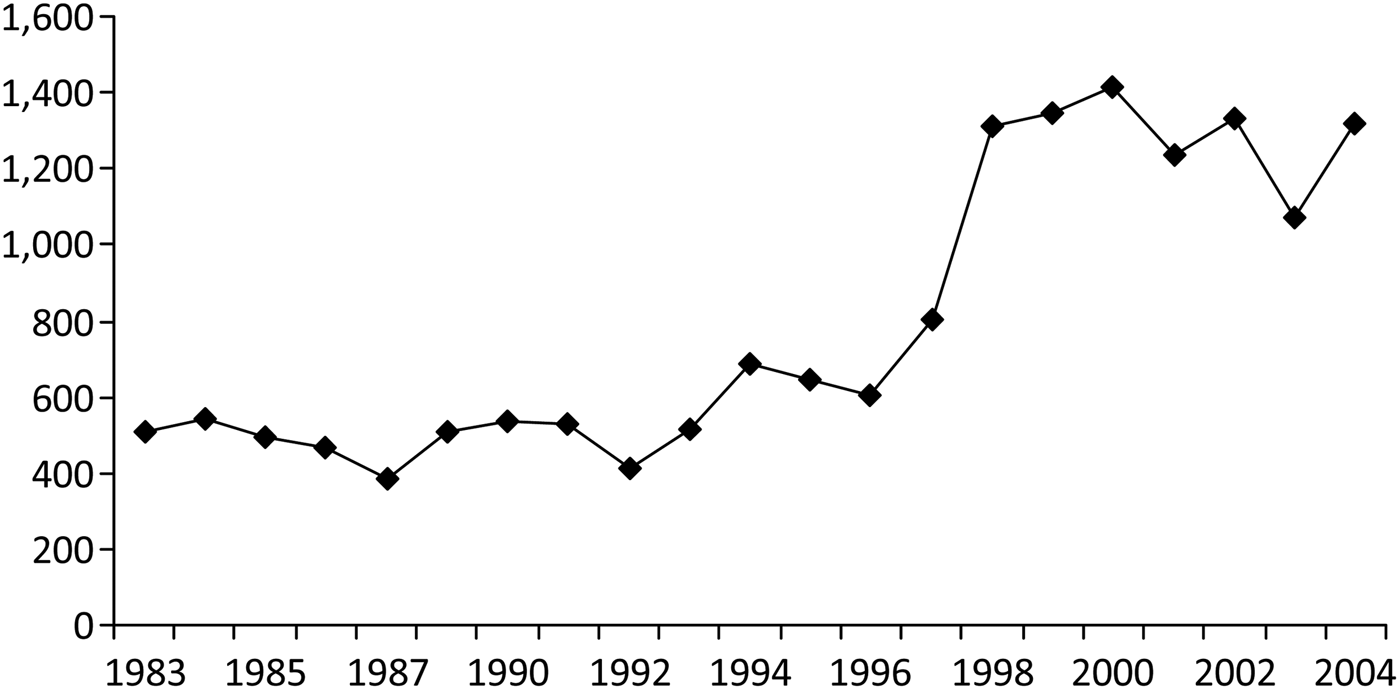
As shown in Figure 2, outbreaks of food-borne illnesses peaked in 2000, a year in which numerous reports of positive information came from the media and some federal agencies about mandatory PR/HACCP implementation for all meat and poultry facilities. Nationwide, the number of outbreaks (single-state and multi-state outbreaks combined) of food-borne illness per year almost tripled following implementation of PR/HACCP. During the same period, the number of meat processing facilities in the United States increased by less than 10 percent (U.S. Census Bureau 2002, 2007). The issue of imperfect information is magnified by the fact that different agencies are responsible for food safety at various points in the supply chain. For example, FSIS regulates most meat and poultry products and some egg products while FDA is responsible for ensuring the safety of all other domestic and imported food products (Johnson Reference Johnson2014).
Figure 2. Number of Outbreaks Nationwide: Food-borne Disease Outbreak Surveillance System
It is important to understand the relevance of offsetting behavior in food safety applications and conditions under which policy changes affect consumers’ risk behaviors. For instance, it is known that ground beef is more likely to contain pathogens such as E. coli than unground cuts such as steaks. Yet beef burgers are among the most popular foods in America. The safest way to prepare ground beef requires heating the beef patty until the center exceeds 160 degrees Fahrenheit (Food Marketing Institute and American Meat Institute 1996).
Given publicity about improved food safety procedures in the last ten to fifteen years, the risk associated with consuming contaminated meat has dropped (Antle Reference Antle2000). Now, the question is whether consumers are overconfident that foods such as beef are completely safe. Are they dropping their guard (offsetting behavior) and decreasing their consumption of well-done meat because the information they receive about improved food safety leads them to assume that the meat is safe and should allow them to consume it rare when that is their preference in terms of taste? Consumers may not be aware that the safety measures apply primarily to the processing stage and that contamination can occur at other points between processing and consumption and will not be eliminated in meat that is not thoroughly cooked.
Theoretical Model
PR/HACCP systems are based on continuous improvement and Salmonella performance standards rather than on command and control standards. Meat processing and packaging firms identify CCPs in their operations to meet the pathogen-reduction standards mandated by the regulation, and USDA monitors the firms’ adherence to the HACCP plan. This structure can lead to transfers of imperfect information and, subsequently, to lax reactions from consumers and retailers.
Policies that involve imperfect information and offsetting behavior can be explained by two competing theories. First, the expected-accident loss framework of Hause (Reference Hause2006) uses a coefficient of diminishing returns that quantitatively measures the marginal offset to the food policy (see appendix 1, which is available from the authors) and can include two measures of offsetting behavior: consumers’ perceptions of risk and behavior toward safe food preparation methods and their consumption decisions. Equation 1 represents the objective function:
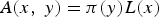
 $$A\lpar {x\comma \; y} \rpar \equiv {\rm \pi} \lpar \, {y\comma \; x} \rpar L\lpar x \rpar .$$
A(x, y) is the cost of illness or death generated by a food-borne illness. The function A is a “bad”—a pernicious event for individuals and society; thus, negative values of A are “goods” that benefit individuals and society. The level of food safety regulation, in our case represented by PR/HACCP implementation expenditures, is x; the monetary equivalent of consumers’ hazard-avoidance behavior is y; the probability of a food-borne illness or death occurring is π(y, x); and the monetary equivalent loss to the victim if illness or death occurs is L(x). L(x) has x as a given to direct our analysis of the effect of offsetting behavior on the public-good aspect of food safety policies (Unnevehr Reference Unnevehr, Otsuka and Kalirajan2007). We assume that π( y, x) and L(x) are nonnegative and are strictly decreasing, smooth convex functions defined on x, y ∈ [0, + ∞). As a result, the first derivatives, A y , Ax, are less than zero such that the function A is decreasing, and A yy , Axx is greater than zero such that the function A is convex. The consumer's best response for all values of x considered is defined as y(x) > 0. It is also assumed that a consumer will choose the optimal hazard-avoidance expenditure value, y, when given x.Footnote 1 In this case, x is represented by expenditures for implementing PR/HACCP, which are reflected in the perception of risk of an average individual. The average individual then selects y given the perception of risk after x has been determined by the food safety policy since L(x) ≥ 0 by assumption.
We specify L as a function of x for two additional reasons. First, L(x) can be viewed as the healthcare cost of treating food-borne illnesses. Second, society demands a minimum level of safety that, if implemented by the government, should keep food poisoning cases that could lead to hospitalizations and deaths below some socially acceptable threshold (Unnevehr Reference Unnevehr, Otsuka and Kalirajan2007).
Once the level of x is decided by mandatory government policy, the consumer has no direct tools to influence the credence dimension of L (i.e., the consumer cannot enforce more stringent regulations on producers). For this reason, the consumer can only avoid L by reducing the probability of getting ill—committing to reduce π(y). Of course, one can argue that consumers have tools by which to influence the level of L, such as buying more health insurance or lobbying policymakers. However, those actions represent hazard-avoidance behavior by consumers and so can be included in the probability π(y) without loss of generality. Our stated-preference experiment is designed to capture this type of behavior by consumers; participants are first presented with information regarding the regulations and then asked to state their preferences regarding three consumption options. The functional-form representation of A(x, y) = π(y)L(x) is a better fit for our empirical study.
The second component in the offsetting behavior model, expressed in equation 2, is the behavioral assumption that a consumer, who is implicitly expected to maximize utility, chooses a level of avoidance expenditure that maximizes the utility of consumption of safe goods, represented as E(C). This is consistent with the fact that food safety can be viewed as an attribute of quality that can be purchased with a limited resource, y. Given standard microeconomic assumptions that consumers have rational, continuous, and locally unsatiated preference relations, the consumer will maximize the utility of consumption of the quality attribute given the budget constraint. In this case, the consumer will choose the level of y that maximizes safety or minimizes cost. Under duality theory, the maximization and minimization problems should yield the same result (Mas-Colell, Whinston, and Green Reference Mas-Colell, Whinston and Green1995). This specification is equivalent to minimizing the sum of the expected value of the food-safety loss and the avoidance expenditure (Hause Reference Hause2006).
 $$\; E\lpar C \rpar = I- \lsqb A\lpar {x\comma \; y} \rpar + y\rsqb$$
where I is total income.
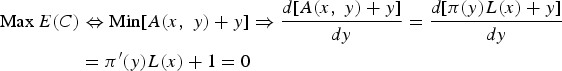 $$\eqalign{{\rm Max}\,E\lpar C \rpar & \Leftrightarrow {\rm Min}\lsqb A\lpar {x\comma \; y} \rpar + y\rsqb \Rightarrow \displaystyle{{d\lsqb A\lpar {x\comma \; y} \rpar + y\rsqb } \over {dy}} = \displaystyle{{d\lsqb {\rm \pi} \lpar y \rpar L\lpar x \rpar + y\rsqb } \over {dy}} \cr & = {\rm \pi} ^{\prime}\lpar y \rpar L\lpar x \rpar + 1 = 0}$$
Equation 3 is differentiated with respect to y and not to x because we assume that the average consumer who makes the tradeoff between reducing food-safety losses (A(x, y)) and purchasing other goods has access to y, not x. From the average consumer's perspective, x is fixed and given. Because we want to find the maximum of E(C), which is equivalent to finding the minimum of [A(x, y) + y], we need to equate the first derivative to zero. By assumption, we know that A(x, y) has a minimum and that y is nonnegative. By implicit differentiation of π′(y)L(x) + 1 = 0, we obtain equation 4:
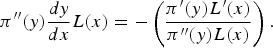 $${\rm \pi ^{\prime \prime}}\lpar y \rpar \displaystyle{{dy} \over {dx}}L\lpar x \rpar = - \left( {\displaystyle{{{\rm \pi ^{\prime}}\lpar y \rpar L^{\prime}\lpar x \rpar } \over {{\rm \pi ^{\prime \prime}}\lpar y \rpar L\lpar x \rpar }}} \right) .$$
Definition 1:
Initially, x is set to be zero (no information has been given to consumers) so that y = y(0) and the expected accident loss is π[y(0)]L(0). After a PR/HACCP system has been adopted and new information consequently reaches consumers, expenditures are x 1 > 0 (such as PR/HACCP implementation and monitoring expenditures).
Proposition 1:
Food-safety policy expenditures (x) induce offsetting behavior by consumers in the model of expected health-hazard loss. That is, consumers’ offsetting behavior occurs if equation 5 holds:
 $$\pi \lsqb \, {y\lpar {x^1} \rpar } \rsqb L\lpar {x^1} \rpar \gt {\rm \pi} \lsqb \, {y\lpar 0 \rpar } \rsqb L\lpar {x^1} \rpar .$$
From Figure 1, this is equivalent to C > E and E > D.
Proof of Proposition 1:
Before providing the proof of proposition 1, the sign of y′ must be clarified.
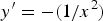
 $$y^{\prime} = - \left( {\displaystyle{{L^{\prime}\lpar x \rpar {\rm \pi ^{\prime}}\lpar y \rpar } \over {L{\rm \pi ^{\prime \prime}}}}} \right) \lt 0,\forall x,y \ge 0$$
because π(y), L(x) is assumed to be nonnegative, to be strictly decreasing (L′(x) < 0, π′(y) < 0), and to have smooth convex functions (L″(x) > 0, π″(y) > 0). If the average consumer perceives, in response to new information about a food safety policy, that the risk of getting sick from a food-borne disease has decreased, that consumer's health-hazard-avoidance expenditure should also decrease. This is a reasonable expectation since y(x) is a decreasing function of x (it has a negative slope, y′ < 0) and is consistent with the fact that an increase in x from zero to x 1 leads to a decrease in y from y(0) to y(x 1), which in turn leads to an increase in the probability of a food-borne hazard occurring (π will increase from π[y(0)] to π[y(x 1)]). These relationships suggest the presence of offsetting behavior in response to food safety policies.
We do not assume the existence of offsetting behavior a priori solely based on the theoretical results. We test for the existence of offsetting behavior using empirical experiments. If we then find evidence that offsetting behavior exists, we estimate its intensity (whether it is partial or dominant).
Definition 2:
Consumers’ offsetting behavior is dominant if it more than completely offsets the decrease in the expected health-hazard loss resulting from the direct effect of the food safety policy. Consumers' offsetting behavior is partial if it does not completely offset the decrease in the expected health-hazard loss resulting from the direct effect of the food safety policy.
Proposition 2:
If an increase in regulation (represented by an increase in expenditure on food safety policies), x, is associated with dominant offsetting behavior, the degree of regulation (x) does not adequately alleviate the expected health-hazard loss to the consumer.
From Figure 1, this is equivalent to E > C.
Proof of Proposition 2:
Dominant offsetting behavior implies that A[x 1, y(x 1)] > A[0, y(0)], and, by definition, a factor of production is inferior if a greater output uses less of the factor. The elements that belong to the range of the function A represent a “bad,” a pernicious event for individuals and society, and that implies that –A, the negative values, are “goods.” If an increase in x induces dominant offsetting behavior, x must be an inferior factor in the production of –A because more of x leads to less of –A. The mathematical derivations of dominant offsetting behavior are presented in appendix 1, which is available from the authors.
Empirical Test for Dominant Offsetting Behavior Related to Food Safety
Brief Description of the Survey Instrument
As previously noted, changes in perceptions of risk in response to information provide a valid approach for testing for offsetting behavior. The economics literature has identified three common categories of risk-perception variables associated with an actual risk or hazard: the locus of control (the extent to which people believe that their actions affect the degree of risk faced), personal health characteristics, and demographic characteristics (Adu-Nyako and Thompson Reference Adu-Nyako and Thompson1999). However, the literatures on psychology and risk communication have identified variables that affect outrage (dread or fear of the unknown) as having larger impacts on links between perceptions of risk and behaviors/ attitudes than variable categories associated with the actual hazard (Slovic Reference Slovic1987, Sandman Reference Sandman1987, Sparks and Shepherd Reference Sparks and Shepherd1994, Miles and Frewer Reference Miles and Frewer1999, Nganje, Kaitibie, and Taban Reference Nganje, Kaitibie and Taban2005). By incorporating information on outrage linking perceived risks and attitudes, we can model offsetting behavior directly using a questionnaire developed to elicit information for all four risk-perception categories.
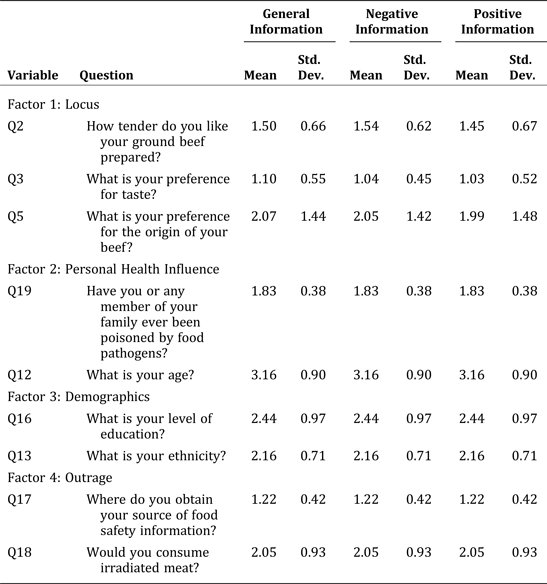
The survey questions used to elicit respondents’ internal and external loci of control, personal health influences, demographic characteristics, and experiences of outrage/dread related to food safety are presented in Table 1. The variable for locus of control represents actions consumers take to relieve their perceived risk of contracting a food-borne illness. There is widespread agreement that trust in risk-management institutions and the locus at which risk is controlled can be vital factors that shape an individual's perception of risk (Wynne Reference Wynne and Conrad1980, Duttweiler Reference Duttweiler1984). Personal health characteristics relate to the individual's experience with food-borne illnesses, presence of any immune system deficiency, and age. The demographic factors included are level of education, annual income, and ethnicity. Outrage/dread relates to uncertainty or fear of the unknown (Sandman Reference Sandman1987) and can be affected by information obtained from various sources, including media coverage (Shimshack, Ward, and Beatty Reference Shimshack, Ward and Beatty2007).
Table 1. Questions Related to Food Safety and Risk Perceptions, Mean Responses, and Standard Deviations
Notes: Qi indicates questions that loaded into the factors. It was interesting to note that this loading was consistent with the literature on perception of risk. We have not reported other variables or questions that did not load into the factors. Overall, nineteen questions were reported three times for the three survey trials: no information, positive information, and negative information.
Sampling and Experimental Design
Our sample consisted of 2,552 respondents (primary household shoppers) in Zoomerang's database.Footnote 2 Zoomerang consumers are a particularly good fit for the analysis because they provide a cohort of frequent, habitual, knowledgeable consumers who frequently receive information on food alerts related to recalls, healthfulness, and policy advances. All of the subjects in the sample indicated that they ate hamburgers at least three times per month on average. In terms of demographics, 69 percent were white, 18 percent were black, 11 percent were Hispanic, 1.85 percent were Asian, and 0.34 percent were Native American. All were eighteen years of age or older.
The experiment used a random and matched-pair sample design. First, Zoomerang randomly selected participants from the database to participate in the study. Then, we used matched-pair sampling to eliminate variation between samples (Billewicz Reference Billewicz1965, Triola Reference Triola2005). A matched-pair design is appropriate for “before and after” comparisons and when the goal is to control samples so that variables other than the one of interest do not affect the results. Furthermore, a matched-pair design provides a more-conclusive test than an independent sample design; the matched-pair design reduces variability among observations due to causes other than the “treatment,” thus reducing sampling error.
The subjects selected were asked to participate in three experiments conducted at two-week intervals that were designed to test the hypothesis that people engage in offsetting behavior in response to information about food safety regulation. The experiments used identical questions about their preferences for preparation of a hamburger and their perceptions of their risk of contracting a food-borne illness. In the first experiment, no specific reference to food safety was made in the survey. In the second experiment, the survey provided negative information about the safety of food. In the third experiment, the survey provided positive information about regulations designed to improve food safety. The positive and negative information statements were obtained from newsletter articles that were verified as a source of objective food safety information.
Positive Information Statement:Through advances in food safety, the FSIS/USDA has mandated and implemented pathogen reduction/hazard analysis for critical control points (PR/HACCP), a more science-based inspection system, in all beef and poultry slaughter and processing installations. According to USDA, HACCP has been very effective since its adoption in 1995 and contributed to very significant reduction in pathogen bacteria in meat processing plants. Based on this assessment, the government officials came to a consensus that the United States has the safest meat processing system and meat supply in the world (AgWeek Magazine 2002).
Negative Information Statement:The government is afraid our love affair with the hamburger will kill us. The U.S. Centers for Disease Control boosted its estimate of E. coli O157 dangers. In 1994, it estimated E. coli O157 to be responsible for 62,000 illnesses per year, 1,800 hospitalizations, and 52 deaths. E. coli O157 also has a nasty habit of causing permanent organ damage among its survivors, for example to your kidneys, liver, or eyesight. Cooking a hamburger until it is dry will almost certainly kill any E. coli O157. However, some people want burgers juicy and pink in the middle and that means danger. Hamburger is a particular problem because a few bacteria ground up into a beef patty can proliferate to dangerous levels given time and poor refrigeration. The same few bacteria on the outside of a steak can't multiply rapidly, and the outside of the steak always gets high heat when it is cooked (Avery Reference Avery2002).
Descriptive Statistics of the Data and Preliminary Test
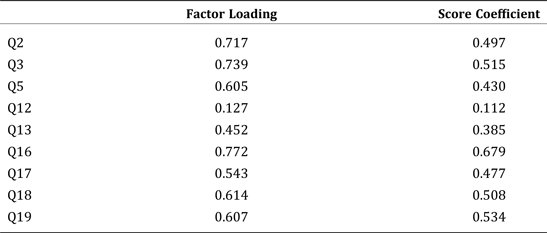
Adhering to the factor analysis procedure described in Brown, Cranfield, and Henson (Reference Brown, Cranfield and Henson2005), we generated a relative index (presented in Table 2) of the consumers’ relative perceptions of their risk of food-borne illness that was a composite measure of the four risk categories (see Table 1). Our approach differs from the one in Brown, Cranfield, and Henson (Reference Brown, Cranfield and Henson2005) in that we created factors or risk indexes representing each category of risk perception. This important distinction ensures that critical variables that influence consumers’ perceptions of risk when given alternative information about food safety are included in the model.
Table 2. Factor Loadings and Score Coefficients for Selected Items
Note: See Table 1 for how these variables loaded into the factors.
The marginal contribution of each factor in conjunction with information relating to food safety policies is estimated with a discrete-choice Tobit model, which is particularly useful when using truncated data, as discussed in Brown, Cranfield, and Henson (Reference Brown, Cranfield and Henson2005) and Greene (Reference Greene2003).Footnote 3 The two measures of offsetting behavior in the survey are consumers’ behavior in terms of safe food-handling and consumption practices and the response to negative and positive information about food safety. To elicit consumer's food safety behavior, participants were asked how they like to have their ground beef cooked and chose from responses of well done, medium, and rare. It was assumed that respondents who perceived ground beef as relatively high-risk would prefer well-done burgers. Participants who felt the risk posed by ground beef was moderate would be more likely to be willing to eat medium-cooked burgers and those who perceived little risk from ground beef would be more likely to be willing to eat rare burgers.
The equations making up the empirical analysis (6 through 10) follow Peltzman's (Reference Peltzman1975) specification. Suppose the cross-section distribution of the hazard or perception of risk (Rp) over time subsequent to PR/HACCP implementation is generated by
 $$Rp_t = a{\bf X}_t + b{\bf I}_t + u_t $$
where X is a matrix of nonregulatory determinants, I is a matrix of variables serving as indices of information related to regulatory effectiveness (positive information in this case), and u is a random variable. It is not sufficient merely to estimate equation 6 using data from positive information on regulation provided in the media and other sources. To disentangle the effect of regulation and assess offsetting behavior, information prior to t (negative or null information) is needed:
 $$Rp_{t-i} = a\,{\grave{}}\, X_{t-i} + b\grave{}\,I_{t-i} + {u\grave{}\,}_{t-i} .$$
Any effect of regulation could change a` and b`. We could impose the constraint a = a` and then see if we must reduce b` to successfully explain the hazard or perception of risk (Rp t). That is, if we assume that Rp t is generated from the same process as Rp t–i and that information from regulation has in fact altered the process, we could be overpredicting the reduction in hazard and perception of risk.
In general, we can define b = b` + B where B is a change induced by regulation. In that case, equation 6 can be written as
 $$Rp_t = aX_t + b\grave{}\,I_t + BI_t + u_t. $$
Imposing the constraint on a, we then can compute the change in consumer behavior or demand for less healthy foods,
 $$BH\lpar x \rpar _t = Rp_t -aX_t -b\grave{}\,I_t\comma \; $$
and then estimate
 $$BH\lpar x \rpar _t = BI_t + u_t. $$
If information from regulation effectively increases offsetting behavior, the estimate of B should be positive. Since Rp t may be affected by I, we introduce interaction terms in the empirical estimation.
The preliminary tests generate some interesting results regarding the effect of offsetting behavior. The mean value of the preparation preference for hamburgers in the three experiments changes from 1.962 for no food safety information to 1.377 for negative information and 1.964 for positive information. The mean value of consumers’ perceptions of risk posed by hamburgers in the three experiments changes from 1.417 for no food safety information to 1.454 for negative information and 1.324 for positive information.
Two hypotheses were tested in the preliminary analysis of the data using ANOVA. In the first, the null hypothesis is that the mean value of the preparation-style preference for hamburgers when negative information regarding the potential impact of the deadly E. coli O157 is presented and the mean value when additional information regarding positive trends in food safety due to implementation of PR/HACCP systems is presented are equal. This null hypothesis was rejected at the 1 percent level of significance. The sequence from negative to positive information used to test for offsetting behavior replicates actual occurrences of outbreaks of food-borne illnesses; PR/HACCP was developed and mandated after repeated major outbreaks.
In the second case, the null hypothesis is that the mean value of consumers’ risk perceptions when presented with negative information and the mean value when presented with additional positive information are equal. This null hypothesis was rejected at the 1 percent level of significance.
The preliminary analysis of the resulting variances suggests that subjects became less cautious regarding the danger of E. coli in response to positive food safety information and that their perceptions were that most of the risk posed by bacteria in ground beef was eliminated by implementation of HACCP. This result is consistent with Onyango et al. (Reference Onyango, Miljkovic, Hallman, Nganje, Coundry and Cuite2008), which showed that consumers tend to trust government (both USDA and CDC) actions and regulations regarding food safety matters. More importantly, this result presents a clear case of offsetting behavior. A food safety policy was enacted to reduce the number of potential victims of E. coli and other pathogens responsible for food poisoning cases. As a result, the subjects reduced their degree of concern about food-borne illnesses in response to the policy expressed, and the role of preparation style for hamburgers decreased while other attributes such as texture and appearance became more important. The preceding in-depth empirical analysis determines whether this offsetting behavior is dominant or partial. In this case, dominant offsetting behavior indicates that the marginal impact of positive information about food safety increases subjects’ preparation-style preferences for hamburgers at least to the level that existed before any information on food safety was provided. It is difficult to determine whether the offsetting behavior is dominant or partial without a marginal benefit analysis.
Tobit Regression Results
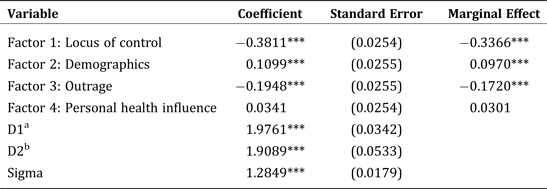
We estimate two regression models to test the hypothesis that dominant offsetting behavior occurs in response to provision of food-safety policy information. The first model (see equation 10) incorporates all four factors and two dummy variables that represent the no-information and negative-information experiments. The resulting coefficients, which are reported in Table 3, are nearly all significant at a 1 percent or 5 percent level; the exception is personal health factors. The coefficients suggest that both of the demographic factors, no provision of food safety information, and provision of negative food safety information all increase the likelihood of a respondent choosing well-cooked burgers.
Table 3. Summary of Tobit Regression Results regarding Offsetting Behavior
a The dummy variable assumes a value of 1 when the observation is from the no-information experiment and assumes a value of 0 otherwise.
b The dummy variable assumes a value of 1 when the observation is from the negative-information experiment and assumes a value of 0 otherwise.
Notes: The dependent variable (measure of offsetting behavior) was formulated from the question “How do you like your ground beef cooked?” The choices for this question were well done, medium, and rare. *** denotes significance at the 1 percent level. Marginal effects for the risk perceptions measures were computed from regression results.
It is possible that consumers’ ethnicities and educational backgrounds promote healthier food habits and provide confidence regarding their knowledge about the food they consume. Negative information about food will tend to make consumers more cautious in their choices and more inclined to consume safer products (i.e., well-done burgers). Note that the locus of control and degree of outrage decrease the likelihood of respondents choosing well-done burgers. When consumers are confident about the sources of their food or have greater information about how the food was handled (e.g., whether it was irradiated), they may tend to be more lax about safe food choices and thus tend to consume hamburgers that are not as thoroughly cooked. The factor approach is consistent with using individual variables (see appendix 2, which is available from the authors) but is more robust.
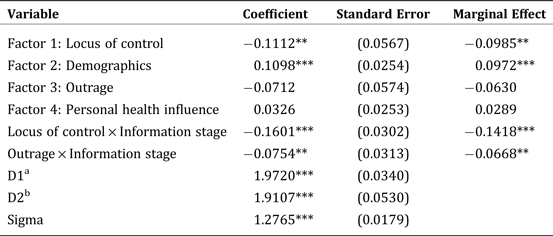
Table 4 presents the results of a further examination of the quadratic interaction term between risk factors over which consumers have direct control (e.g., the locus of control and personal health factors) and food policy information. Although the significance of the resulting coefficients varies slightly, the results are mostly consistent with the results from the analysis of offsetting behavior (Table 3). The coefficients of the two interaction terms are negative and significant at the 1 percent level. When positive information from food policies is provided to consumers, the likelihood that they will prefer well-done burgers decreases significantly, validating the existence of offsetting behavior in response to food safety measures.
Table 4. Regression Results Relating to the Change-in-information Stage
a The dummy variable assumes a value of 1 when the observation is from the no-information experiment and assumes a value of 0 otherwise.
b The dummy variable assumes a value of 1 when the observation is from the negative-information experiment and assumes a value of 0 otherwise.
Notes: Marginal effects for the risk perception measures were computed from regression results. *** denotes significance at the 1 percent level and ** denotes significance at the 5 percent level. The dependent variable (measure of offsetting behavior) was formulated from the question “How do you like your ground beef cooked?” The choices were well done, medium, and rare.
We can approximate the marginal benefit of food-safety policy information using the marginal impact estimation procedure (Greene Reference Greene2003). We find that a marginal increase in positive food-safety information decreases the probability of consuming well-done burgers by 14.18 percent for locus of control and 6.68 percent for personal health factors. Therefore, positive information that affects risk-tolerance indexes directly related to the locus of control and outrage may cause dominant offsetting behavior in response to food safety policies since marginal changes in policy information result in a more-than-proportionate change in risk perception and consumer behavior.
These empirical results are consistent with our theoretical model. By taking offsetting behavior into account when formulating food safety policies such as PR/HACCPs, policy benefits can be more accurately estimated. This is reflected in
 $$\left\{ {\Pi \lsqb\, {y\lpar {x{^\ast}} \rpar } \rsqb L\lpar x \rpar \,/ \,\Pi \lsqb\, {y\lpar 0 \rpar } \rsqb L\lpar 0 \rpar } \right\}.$$
There is evidence that information can shape the outcome of food safety policies. However, if offsetting behavior is ignored, forecasts based only on direct policy effects are represented by equation 11.
 $$\left\{ {\Pi \lsqb \, {y\lpar 0 \rpar } \rsqb L\lpar {x{^\ast}} \rpar\, /\, \Pi \lsqb \, {y\lpar 0 \rpar } \rsqb L\lpar 0 \rpar } \right\} \equiv L\lpar x \rpar \, /\,L\lpar 0 \rpar $$
As shown, the benefit function may be overstated and inefficiencies may result. For example, FSIS projected that the benefit of a 15–20 percent reduction in pathogens by the PR/HACCP system would far outweigh the cost. We have seen such reductions in levels of Salmonella and other targeted pathogens, but food-borne disease outbreaks continue to trend upward.
Conclusions and Suggestions
Hause (Reference Hause2006) suggested that the net effect of a policy is ultimately an empirical question. This study combines theoretical and empirical analyses to extend the literature on offsetting behavior by analyzing the marginal benefit of food safety policies such as PR/HACCP, a particularly interesting case of policies associated with imperfect information. Our experiments focus on how the preparation, handling, and consumption of food change when consumers receive information about food safety with a particular emphasis on positive information regarding the benefit of PR/HACCPs. Changes in behavior are important to assess consumers’ perceptions of a risk effectively. Such risk assessments are developed and used by FSIS, for example, to evaluate intervention strategies aimed at mitigating the risk of food-borne illnesses and to guide, support, and enhance the agency's overall decision-making process, risk-management policies, outreach efforts, data collection initiatives, and research priorities. Our results can be used to enhance risk assessment and management alternatives directed at food preparation and handling.
We chose to analyze a specific policy in a specific industry to illustrate how policies generally can be enhanced. For example, will requiring detailed handling and preparation guidelines on all food labels reduce the incidence of outbreaks? In our view, expensive policies such as PR/HACCP deserve particular attention from policymakers because they can be improved. Our analysis confirms that consumers adopt offsetting behavior in response to the presence of PR/HACCP, which was designed to reduce food safety hazards and protect consumers from the effects of some of the deadly bacteria found in meat in general and in ground beef in particular.
In this study, the food safety information provided to subjects was introduced ex post, that is, after they had adjusted their preferences to account for their knowledge about food safety problems. This sequencing of the experiments is consistent with actual implementation of food safety policies, which are initiated and enforced in response to outbreaks and are later deemed successful when their impacts are measured and found to have resulted in a decreased level of pathogens. In this study, the information provided was true but was also at least partially irrelevant (imperfect) since it was related to food safety measures in meat processing plants rather than in retail stores and restaurants. Contamination can occur at any time between the moment meat leaves the processing facility and final consumption. This behavioral anomaly may partially explain the growing gap between decreases in pathogenic bacteria recorded in meat processing plants and the growing number of outbreaks of food poisoning cases caused by such bacteria.
Food safety policies can be costly. They can have positive economic impacts but can also introduce economic inefficiencies when they are not effectively designed. Though PR/HACCP has been in operation for several years, the number of cases of sickness and death from contamination of meat products has remained substantial. Food safety policies that target consumers can address issues of offsetting behavior and post-purchase handling and thus might lead to greater efficiencies. For example, food safety policies could simultaneously target pathogen reductions and decreased outbreaks rather than focusing solely on pathogen reductions and assuming that outbreaks will follow. Policies like PR/HACCP can be revised to improve their impact and more accurate benefit assessments can be incorporated into regulatory impact analyses to minimize inefficiency.
Additional research is needed to address issues of improved technologies and of disease-tracking. Research that encourages solutions (e.g., policies that can reduce the number of food recalls that occur) rather than problem-oriented studies should be encouraged. From the perspective of the push toward improved HACCP systems, offsetting behavior should be taken into account and issues related to information asymmetry between processors, retailers, and consumers should be addressed. Failure to do so will lead to exaggerations of policy impacts and hence will further mislead consumers, potentially compromising their health. Food safety policies aimed at reducing hazards should address consumers’ awareness of their roles in mitigating such risks.


 Open access