

Sweet cherries have increased in popularity over the past decade because of their reported health benefits for consumers and the relatively high price premiums suppliers can charge (Kahlke et al. Reference Kahlke, Olga, Cooley and Robinson2009). Although Europe has been the main producing center of them for centuries, the United States has become the world's second largest producer, accounting for more than 10 percent of world production in recent years (Economic Research Service (ERS) 2011). The United States is the world's largest exporter of sweet cherries and grows more than 20 percent of the cherries traded (ERS 2011). The level of U.S. domestic production is projected to be nearly 50 percent greater in 2020 than in 2011 (Long Reference Long2013). As shown in Figure 1, U.S. annual per-capita consumption of fresh sweet cherries has increased 150 percent since 1998 with an annual per-capita consumption of 1.31 pounds in 2010 (ERS 2011). The figure also shows the 36 percent decline in consumption of processed sweet cherries over the same period. The retail price of fresh sweet cherries steadily increased between 2009 and 2013, rising from $3.25 per pound to $4.55 per pound after accounting for inflation (ERS 2013). Despite the increase in real prices, consumption of fresh cherries is expected to continue to grow at a steady pace.

Figure 1. Per Capita Consumption of Sweet Cherries in the United States (1973–2011)
Many studies have investigated the value consumers place on fruit-quality traits and the price premiums they are willing to pay for improved traits for various fruits. Gallardo, Kupferman, and Colonna (Reference Gallardo, Kupferman and Colonna2011) employed choice experiments and sensory tests to analyze consumers' willingness to pay (WTP) for quality attributes of Anjou pears. They found that consumers were less willing to pay for firm pears and would pay a premium for pears that had higher soluble solid concentrations (SSCs)—were riper. Shi, Gao, and House (2013) explored consumer preferences for the method of production, origin of production, and form of the fruit (frozen versus fresh) for blueberries. They found that locally produced blueberries were preferred and that less than 50 percent of the participants were willing to pay positive premiums for organic blueberries. Zhang et al. (Reference Zhang, Gallardo, McCluskey and Kupferman2010) conducted a sensory experiment to analyze consumers' WTP for different levels of ethylene applied to Anjou pears. They found that consumers were willing to pay 8.5 cents, 3.7 cents, and 5.7 cents more per pound for an additional unit of firmness, juiciness, and sweetness respectively. Carrillo-Rodriguez et al. (Reference Carrillo-Rodriguez, Gallardo, Yue, McCracken, Luby and McFerson2013) explored consumer preferences for quality traits in apples using sensory tasting tests and experimental auctions. Their results showed that the value consumers placed on the quality traits depended on the information they were given. For example, consumers were willing to pay the highest premium for size and color when they received information on the apples' appearance and for sweetness and crispness when they were provided information on the results of the sensory taste test.
In addition, some studies have focused specifically on consumer preferences or WTP for attributes of sweet cherries. Miller, Casavant, and Buteau (Reference Miller, Casavant and Buteau1996) found that Japanese consumer purchases of sweet cherries were positively correlated with attributes of taste, freshness, color, and shape/size. Guyer et al. (Reference Guyer, Sinha, Chang and Cash1993) concluded that sweetness, flavor, and firmness were positively correlated with overall acceptability for consumers in Michigan. A study of Norwegian consumers by Lyngstad and Sekse (Reference Lyngstad and Sekse1995) showed that consumers preferred dark cherries and large cherries. Kappel, Fisher-Fleming, and Hogue (Reference Kappel, Fisher-Fleming and Hogue1996) in a study of Canadian consumers of sweet cherries found that the optimal size was 29 millimeters in diameter, the minimum SSC was 17–19 percent, and the optimum acidity was a pH of 3.8. Another study of Canadian consumers by Cliff et al. (Reference Cliff, Dever, Hall and Giraud1996) reported that acceptability was positively correlated with color, size, flavor intensity, and sweetness. Crisosto, Crisosto, and Metheney (Reference Crisosto, Crisosto and Metheney2003) examined acceptance of sweet cherries by California consumers and found that it was positively influenced by greater SSCs, lower titratable acidity (TA), a higher SSC/TA ratio, and darker skin color. Hu (Reference Hu2007) found that consumers in Portland, Oregon, were willing to pay a premium of $0.87 for an extra unit of sweetness and $0.35 for an extra unit of firmness.
Other studies of sweet cherries mainly focused on factors that affected price levels and variations in price. Carew, Florkowski, and Doroudian (Reference Carew, Florkowski and Doroudian2012) analyzed price-determination factors in sweet cherry markets in British Columbia, Washington, Oregon, and California. The study applied an inverse demand system to capture the effects of demand and supply factors relevant to cherry growers. They found negative substitution effects for prices of sweet cherries, raspberries, and strawberries for all four regions. Similarly, Flaming, Marsh, and Wahl (Reference Flaming, Marsh and Wahl2007) used an inverse demand system to estimate factors that affected the farm-level price of sweet cherries in the Pacific Northwest and California. They found that each state's production, domestic consumption, and exports explained 60–78 percent of the variation in the annual price and that prices were most sensitive to the quantities supplied to foreign and domestic markets.
Miller, Casavant, and Buteau (Reference Miller, Casavant and Buteau1996), Lyngstad and Sekse (Reference Lyngstad and Sekse1995), Kappel, Fisher-Fleming, and Hogue (Reference Kappel, Fisher-Fleming and Hogue1996), and Cliff et al. (Reference Cliff, Dever, Hall and Giraud1996) found positive links between foreign consumers' acceptance and the taste, sweetness, color, shape, and size of sweet cherries. Guyer et al. (Reference Guyer, Sinha, Chang and Cash1993) and Crisosto, Crisosto, and Metheney (Reference Crisosto, Crisosto and Metheney2003) studied consumer preferences for sweet cherries in Michigan and California, respectively. The studies used regional consumer samples instead of a national consumer sample but did not investigate consumer WTP for the fruit's attributes. Hu's (Reference Guyer, Sinha, Chang and Cash2007) analysis of consumer WTP for sweet cherries is most similar to the present study, but Hu's sample was not representative of U.S. consumers and the study did not include a consumer segmentation analysis. Our study expands on prior investigations of consumer preferences for sweet cherries because it is focused on U.S. consumers' WTP for sweet cherry attributes. In addition, our study captures heterogeneous consumer preferences and explores potential market segmentation. The results are useful for breeders in prioritizing traits of sweet cherries in their breeding programs and shed light on potential targeted-marketing strategies that growers and retailers can adopt.
Methodology
Choice Experiment
Choice experiments are widely used by researchers as an efficient tool to study consumer preferences and WTP for goods (Lusk and Schroeder Reference Lusk and Schroeder2004, Yue and Tong Reference Yue and Tong2011). Choice experiments are based on random utility theory and Lancaster's consumer demand theory, which assumes that consumers derive utility from attributes of a good rather than from the good itself. By presenting consumers with different combinations of choices, the experiment replicates consumers' rational decision-making process and derives their utility for each attribute. Additionally, choice experiments can force respondents to consider tradeoffs between attributes, allow for estimation of implicit prices for attributes, can be used to estimate customer demand for a service in nonmonetary terms, and can potentially reduce the incentive for respondents to behave strategically. One potential drawback of choice experiments is that participants do not make “real” purchases; instead, the choices are hypothetical. However, Lusk and Schroeder (Reference Lusk and Schroeder2004) demonstrated that the bias associated with estimated marginal WTP from hypothetical choice experiments (relative to nonhypothetical choice experiments) is reduced when the questions are framed to closely simulate an actual purchasing situation.
In this study, we use a choice experiment to explore consumer preferences and WTP for six quality attributes of sweet cherries. Since it was not practical to present every possible combination of product attributes, we developed a fractional factorial design to minimize the number of scenarios and maximize the variety of profiles. For further discussion of fractional factorial designs, see Louviere (Reference Louviere, Hensher and Swait2000). The choice scenarios were designed using JMP® 8 software (SAS Institute, North Carolina). In the experiment, participants were presented with eight scenarios that each presented two options involving various combinations of product attributes. A third “opt out” option was also presented so participants could choose not to select either of the two options in a choice scenario.
Product Attributes
From prior studies and in consultations with experts in the sweet cherry industry, we identified six traits for the study: color, size, firmness, sweetness, flavor, and shelf life. These attributes were tested with a small sample of consumers, which confirmed that they are the most important quality traits for consumers. In addition, we included two prices, $3.99 and $2.99 per pound, to capture how price affects consumers' purchasing decisions. The prices were based on the average retail price of sweet cherries in 2011. The attributes and levels included in the choice experiment are described in Table 1.
Table 1. Sweet Cherry Attributes and Attribute Levels Used in the Choice Experiments
Sampling Method
The choice experiment in this study was conducted online with randomly selected consumers from across the United States who were recruited by Qualtrics™, a professional survey company. Online surveys have become increasingly popular as a primary tool for collecting consumer preference data by researchers. To ensure that the sample was representative of consumers of sweet cherries, only consumers who had purchased sweet cherries in the past year were included in the experiment. Figure 2 presents one of the choice scenarios from the online survey. In addition to the eight choice scenarios, nineteen questions asked participants about their purchasing habits and socio-demographic backgrounds.
Figure 2. Example Choice Scenario in the Survey
Econometric Models
Because consumers often display heterogeneous preferences that are unrelated to observable characteristics, it is important to employ a model that allows for evaluation of that heterogeneity (Lusk, Roosen, and Fox Reference Lusk, Roosen and Fox2003, Ouma, Abdulai, and Drucker Reference Ouma, Abdulai and Drucker2007, Tonsor, Wolf, and Olynk, Reference Tonsor, Olynk and Wolf2009). Hence, we use a mixed logit model to estimate consumer WTP for the sweet cherry attributes. One advantage of the mixed logit model is that it allows the parameters to vary randomly when there are correlations between them (Train Reference Train2003). In other words, the mixed logit model relaxes the assumption of independence of irrelevant alternatives (IIA)Footnote 1 and the relative odds for two alternative outcomes depend exclusively on the characteristics of each outcome. Thus, the odds do not depend on the number and the nature of the other outcomes considered simultaneously. Another reason for using a mixed logit model instead of other discrete-choice models is that the mixed logit model estimates preference heterogeneity by allowing taste parameters to vary randomly across individuals.
The utility an individual consumer derives from choosing an alternative in a choice scenario is specified as
 $$U_{ijt} = {\rm \beta} _i {\bf x}_{ijt} + {\rm \varepsilon} _{ijt} $$
where U ijt is the utility of individual i (i = 1, 2, … , N) derived from alternative j (j = 1, 2, … , M) in scenario t (t = 1, 2, … , W), xijt is a vector of observed variables that relates to individual i for alternative j in scenario t, and βi represents the corresponding unobserved individual-specific coefficient vectors, which are assumed to follow a normal distribution with the density function f (β | θ) where θ is the fixed parameter vector of the normal distribution and εijt is a random term that is assumed to be an independently and identically distributed extreme value.
The empirical specification for the mixed logit model is
 $$\eqalign{ U_{ijt} &= {\rm \beta} _{i1} Price_{ijt} + {\rm \beta} _{i2} Color_{ijt} + {\rm \beta} _{i3} Size_{ijt} + {\rm \beta} _{i_4} Firmeness_{ijt} \cr &\quad + {\rm \beta} _{i5} Sweetness_{ijt} + {\rm \beta} _{i6} Flavor_{ijt} + {\rm \beta} _{i7} Shelflife_{ijt} + {\rm \varepsilon} _{ijt}.} $$
Conditional on βi, the probability of individual i choosing alternative j in choice scenario t is given by
 $$L_{ijt} \lpar{{\rm \beta} _i} \rpar= e^{{\rm \beta} _i x_{ijt}} / \sum \nolimits_{\,j = 1}^M e^{{\rm \beta} _i x_{ijt}} $$
In this application, βi is unknown. The unconditional probability of the observed choices is the conditional probability integrated over the distribution of βi:
 $$Pr_{ijt}\left \lpar \theta \right\rpar = \int L_{ijt}\left\lpar {{\rm \beta }_i} \right\rpar f \left\lpar {{\rm \beta }_i \vert \theta } \right\rpar d{\rm \beta }_i. $$
The mixed logit model estimates average WTP for the entire sample and allows us to test for heterogeneity of preferences using the estimated variance and covariance matrix of the coefficient estimates.
To identify groups of consumers based on their heterogeneous preferences for sweet cherry attributes, we use a latent class model. The model identifies the number of consumers in each segment and reveals the sources of heterogeneity through a comparison of the distinct characteristics of each segment. The model assumes that individuals can be sorted into a number of latent classes or unobservable subgroups of the population and that those classes are characterized by homogeneous preferences. The preferences across classes are heterogeneous. In the model, the probability that individual i will choose option j in choice scenario t for a given latent class s is
 $$Pr\lpar{ijt\; \vert \; s} \rpar= \mathop \prod \nolimits_{t = 1}^W e^{{\bf \beta} _s {\bf x}_{ijt}} /\; \mathop \sum \nolimits_{\,j = 1}^M e^{{\bf \beta} _s {\bf x}_{ijt}} $$
where xijt is a vector of observed attributes associated with alternative j and βs is a vector of class-specific utility parameters (Ouma, Abdulai, and Drucker Reference Ouma, Abdulai and Drucker2007). Since an individual respondent's class membership status is unknown, the weight for latent class s is the share of the total population in that class and is specified by a fractional multinomial logit. That is, the probability that individual i belongs to class (group) s is given by
 $$Pr\lpar s \rpar= e^{{\bf \theta} _s m_t} / \lpar 1 + \mathop \sum \nolimits_{s = 1}^{S - 1} e^{{\bf \theta} _s m_t} \rpar $$
where m t is a set of observable individual characteristics that affect class membership and θs is a vector of unobservable but estimable coefficients associated with the class.
Results
Summary Statistics of Socio-demographic Backgrounds and Purchasing Habits
Summary statistics for the 783 participants who completed the choice experiment and related survey are presented in Table 2. The average age of participants was 42, and 65 percent were female. A relatively large share of the participants (43 percent) had at least a two-year degree or the equivalent and the majority (74 percent) were Caucasian. Twenty-seven percent of the participants had an annual household income greater than $75,000.
Table 2. Summary Statistics for Participants' Background Information in the Choice Experiment
Table 2 also compares our sample to data on the U.S. population as a whole (U.S. Census Bureau 2010). Our sample included proportionately more women, which is not surprising since it included only individuals who had purchased sweet cherries in the past year and women are more often a household's primary grocery shopper (Shi, Gao, and House Reference Shi, Gao and House2011). The incomes of our participants were slightly lower and a smaller percentage of their households included children relative to the general U.S. population.
About 53 percent of the surveyed consumers ate fresh sweet cherries less than twice a month, which is consistent with Florkowski and Carew (Reference Florkowski and Carew2011). The majority of the participants purchased sweet cherries from conventional grocery stores and warehouse retailers, followed by farmers' markets, natural food stores, and cooperatives. Labels on cherry containers appeared to influence their purchasing decisions: nearly 91 percent thought safety-related information on labels was important, 75 percent regarded health-related information as important, 45 percent preferred organic sweet cherries, 35 percent valued eco-labels, and 22 percent viewed non-GMO labels as important. Labels indicating the brand and sustainable production were the least important at about 9.7 percent and 2.0 percent respectively.
Results of the Mixed Logit Model
The coefficient estimates from the mixed logit model are presented in Table 3. The log-likelihood ratio test statistic is –3,305.588 with a p-value of less than 0.01, indicating that the overall model fits the data well. The coefficients for all of the sweet cherry attributes except color are positive and significant at the 1 percent level (p-value < 0.01). These results indicate that consumers prefer large, firm, sweet, and flavorful cherries that have a relatively long shelf life. The coefficient on price is significant and negative, indicating that price is a statistically important factor for consumers and that increases in price reduce the likelihood that consumers will purchase sweet cherries. The coefficient on the color variable is insignificant so we cannot draw a conclusion regarding consumers' color preferences (red versus dark). Sweetness and flavor are the two most sought-after quality traits, ranking higher than firmness, shelf life, and size. In other words, when consumers purchased sweet cherries, they looked for cherries that were sweet and had intense cherry flavor. The results do not support consumers making purchasing decisions based solely on fruit color given the insignificant coefficient of the color attribute. All of the coefficients on the standard deviations are significant, indicating that consumers' preferences for the attributes of sweet cherries are heterogeneous.Footnote 2
Table 3. Estimation Results of Mixed Logit Model
Note: *, **, and *** denote significance at the α = 0.1, 0.05, and 0.01 levels, respectively.
Using the estimated coefficients, WTP values for the cherry attributes are calculated as the ratio of the mean coefficient associated with the attribute to the mean coefficient of the price (Train Reference Train2003). Those results are reported in Table 4. We find that consumers are willing to pay an additional $1.89 per pound for relatively sweet cherries, $1.44 per pound for intense flavor, $0.97 per pound for relatively firm cherries, $0.75 per pound for a relatively long shelf life, and $0.60 per pound for relatively larger cherries, ceteris paribus.
Table 4. Willingness-to-pay Estimates for Sweet Cherry Attributes from the Mixed Logit Model
Results of the Latent Class Logit Model
Information about consumers' WTP for sweet cherry quality traits can help producers prioritize traits when allocating resources in their breeding programs. The significance of the coefficients on standard deviation in the mixed logit model support our hypothesis that consumers' preferences for various attributes of sweet cherries are heterogeneous, spurring us to extend the analysis by categorizing consumers according to their preferences and examining the size of each consumer segment. Such information is particularly useful for producers interested in targeted marketing strategies.
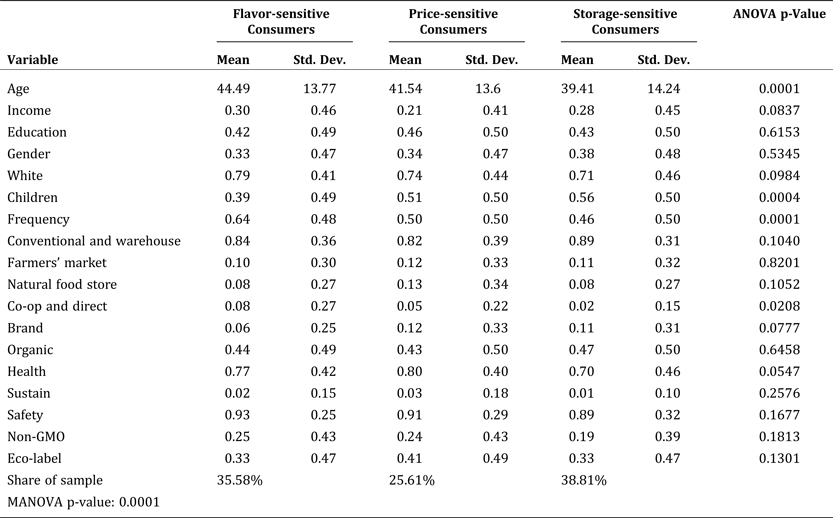
To explore the unobservable subgroups within the sample, we use a latent class logit model. We applied the Bayesian information criterion to determine the optimal number of latent classes (Pacifico and Yoo Reference Pacifico and Yoo2012) and found that a three-class model was optimal and provided the greatest posterior prediction accuracy (89.8 percent). The model performed well in distinguishing unobservable subgroups from the observed choice behavior. The results of the latent class logit model are presented in Table 5 along with corresponding demographic characteristics and purchasing habits for each latent class. As shown in Table 5, the groups are labeled by their collective sensitivity to an attribute: flavor-sensitive, price-sensitive, and storage-sensitive consumers. The segments are similar to ones identified by Hu (Reference Hu2007) for apples.
Table 5. Estimation Results of Latent Class Logit Model
Flavor-sensitive consumers account for 35.58 percent of the sample. The dominant characteristic of this group is a strong preference for sweetness and flavor as the coefficients for those traits are positive and significant. Sweetness is most strongly preferred. The other positive and significant quality trait is color; consumers in this group prefer dark red fruit.
Price-sensitive consumers account for 25.61 percent of the sample. The coefficient on price is negative, significant, and relatively large in absolute terms. Thus, consumers in this group are highly sensitive to price and prefer cheaper cherries. The coefficient on color for this group is positive and significant, indicating a preference for dark red fruit, and is larger than the color coefficient for flavor-sensitive consumers. The other attributes are not statistically significant in this group.
Storage-sensitive consumers accounted for the largest percentage of the sample (38.81 percent). Most were from Washington, California, Oregon, and Michigan, which are major sweet-cherry-producing states. This group of consumers valued color, firmness, shelf life, sweetness, and size (ordered by magnitude of the coefficients). The coefficients on size, firmness, and shelf life are larger than the coefficients on those traits in the other groups. Storage-sensitive consumers also prefer sweetness but not as much as the flavor-sensitive consumers do. Unlike the other groups, storage-sensitive consumers prefer light red fruit, perhaps because lighter fruit are considered less ripe and are therefore viewed as having a longer shelf life.
Socio-demographic Backgrounds and Purchasing Habits of the Groups
The mean statistics of the socio-demographic characteristics and purchasing habits of consumers in each group are listed in Table 6. Multivariate (MANOVA) and univariate (ANOVA) analysis-of-variance tests are used to determine whether the three groups of consumers differ significantly in terms of socio-demographic characteristics and purchasing habits for sweet cherries. MANOVA tests for differences among the three vectors of means while ANOVA tests for variable-by-variable differences in means among the three groups. The MANOVA p-value (for all demographic variables) is 0.0001, which rejects the null hypothesis that the mean vectors of the variables are the same. ANOVA is then used to test the variables individually. When an ANOVA p-value is significant, we conduct pair-wise t-tests to identify which groups differ. A p-value less than 0.1 is used as a threshold for significance.
Table 6. ANOVA and MANOVA Test Results for Consumer Demographic Characteristics and Purchasing Habits for the Consumer Groups
The consumer groups differ significantly in terms of average age. The flavor-sensitive consumers are oldest at 45 years, followed by price-sensitive consumers at 42 years and storage-sensitive consumers at 39 years. The t-test results show these differences are significant. We thus conclude that the older the consumer, the more likely the consumer is to care about sweetness and flavor. Younger consumers are likely to care more about being able to store sweet cherries for longer periods.
The groups differ in terms of income with price-sensitive consumers having a significantly lower average income than consumers in the other groups, and the flavor-sensitive group includes significantly more Caucasian consumers. The smallest percentage of Caucasian consumers is in the storage-sensitive group. The groups also differ in terms of the presence of children in the household and in frequency of consuming sweet cherries. Storage-sensitive consumers are most likely and flavor-sensitive consumers are least likely to have children.
Flavor-sensitive consumers consume fresh sweet cherries more often than the other groups. Since fresh cherries are highly perishable and lose flavor over time, we hypothesize that consumers who have a strong preference for flavor are frequent consumers (and buyers) so they can obtain fruit with the best flavor. Storage-sensitive consumers, on the other hand, would likely purchase sweet cherries relatively infrequently. The ANOVA and pair-wise t-test results support these hypotheses. Flavor-sensitive consumers consume sweet cherries most often, followed by price-sensitive consumers, and storage-sensitive consumers.
We also examine differences in the groups in terms of the types of shopping outlets used when purchasing sweet cherries. Our analysis of the whole sample shows that more than 80 percent of the participants made their purchases at conventional stores and warehouse retailers such as Wal-Mart, Target, and Costco. The ANOVA and pair-wise t-test results show a significant difference between storage-sensitive and flavor-sensitive consumers: the storage-sensitive group is most likely to purchase from conventional stores and warehouse retailers. We find no significant differences between price-sensitive and flavor-sensitive consumers in terms of outlets used. Flavor-sensitive consumers buy sweet cherries from cooperatives and directly from growers more often than storage-sensitive consumers do. We also find no significant differences between flavor-sensitive consumers and price-sensitive consumers in terms of outlets used. Sweet cherries sold directly are often fresher and more flavorful because they have not been transported. Thus, these results are consistent with our expectations.
In terms of label information, we find significant group differences in the preference for safety-related information. Almost 80 percent of consumers in the flavor-sensitive and price-sensitive groups indicated that health-related information was important when making a decision about purchasing sweet cherries while only 70 percent of consumers in the storage-sensitive group regarded that information as important. About 12 percent of price-sensitive consumers, 11 percent of storage-sensitive consumers, and 6 percent of flavor-sensitive consumers viewed brand identification as a key factor.
Conclusion and Marketing Implications
Many prior studies have analyzed consumers' WTP for attributes of various fruit products, but our study is one of the first to focus on consumers' WTP for attributes of sweet cherries at a national level and to investigate heterogeneous consumer preferences for those attributes. The primary goal of this research is to identify the quality traits that are most important to consumers and segments of the sweet cherry market based on consumers' demographic characteristics and purchasing habits. Our results provide a direct assessment of the relative importance of such attributes to consumers and estimates of the amount consumers are willing to pay for each attribute. Our identification of market segments provides deeper insight into links between consumers' preferences for individual attributes of sweet cherries and their characteristics, allowing producers to target marketing efforts more effectively.
Preferences and Market Segments
Consumers have diverse preferences for quality traits of sweet cherries. On average, they are willing to pay the highest premiums for cherries that are sweeter and have more intense flavor. Darker color and larger size generate the lowest premiums, indicating that, on average, consumers care more about the sweetness and flavor of cherries than about their color. However, we need to take into account that consumers cannot judge the cherries' taste until after purchases are made. As a result, opportunities exist for producers and suppliers to inform consumers about their products' taste using labeling.
To identify market segments, we analyzed shared preferences for particular attributes in the consumer sample and assigned each consumer to one of three groups: flavor-sensitive, price-sensitive, and storage-sensitive consumers. We then examined the socio-demographic characteristics and purchasing habits of the consumers in each group and found distinct differences between the segments.
Compared to the other groups, flavor-sensitive consumers have the highest incomes, are oldest, and are mostly Caucasian. They are less likely to have children, and they consume sweet cherries relatively frequently. They also tend to purchase sweet cherries at cooperatives and via direct sales more often than consumers in the other groups do. Brand information is not an important factor for flavor-sensitive consumers when deciding whether to purchase sweet cherries.
The main characteristics of price-sensitive consumers are their intermediate age and much lower incomes than consumers in the other groups. Both the likelihood of children in their households and their frequency of consumption of sweet cherries are intermediate relative to the other two groups. Price-sensitive consumers are least likely to purchase sweet cherries at conventional grocery stores and warehouse stores.
Storage-sensitive consumers are the youngest on average and are more likely to be non-white. Their households are most likely to have children and they consume sweet cherries least often. Storage-sensitive consumers are most likely to purchase sweet cherries at conventional grocery stores and warehouse stores and least likely to purchase them at cooperatives and through direct sales. Health-related information on labels is least important to storage-sensitive consumers.
Marketing Implications
This study contributes to a larger project funded by the U.S. Department of Agriculture aimed at promoting marker-assisted breeding for crops in the Rosaceae family (e.g., apples, pears, and sweet cherries) and increasing the long-term economic sustainability of those crops. The information on preferences and WTP for sweet cherry attributes of consumers presented here and of producers and market intermediaries (not presented) can be used by producers to prioritize traits in their breeding programs and by growers and retailers to establish targeted marketing strategies.
We find that consumers care most (have the highest WTP) about sweetness and then about flavor, firmness, shelf life, and size. The fruits' color does not significantly influence their purchasing decisions. This result contradicts the commonly held view that color is important to consumers when they purchase fruit. Instead, it supports the theory that consumers make sophisticated purchase decisions. Further evidence of sophisticated decision-making lies in our finding that the most frequent purchasers of sweet cherries also place the highest value on sweetness and flavor. Thus, producers should make sweetness and intense flavor a higher priority as long as threshold levels of color traits can be met.
The consumer-segmentation analysis provides important information by connecting consumers' preferences for attributes of sweet cherries to their demographic characteristics and purchasing habits. Companies gain an advantage over their competitors by understanding their customers' unique needs. By accurately identifying their target markets and better serving their customers, companies can maintain a competitive advantage, and market segmentation is an important tool for identifying the target markets.
We find that flavor and sweetness are important attributes for all three segments of consumers. But consumers cannot directly assess those attributes prior to purchasing cherries. We therefore recommend that suppliers label their especially sweet and flavorful varieties for consumer recognition at points of purchase. In addition, those varieties should be marketed to cooperatives and direct-sale outlets to attract flavor-sensitive consumers. Larger fruit sizes and greater firmness are also desirable to consumers, and those attributes are visible to consumers when shopping. Suppliers could market sweet cherries that offer a longer shelf life to target storage-sensitive consumers and use in-store signs and labels to inform consumers about the expected shelf life of their products. Conventional and discount stores could stock sweet cherries that cost less and/or have a longer shelf life to attract price-sensitive consumers, generating greater profits for suppliers. And as sweet cherry consumers focus more on health-related aspects of sweet cherries, labels could address safety, health effects, and organic production to potentially add value relative to brand labels.
A limitation of our study is that we were not able to use taste tests of actual cherries since our goal was to look beyond the collective attributes in current varieties. To minimize the impact of this limitation, we created an online experiment that closely resembled the actual purchasing environment to ensure the validity of our results (Lusk and Schroeder Reference Lusk and Schroeder2004).


 Open access