


Introduction
The bureau voting model maintains that public employees differ fundamentally from private-sector workers in terms of their political beliefs and actions (Garand, Parkhurst, and Seoud Reference Garand, Parkhurst and Seoud1991; Jensen, Sum, and Flynn Reference Jensen, Sum and Flynn2009; Niskanen Reference Niskanen1971). A key proposition within this model suggests that such differences derive from public employees being producers as well as consumers of public services. In contrast to other citizens—who derive policy interests only from the consumer side—public employees thereby gain a double motive to show up at the polls and influence public policy (e.g., Geys, Murdoch, and Sørensen Reference Geys, Murdoch and SørensenForthcoming). Although a long-standing empirical literature addresses this bureau voting model (Corey and Garand Reference Corey and Garand2002; Garand, Parkhurst, and Seoud Reference Garand, Parkhurst and Seoud1991; Jaarsma, Schram, and Van Winden Reference Jaarsma, Schram and Van Winden1986; Roscoe Reference Roscoe1933), the double-motive hypothesis has not been subjected to careful empirical scrutiny. Yet, settling the issue is of substantive importance. Since public employees support left-wing parties to a higher extent (Jensen, Sum, and Flynn Reference Jensen, Sum and Flynn2009; Knutsen Reference Knutsen2005; Rattsø and Sørensen Reference Rattsø and Sørensen2016; Tepe Reference Tepe2012), any occupation-specific turnout disparity might influence election outcomes and subsequent public policies. Left-wing (right-wing) governments would furthermore gain incentives to expand (contract) the public sector workforce to reap subsequent electoral gains.
This research note provides a novel empirical test of the occupation-specific turnout incentives implied by the double-motive hypothesis. Extant research has relied predominantly on cross-sectional survey data, and identifying the causal effects within such a framework assumes that confounding factors—including job motivation and civic engagement—can be accommodated via background variables as regression controls. This assumption is likely to be violated due to preference-based job selection. For instance, ideological preferences could induce sorting of left-wing pro-government and right-wing pro-market applicants into public and private sector occupations. Moreover, people characterized by high public service motivation or public service values may seek employment in the public sector (Perry and Vandenabeele Reference Perry and Vandenabeele2015) while also being more likely to vote due to their higher civic-mindedness and community engagement (Brewer Reference Brewer2003). Thus, job selection implies that (possibly unobserved) individual-level qualities may account for public–private turnout differences in cross-sectional research.
Our empirical analysis employs population-wide individual-level register data covering elections to the Norwegian national parliament in 2013 and 2017, as well as elections to the Norwegian local councils in 2015 and 2019. Compared with survey data, our register data are not susceptible to systematic dropout because the entire eligible population is registered automatically on the election roll (Bratsberg et al. Reference Bratsberg, Dawes, Kotsadam, Lindgren, Öhrvall, Oskarsson and Raaum2021). Furthermore, our register data derive from the electronic voting system, which avoids recall or social desirability biases prevalent in survey data. For example, Bednarczuk (Reference Bednarczuk2018) shows that bureaucrats are more likely to overreport electoral turnout. Finally, the longitudinal nature of our register data uniquely allows tracking the same individuals over time. This provides a critical opportunity to develop three identification strategies exploiting, respectively, individuals’ shifts between private and public sector employment, their relocations between municipalities, and their shift into retirement.Footnote 1
Institutional Setting and Data
Norway has three levels of government: national, county, and municipal. Elections at national and local (i.e., county and municipal) level take place every four years, though with two years between both types of elections. Both elections use similar proportional representation electoral systems to allocate seats across parties (Cirone, Cox, and Fiva Reference Cirone, Cox and Fiva2021). All Norwegian nationals are automatically included in the Population Register and are qualified to vote at 18 years or older (with very few exceptions). Any person qualified for casting a vote is also eligible for holding political office (again, with very few exceptions).Footnote 2
Since 2013, Statistics Norway collects individual-level data on the eligible population and electoral participation, mostly through electronic voting systems. These data derive from complete lists of the electoral roll in the 15 most populous municipalities in 2013 and were expanded to cover 27, 255, and all 356 municipalities for the 2015, 2017, and 2019 elections, respectively. Smaller samples overweighting the immigrant population are available for the remaining municipalities. In total, our dataset covers just under 10 million individual-level observations (4.7 million for local elections and 4.1 million for national elections; see Table A.1 in the Online Appendix).
The detailed nature of the data allows us to identify five main employment sectors: general government, (non)financial corporations, nonprofits, households, and the rest of the world.Footnote 3 General government is thereby divided into local government (municipalities and counties) and central government. We classify all citizens who are self-employed or work in (non)financial corporations (whether publicly or privately owned) as private sector. Citizens working in nongovernment, nonprofit institutions are defined as a separate category. Finally, our information includes individuals’ residential and work municipality such that we can observe whether citizens work in the municipality where they cast their vote.
Research Design
Shifting Employment between Private and Public Sector
Our first identification strategy considers employees who change jobs between the private and public sectors. Assuming that ideological and other preferences are fixed in the short term (see below), a move from the private to the public sector switches on the additional producer incentive to turn out and vote. This double-motive effect should be larger for local versus national elections because bureaucrats’ role as a producer of public services is stronger at the local level. To assess this double-motive effect, let $ {V}_{imt} $
equal 1 if individual i casts her vote in municipality m in election year t (and 0 otherwise). Our baseline specification then is
$ {V}_{imt} $
equal 1 if individual i casts her vote in municipality m in election year t (and 0 otherwise). Our baseline specification then is
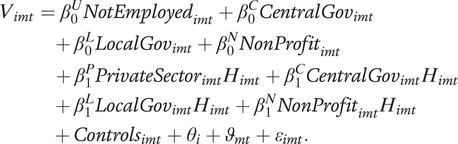
 $$ \begin{array}{c}\hskip-4pc {V}_{imt}={\beta}^U{NotEmployed}_{imt}+{\beta}^C{CentralGov}_{imt}\\ {}\hskip2pc +\hskip2pt {\beta}^L{LocalGov}_{imt}+{\beta}^N{NonProfit}_{imt}+{Controls}_{imt}\\ {}\hskip-9.0pc +\hskip2pt {\theta}_i+{\vartheta}_{mt}+{\varepsilon}_{imt}.\end{array} $$
We estimate the effects of occupational sector on voter turnout in models with fixed effects for individual ( $ {\theta}_i $
) and municipality-election year (
$ {\theta}_i $
) and municipality-election year ( $ {\vartheta}_{mt} $
). This means that we identify the effects of interest from individuals who shift between the occupational sectors across election years.Footnote
4
Specifying the for-profit private sector as reference category, we estimate a linear probability model where
$ {\vartheta}_{mt} $
). This means that we identify the effects of interest from individuals who shift between the occupational sectors across election years.Footnote
4
Specifying the for-profit private sector as reference category, we estimate a linear probability model where $ {\beta}^C $
,
$ {\beta}^C $
, $ {\beta}^L $
, and
$ {\beta}^L $
, and $ {\beta}^N $
capture, respectively, the effect of shifting from work in the private sector to the central government sector, local government sector, and nonprofit sector.Footnote
5 We define individuals who are not assigned sector affiliation or earn less than 1,000 NOK (roughly $110) as not employed. Shifting into this category is captured by
$ {\beta}^N $
capture, respectively, the effect of shifting from work in the private sector to the central government sector, local government sector, and nonprofit sector.Footnote
5 We define individuals who are not assigned sector affiliation or earn less than 1,000 NOK (roughly $110) as not employed. Shifting into this category is captured by $ {\beta}^U $
.
$ {\beta}^U $
.
The model yields generalized difference-in-differences causal estimates of occupational affiliation (Athey and Imbens Reference Athey and Imbens2006). Note that the $ {\vartheta}_{mt} $
term implies that we invoke the parallel trends assumption within municipalities (though not between them) and that we include individuals’ education levels as a time-varying control (measured in each election year).Footnote
6
Although a change in education level may trigger changes in occupation and affect turnout (e.g., Sondheimer and Green Reference Sondheimer and Green2010), excluding education from the model does not affect our inferences below. Finally,
$ {\vartheta}_{mt} $
term implies that we invoke the parallel trends assumption within municipalities (though not between them) and that we include individuals’ education levels as a time-varying control (measured in each election year).Footnote
6
Although a change in education level may trigger changes in occupation and affect turnout (e.g., Sondheimer and Green Reference Sondheimer and Green2010), excluding education from the model does not affect our inferences below. Finally, $ {\varepsilon}_{imt} $
is an idiosyncratic error term.
$ {\varepsilon}_{imt} $
is an idiosyncratic error term.
The specification with individual-level fixed effects cancels out time-invariant individual-level characteristics, which allows us to estimate the unique effect of occupational sector. This approach thus controls for (largely) fixed individual traits such as public service motivation (Kjeldsen and Jacobsen Reference Kjeldsen and Jacobsen2013; Vogel and Kroll Reference Vogel and Kroll2016) as well as features of public employment that are independent of work location. Yet, at the same time, these fixed effects could remove useful information and yield estimates susceptible to attenuation bias as a consequence of measurement error. Therefore, Table A.6 in the Online Appendix also reports all models using municipality fixed effects and the full set of available individual-level controls (i.e., age, gender, immigrant status, and education).Footnote 7
Shifting between Employment outside and within the Residential Municipality
While our first identification strategy relies on shifts between the occupational sectors, the second exploits shifts in individuals’ work location conditional on sectoral affiliation. The underlying argument is that moving residence inside/outside the municipality of employment switches on/off a higher (expected) producer benefit from well-staffed public agencies, public-sector working conditions and compensation, and influence over public policy decisions (not necessarily directly to one’s own advantage). Working in their residential municipality thus elevates local civil servants’ personal stakes in the election because the election outcome may (in)directly affect their own employment conditions (Bhatti and Hansen Reference Bhatti and Hansen2013; Moe Reference Moe2006). Letting $ {H}_{imt} $
be 1 if the individual works in the residential municipality (and thus votes where (s)he works), and 0 otherwise, we estimate the following model (all other variables defined as before):Footnote
8
$ {H}_{imt} $
be 1 if the individual works in the residential municipality (and thus votes where (s)he works), and 0 otherwise, we estimate the following model (all other variables defined as before):Footnote
8
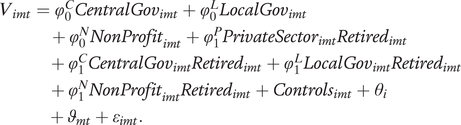
 $$ \begin{array}{c}\hskip-4pc {V}_{imt}={\beta}_0^U{NotEmployed}_{imt}+{\beta}_0^C{CentralGov}_{imt}\\ {}\hskip-3pc +\hskip2pt {\beta}_0^L{LocalGov}_{imt}+{\beta}_0^N{NonProfit}_{imt}\\ {}\hskip2pc +\hskip2pt {\beta}_1^P{PrivateSector}_{imt}{H}_{imt}+{\beta}_1^C{CentralGov}_{imt}{H}_{imt}\\ {}\hskip.2pc +\hskip2pt {\beta}_1^L{LocalGov}_{imt}{H}_{imt}+{\beta}_1^N{NonProfit}_{imt}{H}_{imt}\\ {}\hskip-4.4pc +\hskip2pt {Controls}_{imt}+{\theta}_i+{\vartheta}_{mt}+{\varepsilon}_{imt}.\end{array} $$
Including the same fixed effects (and controls) as in the baseline model, this effectively constitutes a triple-difference estimator (of time, occupation sector, and residence). The parameters for the interaction terms indicate the effects of moving to the residential municipality ( $ {\beta}_1^P $
,
$ {\beta}_1^P $
, $ {\beta}_1^C $
,
$ {\beta}_1^C $
, $ {\beta}_1^L $
,
$ {\beta}_1^L $
, $ {\beta}_1^N $
) while working in a given occupational sector. Crucially, comparing these interaction term coefficients (e.g.,
$ {\beta}_1^N $
) while working in a given occupational sector. Crucially, comparing these interaction term coefficients (e.g., $ {\beta}_1^P\;\mathrm{vs}.\hskip2pt {\beta}_1^L $
) effectively controls for common factors that affect all employees shifting their workplace into (or out of) the residential municipality (e.g., because it is convenient to work close to the day-care center in the home municipality when one has children).
$ {\beta}_1^P\;\mathrm{vs}.\hskip2pt {\beta}_1^L $
) effectively controls for common factors that affect all employees shifting their workplace into (or out of) the residential municipality (e.g., because it is convenient to work close to the day-care center in the home municipality when one has children).
Shifting from Employment to Retirement
Our third identification strategy exploits individuals’ retirement. Retirement eliminates one’s role and incentive as a producer of public services and thus removes the double-motive effect (Rattsø and Sørensen Reference Rattsø and Sørensen2016). Turnout rates may thus be expected to converge between (former) private and public sector workers upon retirement. To test this proposition, we restrict the analysis to individuals who are active employees at some point in our study period and use registry data to identify their employment sector at t - 2. Retirees are defined as persons aged 67 or more who receive more than 90% of their income from social security or old-age pensions ( $ {Retired}_{imt}=1\Big) $
, whereas active employees are younger than 67 years and receive less than 10% of their income from social security or old-age pensions (
$ {Retired}_{imt}=1\Big) $
, whereas active employees are younger than 67 years and receive less than 10% of their income from social security or old-age pensions ( $ {Retired}_{imt}=0; $
see Online Appendix Figure A1 for details). Our specification is
$ {Retired}_{imt}=0; $
see Online Appendix Figure A1 for details). Our specification is
 $$ \begin{array}{c}\hskip-8.5pc {V}_{imt}={\varphi}_0^C{CentralGov}_{imt}+{\varphi}_0^L{LocalGov}_{imt}\\ {}\hskip-1.3pc +\hskip2pt {\varphi}_0^N{NonProfit}_{imt}+{\varphi}_1^P{PrivateSector}_{imt}{Retired}_{imt}\\ {}\hskip1.2pc +\hskip2pt {\varphi}_1^C{CentralGov}_{imt}{Retired}_{imt}+{\varphi}_1^L{LocalGov}_{imt}{Retired}_{imt}\\ {}\hskip-2.3pc +\hskip2pt {\varphi}_1^N{NonProfit}_{imt}{Retired}_{imt}+{Controls}_{imt}+{\theta}_i\\ {}\hskip-13.8pc +\hskip2pt {\vartheta}_{mt}+{\varepsilon}_{imt}.\end{array} $$
As before, this effectively constitutes a triple-difference estimator (of time, occupation sector, and retirement) to identify the effects of institutional sector conditional on persons’ currently being employed or retired. The hypothesized convergence would be reflected in $ {\varphi}_1^P>{\varphi}_1^L $
(i.e., a smaller retirement-induced drop—or larger increase—in turnout among private sector relative to public sector employees).
$ {\varphi}_1^P>{\varphi}_1^L $
(i.e., a smaller retirement-induced drop—or larger increase—in turnout among private sector relative to public sector employees).
Main Findings
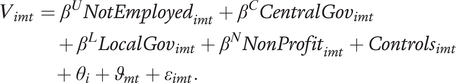
Figure 1 displays voter turnout during the 2013–2019 Norwegian elections conditional on individuals’ institutional sector affiliation (details in Online Appendix Table A2). The figure supports the common observation that turnout is higher in national (2013 and 2017) than in local (2015 and 2019) elections. More importantly, Figure 1 suggests that public employees consistently turn out at substantially higher rates than private sector employees and not-working individuals. Naturally, these raw differences in excess of 10 percentage points—consistent with evidence presented in previous cross-sectional studies (e.g., Corey and Garand Reference Corey and Garand2002; Garand, Parkhurst, and Seoud Reference Garand, Parkhurst and Seoud1991)—cannot be interpreted as causal effects. Therefore, the remainder of our analysis exploits individual-level shifts in employment sector, municipality of employment, and employment status (i.e., retirement).
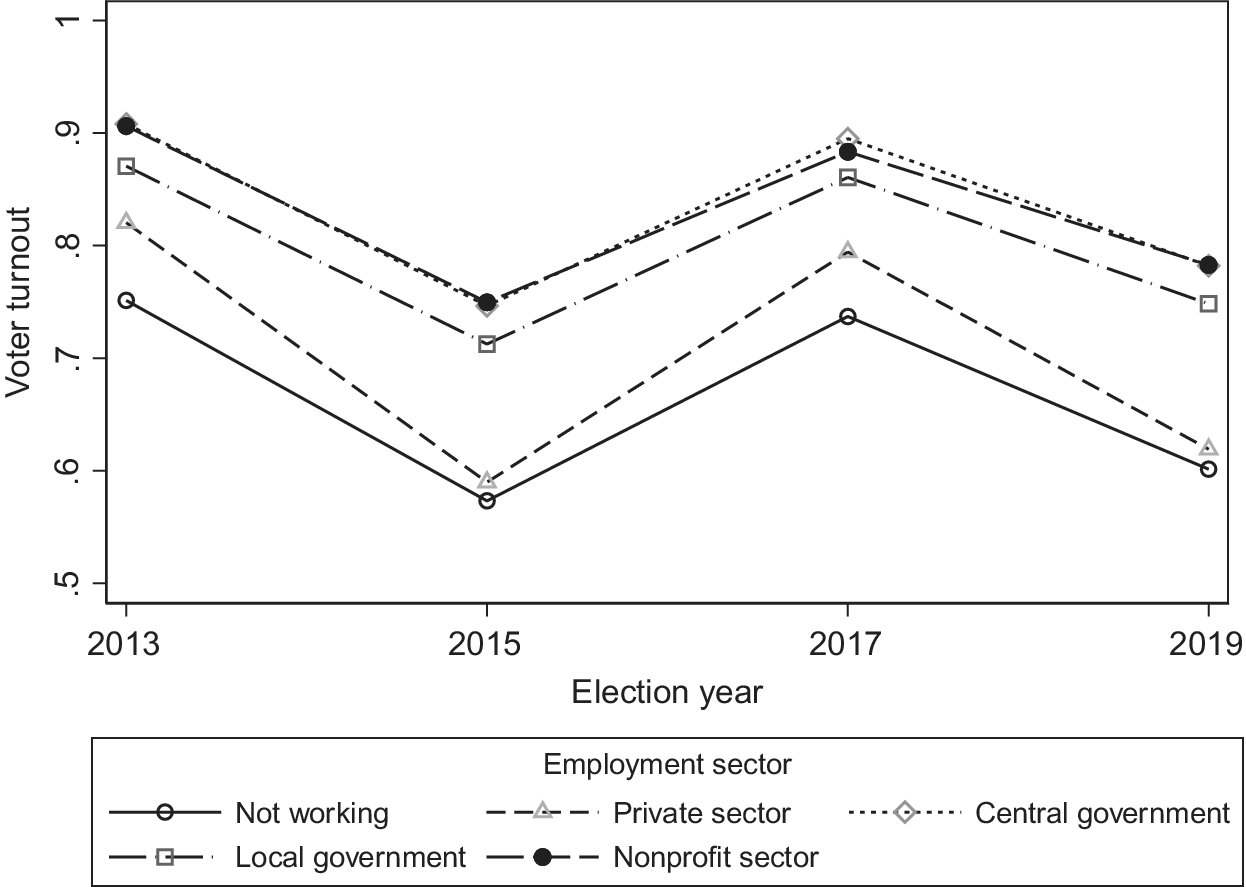
Figure 1. Voter Turnout 2013–2019
Note: The graph displays voter turnout across institutional sectors using Statistics Norway register data (see also Online Appendix Table A2).
Figure 2 summarizes the results from our first identification strategy and indicates that moving from the private sector to the local public sector causes a statistically significant increase in the probability to turn out and cast a vote. The estimated effect size is approximately 0.74 percentage points, which is roughly half the effect of losing employment (reducing the probability to vote by 1.2 percentage points; see Online Appendix Table A5). The effect of moving to the central government sector on average shows an unexpected negative effect on the probability to turn out (we return to this below). Because these estimates rely on occupation sector shifts within a two-year period between consecutive elections, they can best be interpreted as short-to-medium-term effects.
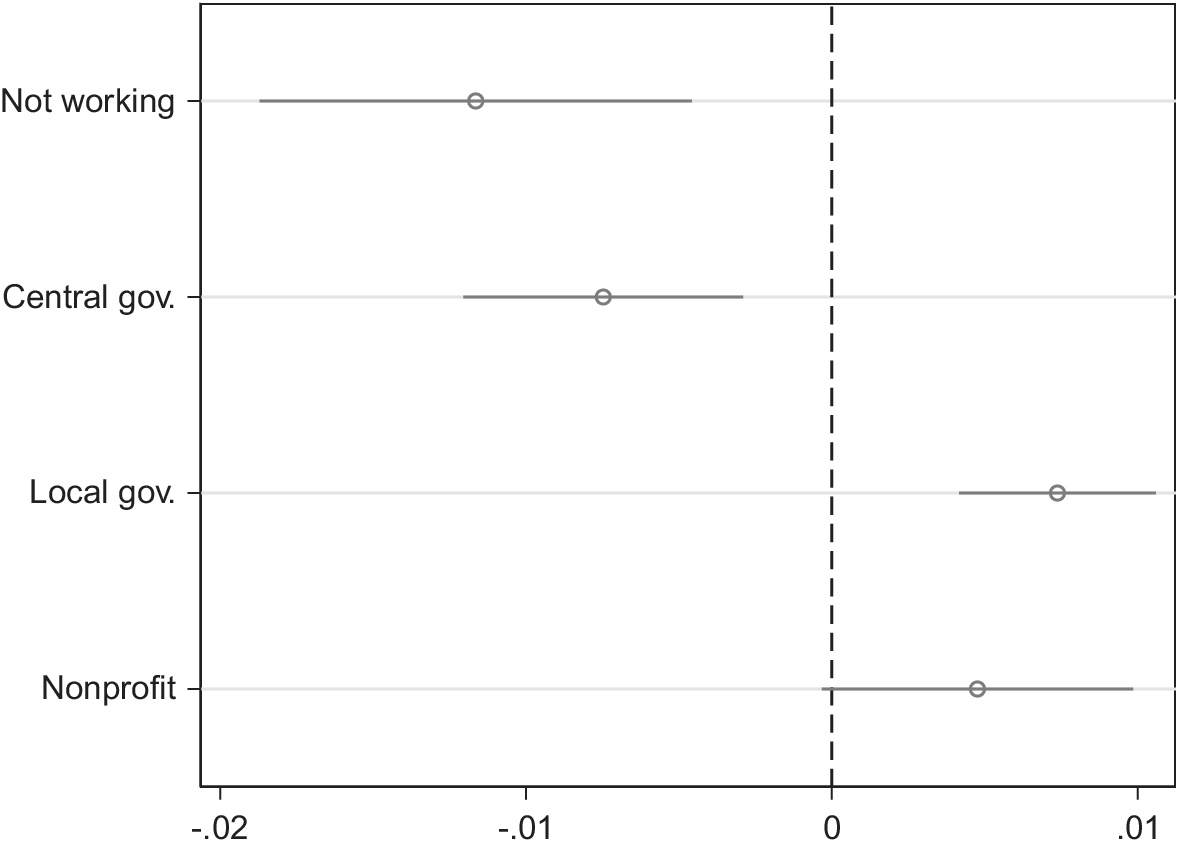
Figure 2. Turnout and Occupational Sector
Note: The graph displays estimates of occupational sector on individual-level voter turnout using linear probability models (N ≈ 9 million). Private sector employees are the reference category. The estimation model includes individual fixed effects, municipality-year fixed effects, and a time-varying control for individuals’ education level. The graph displays 95% confidence intervals using robust standard errors clustered on municipalities. Full results in Online Appendix Table A5.
In Figure 3, we extend the analysis by exploiting shifts in individuals’ work location conditional on sectoral affiliation (our second identification strategy). The results indicate that voter turnout increases when relocating to work and residing in the same municipality. This is true across all occupation sectors and may be due to reduced information (Lassen Reference Lassen2005) and “shoe-leather” costs of voting and/or increased consumption benefits from local public goods (see above). Interestingly, the effect is strongest among local public sector and nonprofit employees. Our point estimates suggest that a move of employment from outside to inside the residential municipality increases local public employees’ probability to turn out by roughly 1.6 percentage points more than the equivalent residential move by private sector and central government employees (i.e., an increase in turnout of 4.8 versus 3.2 percentage points). This difference is statistically significant (F = 19.63; p < 0.001) and is consistent with the double-motive effect because producer benefits of public services are particularly strong for local civil servants working inside the residential municipality. Online Appendix Table A5 indicates that this effect is substantially stronger during local elections than during national elections (an increase in turnout of 6.3 percentage points in local elections versus 4.4 percentage points in national elections), in line with expectations.Footnote 9
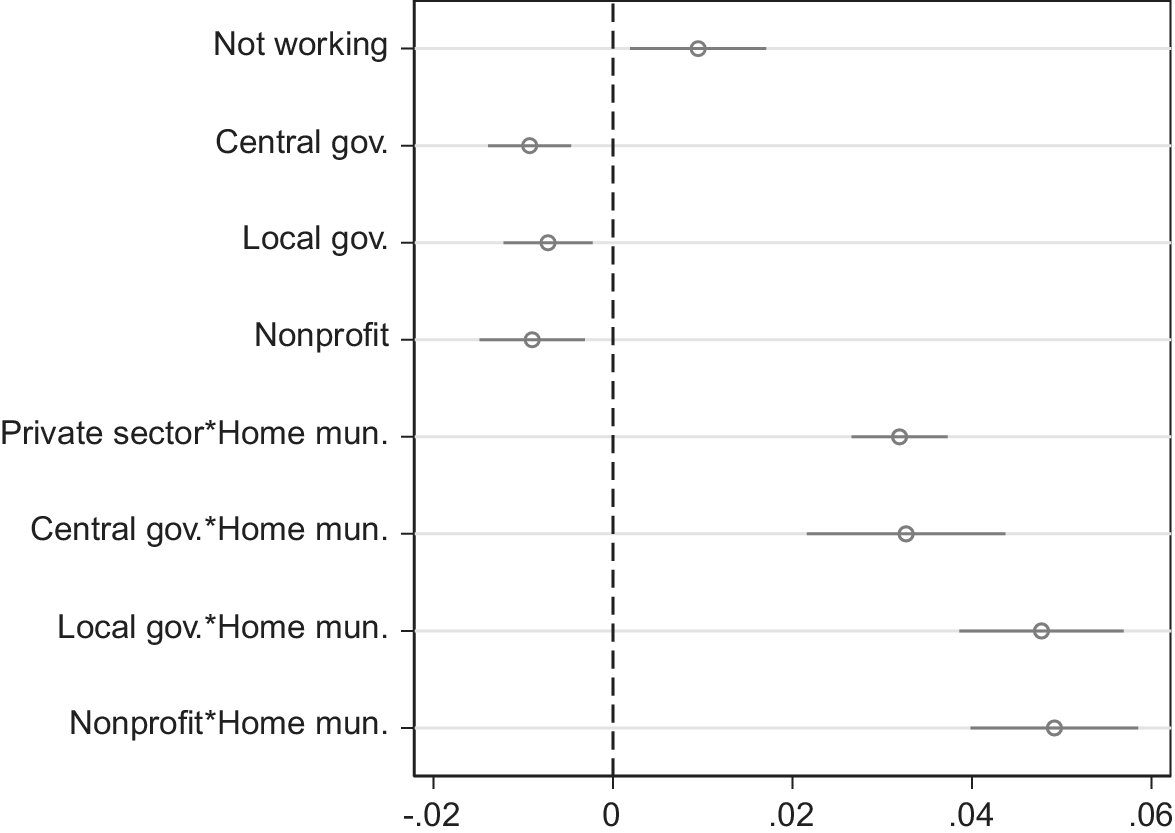
Figure 3. Turnout, Occupational Sector, and Work Location
Note: The graph displays estimates of occupational sector and work location on individual-level voter turnout using linear probability models (N ≈ 9 million). Private sector employees are the reference category. ‘Home mun.’ equals 1 (0) when the individual works inside (outside) the residential municipality. See note to Figure 2 for further estimation details. Full results in Online Appendix Table A5.
Interestingly, Figure 3 and Online Appendix Table A5 also indicate that the home municipality effect is not significantly different between nonprofit and local government employees (F = 0.05; p > 0.1). Because many local nonprofits in Norway depend on local government funding for their functioning and survival, their employees’ personal stakes in local elections may rise when moving job location into their home municipality due to the same producer reasons we highlight for local government employees. This suggests that a potentially broader phenomenon may be at work here, which not only affects local government employees. Still, this would require more in-depth verification in future research.
Finally, Figure 4 exploits individuals’ shift into retirement and displays its effect on voter turnout depending on occupational sector. The results show that only retirement from the local public sector induces a marked drop in voter turnout (estimated at approximately 7 percentage points). Retirement has no significant effect for employees in any other sector, which corroborates that the double-motive incentive for local public employees fades away following retirement. Online Appendix Figure A2 provides further evidence that turnout rates of (former) local public employees and private sector employees gradually converge after retirement. The observed strength and immediacy of the retirement effects for local government employees is somewhat unexpected and appears to go against strong socialization effects arising from (local) government employment (Kjeldsen and Jacobsen Reference Kjeldsen and Jacobsen2013; Murdoch et al. Reference Murdoch, Kassim, Connolly and Geys2019).
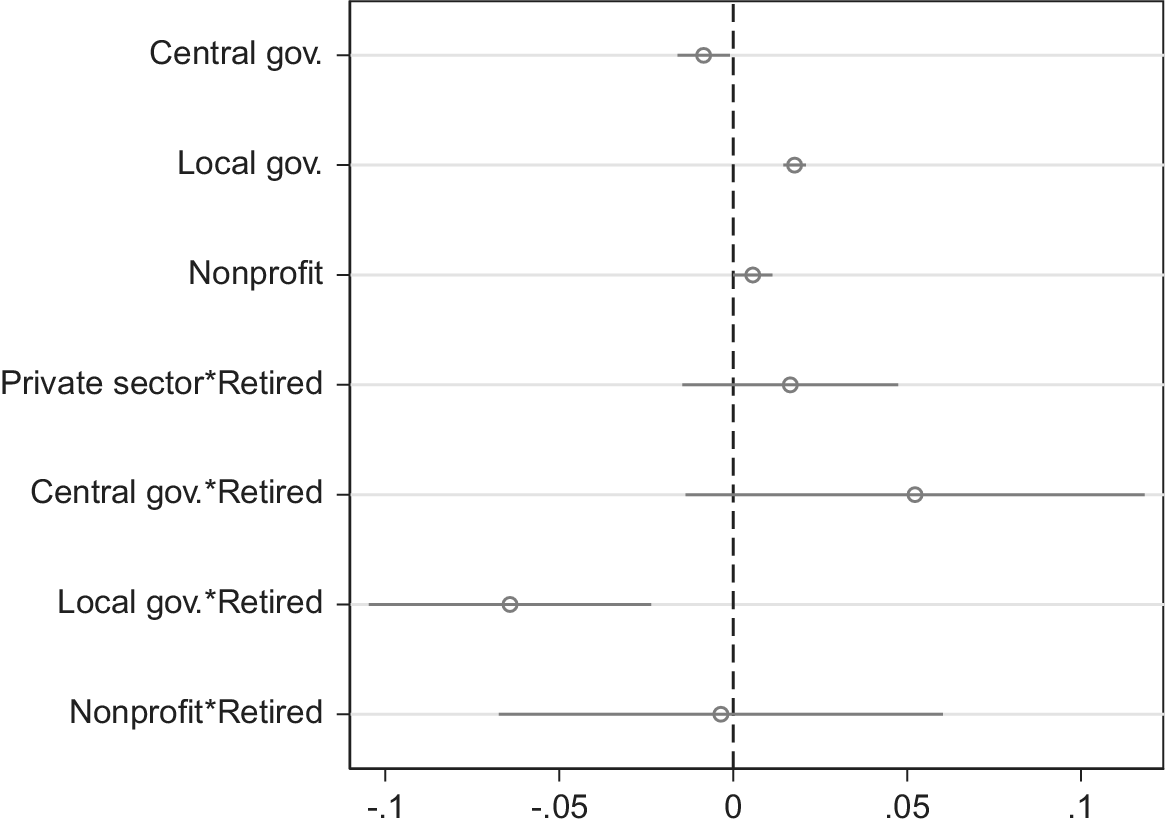
Figure 4. Turnout before and after Retirement
Note: The graph displays estimates of occupational sector and retirement on individual-level voter turnout using linear probability models (N ≈ 9 million). Private sector employees are the reference category. ‘Retired’ equals 0 for persons younger than 67 years receiving less than 10% of their income from social security/old-age pensions and 1 for persons aged 67 years or more receiving more than 90% of their income from social security/old-age pensions. See note to Figure 2 for further estimation details. Additional details reported in Online Appendix Figure A1, A2 and Table A7.
Before we conclude, we should address several potential concerns regarding the interpretation of our findings. First, one may worry that age is related to employment sector (i.e., people working in the private sector tend to be younger) and that age is nonlinearly related to turnout (i.e., older people generally are more likely to vote, but at a decreasing rate). If so, our individual fixed effects may not capture the potential influence of age (or more specifically, of growing older) on turnout. Nonetheless, this will not bias our inferences unless such a nonlinear effect of age on turnout is distinct across employment sectors. We have no reason to suspect this to be the case. Second, local public buildings are often used as early voting stations, which one could argue may boost turnout particularly among the civil servants working in them. Yet, data from the Norwegian Local Election Studies (for years 2003, 2007, 2011, and 2015) show that differences between private and public sector employees in terms of (self-reported) early voting are negligible. Thus, it appears unlikely that the positioning and differential access to early voting stations is driving our findings. Finally, part-time employment is more common in the public sector such that varying time constraints across occupational sectors may affect our results. Even so, it should be kept in mind that this cannot explain the observed effect of moving inside/outside the home municipality given one’s occupational sector (in our second test).
Conclusion
Using population-wide individual-level administrative data, this research note revisited the proposition—central to the bureau voting model—that working in the public rather than the private sector boosts electoral participation. Our analysis shows three main findings. First, individuals are more likely to vote when shifting from the private into the public sector (just under 1 percentage point on average). Second, the same is true when local public employees relocate into their residential municipality (approximately 2–3 percentage points on average). Finally, voter turnout rates converge between private sector and local public sector employees following retirement. Taken together, these patterns confirm that local public employees’ double motive as producers and consumers of public services induces them to turn out at higher rates during elections. Yet, estimated effect sizes are substantially smaller than are those suggested by previous cross-sectional studies. Clearly, however, we study only one country that has a number of distinctive features—such as its oil wealth, welfare-state size, gender equality, and work conditions in the public sector. While none of these elements is uniquely Norwegian, replication of our analysis in different settings—as well as explicitly comparative extensions to our research—would be required to verify the more general applicability of our results.
Supplementary Materials
To view supplementary material for this article, please visit http://doi.org/10.1017/S000305542100099X.
Data Availability Statement
Research documentation and/or data that support the findings of this study are openly available at the American Political Science Dataverse: https://doi.org/10.7910/DVN/O3DTSF.
Acknowledgments
We thank three anonymous referees, Øivin Kleven, and João Cancela for insightful comments on a previous version.
Funding Statement
This research was funded by Norwegian Research Council (grant 281191; PI Rune J. Sørensen) and FWO Vlaanderen (grant G.000218N; PI Benny Geys).
Conflict of Interest
The author declares no ethical issues or conflicts of interest in this research.
Ethical Standards
The author declares that the human-subjects research in this article was reviewed and approved by Statistics Norway (SSB) as part of our application for the microdata used in the analysis. The author affirms that this article adheres to the APSA’s Principles and Guidance on Human Subject Research.


 Open access