


Implications
By evaluating the individual factors contributing to lameness costs and summarizing previous lameness cost estimates, this review allows for a deeper understanding of the cost of lameness on an individual dairy farm. Producers can use this information to make better lameness treatment and management decisions. For researchers, we highlight many areas that more investigation is needed including lameness expenditure and loss estimates differentiated by disease, condition severity and timing of the disease within a lactation.
Introduction
Lameness is a prominent issue in the dairy industry. Adams et al. (Reference Adams, Lombard, Fossler, Román-Muñiz and Kopral2016) estimated 2014 lameness prevalence in US herds as 10%, whereas other studies have found lameness prevalence to reach as high as 55% (Von Keyserlingk et al., Reference Von Keyserlingk, Barrientos, Ito, Galo and Weary2012). Lameness is perceived by producers as one of the top three major health concerns in their herds, with the other two being mastitis and fertility (Leach et al., Reference Leach, Whay, Maggs, Barker, Paul, Bell and Main2010a). However, understanding of the actual cost of lameness is lacking. Leach et al. (Reference Leach, Whay, Maggs, Barker, Paul, Bell and Main2010a) found that producers cited lack of knowledge about lameness costs as one reason less effort was made to prevent lameness compared with mastitis. If producers estimate lameness costs as less than the cost of implementing lameness prevention and control strategies, those management practices are not likely to be adopted (Leach et al., Reference Leach, Whay, Maggs, Barker, Paul, Bell and Main2010a). This review aims to: (1) identify and discuss the individual factors contributing to total dairy cow lameness costs and (2) summarize previous estimates of total dairy cow lameness costs.
Calculating disease costs
McInerney et al. (Reference McInerney, Howe and Schepers1992) defined the total cost of disease as including two components: expenditures and losses. Expenditures focus on disease treatment and investment in prevention whereas losses are the indirect result of disease occurrence, including reduced milk production, reduced reproductive performance and other factors (McInerney et al., Reference McInerney, Howe and Schepers1992). Figure 1 categorizes common expenditures and losses associated with dairy cow lameness, as summarized in this review.
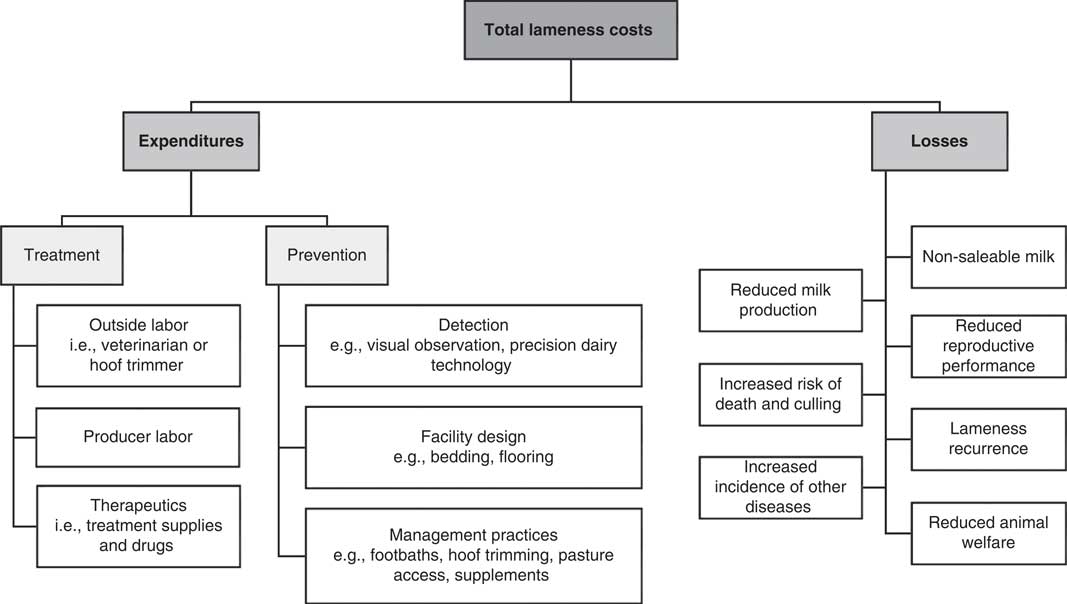
Figure 1 Categorization of expenditures and losses that contribute to the total cost of dairy cow lameness.
Given that numeric values change over time with inflation, this review focuses more on the contribution of each expenditure and loss category to total lameness costs rather than exact price estimates. However, the relative importance of different factors within a study depends on which factors were included in the total cost estimate. For example, treatment expenditures may contribute a large percentage of total lameness costs in a study where treatment, reduced milk production and reduced reproductive performance are the only factors included. In a different study where the increased risk of culling and control and prevention investments are also included, treatment will likely contribute a reduced percentage to the total cost. When dollar values are given, the originally reported value was converted to US dollars and adjusted for inflation to represent 2017 values.
Lameness expenditures
Two main types of disease expenditures exist: treatment expenditures and prevention expenditures (McInerney et al., Reference McInerney, Howe and Schepers1992). Treatment expenditures consist of labor and supplies necessary for treatment (i.e. therapeutics) which are generally reported as a price per case. These estimates for lameness would be most accurate via surveys of hoof trimmers, veterinarians and producers because they are the individuals charging and paying for them. However, very few large surveys asking for hoof trimmer, veterinary or producer perception of treatment expenditures associated with lameness, and especially specific lameness conditions, have been conducted. Prevention expenditures include inputs associated with any control or prevention strategy, including management strategies implemented for early detection. Prevention expenditures could also be thought of as investment expenditures because money is spent on prevention with the purpose of reducing total lameness costs (via reductions in lameness incidence). Detection and prevention expenditures are rarely included in calculations of the cost per case of lameness. Instead, these expenditures are typically, although incorrectly, classified as general management costs.
Labor for treatment
On-farm staff, hoof trimmers or veterinarians most frequently treat lameness. In a survey of 184 farms across the USA, 77% of farms used a professional hoof trimmer for hoof trimming services whereas 16% used a veterinarian or on-farm staff and 7% used no hoof trimming services at all (Adams et al., Reference Adams, Lombard, Fossler, Román-Muñiz and Kopral2016). Bruijnis et al. (Reference Bruijnis, Hogeveen and Stassen2010) estimated the likelihood of treatment by a producer, hoof trimmer or veterinarian for seven different lameness conditions, based on experiences in the Netherlands. According to their mathematical model, the probability of a lameness case resulting in labor by the dairy producer (i.e. pulling the cow out of the herd to examine or treat her) ranged from 20% of cases for interdigital dermatitis with heel erosion, sole hemorrhage or corns (interdigital hyperplasia) to 100% of cases for foot rot. The probability of treatment by a hoof trimmer for each lameness type ranged from 0% of cases for foot rot to 40% of cases for sole ulcers. The probability of a veterinarian visit for each lameness type was either 1% of cases (interdigital dermatitis with heel erosion, digital dermatitis, sole hemorrhage, white line disease or corns) or 5% of cases (foot rot or sole ulcer). The estimated involvement by a hoof trimmer or veterinarian may seem low but might result from the difficulty of bringing a hoof trimmer or veterinarian to the farm for every detected lameness case. In other words, only the cases that exist when hoof trimmers or veterinarians are already physically present are likely to be treated by them. When the hoof trimmer or veterinarian is not there and able to treat a case of lameness, lameness conditions that are difficult to treat (e.g. sole ulcers and white line disease) may be left untreated. For example, Horseman et al. (Reference Horseman, Whay, Huxley, Bell and Mason2013) found that if lame cows were only treated by a hoof trimmer or veterinarian (not on-farm staff) treatment could be delayed anywhere from 1 week to 1 month.
Table 1 includes seven different studies that calculated total lameness costs per case (both non-specific and condition-specific) and provided a breakdown of the costs contributed by at least six different expenditures or losses. Within these studies, the contribution of producer labor to total lameness cost estimates ranged from 2% to 16%, making it on average the seventh most important cost category of those evaluated. The contribution of outside labor (veterinarian or hoof trimmer fees) to total lameness cost estimates ranged from 1% to 43%, making it on average the fifth most important cost category of those evaluated. Some of the variations in these observations can be attributed to labor expenditures being dependent on the type of lameness with some treatments being more intensive than others. Kossaibati and Esslemont (Reference Kossaibati and Esslemont1997) surveyed 10 veterinarians in the UK about the cost of veterinary labor and found that sole ulcers resulted in the greatest labor charge per affected cow ($66), followed by digital lameness ($49) and interdigital lameness ($39). However, the percentage of the total cost attributed to veterinary labor was actually greatest for interdigital lesions (12%) and least for sole ulcers (6%). Sole ulcers are expected to have greater losses (e.g. reduced milk yield, reduced reproductive performance, increased culling risk) than infectious diseases because of their longer duration (Charfeddine and Pérez-Cabal, Reference Charfeddine and Pérez-Cabal2017); therefore, the percent of costs associated with labor is smaller. Charfeddine and Pérez-Cabal (Reference Charfeddine and Pérez-Cabal2017) surveyed Spanish hoof trimmers to estimate the total cost of three different lameness conditions while considering the severity of lameness as a factor. In mild lameness cases, they found that the condition with the greatest contribution of labor (including labor from both hoof trimmers and producers) to the total cost per case was digital dermatitis (49%), followed by white line disease (29%) and sole ulcers (25%). The opposite order was true for severe lesions (23%, 19%, and 15% for sole ulcers, white line disease and digital dermatitis, respectively). For all lameness conditions, the contribution of labor to total costs is less in severe cases compared with mild cases because of the increase in losses (e.g., increased the chance of culling, greater milk production reduction). Beyond lameness condition type, the location of the study could also influence the contribution of labor to total lameness costs. For example, involvement by veterinarians is more common, and even required for treatment, in some countries.
Table 1 Contribution of expenditure and loss categories to the total cost of dairy cow lameness across identified studies that included at least six contribution categories

1 Veterinarian or hoof trimmer fees.
2 NA=not provided.
Liang et al. (Reference Liang, Arnold, Stowe, Harmon and Bewley2017) surveyed 19 veterinarians and industry professionals and used their estimates to simulate both veterinary and producer labor costs associated with seven different diseases (mastitis, metritis, hyperketonemia, left displaced abomasum, retained placenta, lameness and hypocalcemia). Among all disease, the veterinary and producer labor costs associated with non-specific lameness were second highest only behind left displaced abomasum. Therefore, regardless of the percentage of total lameness costs attributed to labor, labor expenditures due to lameness are substantial compared with other diseases.
Therapeutics
Therapeutic expenditures include any medications or supplies used to treat diagnosed cases of lameness. Therapeutic expenditures vary greatly depending on the cause of lameness. For example, the standard treatment of non-infectious hoof lesions like sole ulcers and white line disease includes trimming and blocking the hoof to reduce weight bearing on the affected claw (Andrews et al., Reference Andrews, Blowey, Boyd and Eddy2008). Alternatively, digital dermatitis treatment often involves cleaning and topical application of antibiotics using a foot wrap. In addition to the type of lameness, the severity of lameness when treated can also influence therapeutic expenditures (Charfeddine and Pérez-Cabal, Reference Charfeddine and Pérez-Cabal2017). The farm’s hoof trimmer or veterinarian, depending on who is conducting the diagnosis and treatment of lameness cases, sets the prices associated with therapeutics.
Therapeutic expenditure estimates ranged from 2% to 37% of the total cost per case of lameness, making it on average the fourth most important cost category of those evaluated in Table 1. Excluding Liang et al. (Reference Liang, Arnold, Stowe, Harmon and Bewley2017), all therapeutic expenditure estimates included in Table 1 were 20% or less, with most being 10% or less. Liang et al. (Reference Liang, Arnold, Stowe, Harmon and Bewley2017) conducted a survey of veterinarians and other industry professionals to identify expected therapeutic expenditures. The considerable variation among respondents ($42±46), likely due to a small sample size (n=19), may have contributed to their difference in findings compared with other studies. The fact that this is the most recent of the studies may also have contributed to this finding. Liang et al. (Reference Liang, Arnold, Stowe, Harmon and Bewley2017) additionally found that therapeutic expenditures associated with lameness were second highest among common dairy diseases, only behind left displaced abomasum.
As expected, lameness conditions that require more supplies to treat had an increased contribution of therapeutics to total costs. Kossaibati and Esslemont (Reference Kossaibati and Esslemont1997) found that the cost of interdigital lesions was more dependent on therapeutics (8% of the total cost) than either the cost of digital lesions (5% of the total cost) or sole ulcers (4% of the total cost). Charfeddine and Pérez-Cabal (Reference Charfeddine and Pérez-Cabal2017) found that white line disease had the greatest contribution of therapeutics to the total cost per case (16% and 12% for mild and severe lesions, respectively). Second and third were sole ulcers (15% and 12% for mild and severe lesions, respectively) and digital dermatitis (7% and 4% for mild and severe lesions, respectively). Increased lameness severity was again associated with greater losses (reduced milk production, reduced reproductive performance, etc.), decreasing the therapeutics-associated total cost percentage.
Lameness detection
When done correctly, monitoring for the presence of disease can lead to detection at an early stage and allow for earlier treatment, potentially reducing expenditures and losses associated with that case. In addition, monitoring disease presence is important for recognizing a problem and identifying prevention practices that can reduce overall incidence of disease. Expenditures associated with lameness detection include labor for implementation and, in some cases, the cost of supplementary supplies or tools.
The simplest form of on-farm lameness detection is visual locomotion scoring. Van Nuffel et al. (Reference Van Nuffel, Zwertvaegher, Pluym, Van Weyenberg, Thorup, Pastell, Sonck and Saeys2015a) identified at least 25 different visual scoring systems for dairy cow lameness characteristics. They noted that although these methods are relatively easy to use and inexpensive to implement (i.e. the only expenditure is labor), the amount of time it takes to conduct scoring on an entire herd means they are not often executed. Another method of lameness detection is identification of lesions during routine visits by a hoof trimmer. Although no added expenditures are associated with this method, relying on it alone can result in missed lameness cases between hoof trimmings, leading to increased severity. This is an especially unreliable lameness detection method in the United States where Adams et al. (Reference Adams, Lombard, Fossler, Román-Muñiz and Kopral2016) reported that 7% of dairy herds never trim their cows, 20% only trim cows when they are visibly lame and 36% only trim once per lactation.
Recently, individual animal monitoring technologies have shown potential for lameness detection. Walk-over or stand-on load cells, pressure-sensitive position mats, vision techniques, accelerometers and other already available sensor data (e.g. milk production, activity, rumination time) have all been evaluated for the possibility of automated lameness detection (Van Nuffel et al., Reference Van Nuffel, Zwertvaegher, Van Weyenberg, Pastell, Thorup, Bahr, Sonck and Saeys2015b). The economic value of investing in an automated lameness detection system remains unquantified. One difficulty of identifying the value of automated lameness detection is determining what will be done when a lameness alert is given (Van Nuffel et al., Reference Van Nuffel, Zwertvaegher, Van Weyenberg, Pastell, Thorup, Bahr, Sonck and Saeys2015b). If a reason for the lameness alert is identified, treatment can occur and reduced severity of the condition is beneficial to the farm. However, if a reason for lameness is not found, the value of the early detection is negative instead of positive (i.e. labor was used to check the cow and evaluation of the hooves for a problem could result in hoof damage). One possibility is that the technology alert occurs before the lameness condition is visibly apparent (i.e. not a false alert, just early), but without an actionable response to that alert, it has no value. Regardless, the economic potential of automated estrus detection systems has been quantified (Rutten et al., Reference Rutten, Steeneveld, Inchaisri and Hogeveen2014; Dolecheck et al., Reference Dolecheck, Heersche and Bewley2016) and it stands to reason that some of these systems could additionally be used for lameness detection with minimal added expenditures (i.e. only labor for checking alerted cows).
Regardless of the available options, lameness diagnosis on dairy herds is generally not proactive. One reason for this may be that producers tend to underestimate the prevalence of lameness in their herds (Bell et al., Reference Bell, Main, Whay, Knowles, Bell and Webster2006; Espejo et al., Reference Espejo, Endres and Salfer2006; Leach et al., Reference Leach, Whay, Maggs, Barker, Paul, Bell and Main2010a). In addition, producers perceive lameness management to be more challenging to include in daily routines compared with other health issues, like mastitis, which can be managed in the parlor (Leach et al., Reference Leach, Whay, Maggs, Barker, Paul, Bell and Main2010a). Instead, lame cows are often only identified after they become severely lame (Mill and Ward, Reference Mill and Ward1994), completely ignoring mildly lame cows that would benefit most from early detection. Possibly, for this reason, no identified studies included an estimate for expenditures on lameness diagnosis or detection in their calculated total lameness cost. However, if detection and diagnosis are proactive, an accurate estimate of a herd’s total lameness cost should include the cost of proactive diagnostic measures.
Lameness control and prevention
Control and prevention strategies for reducing lameness incidence can be either repetitive actions, or one-time, long-term investments. Examples of repetitive investments include preventive hoof trimming (Fjeldaas et al., Reference Fjeldaas, Sogstad and Østerås2006), footbaths (Laven and Hunt, Reference Laven and Hunt2002), hoof health feed additives (Bergsten et al., Reference Bergsten, Greenough, Gay, Seymour and Gay2003) or even genetic selection (Pritchard et al., Reference Pritchard, Coffey, Mrode and Wall2013). An example of a long-term investment in lameness prevention would be the installation of rubber flooring (Vanegas et al., Reference Vanegas, Overton, Berry and Sischo2006) or the redesigning of poorly constructed freestalls (Ito et al., Reference Ito, Von Keyserlingk, LeBlanc and Weary2010). Expenditures associated with these different strategies might include labor, supplies and depreciation.
Although many of these strategies are lameness specific, some lameness control and prevention expenditures could overlap with control and prevention of other diseases. For example, updating old freestalls could improve more than just lameness incidence (e.g. reduced mastitis incidence, improved cow longevity). Therefore, identifying the proportion of prevention costs associated with a specific management change that should be attributed to lameness is essential for accurate total lameness cost estimates. The effects of most of these prevention and control strategies are not well studied and are difficult to quantify. Therefore, how best to account for these expenditures when estimating the total cost of lameness is unclear.
Very few estimates of total lameness costs include any allocation to prevention strategies. Kaneene and Hurd (Reference Kaneene and Hurd1990) surveyed 60 Michigan (USA) herds to find that, on average, $4/cow per year was spent on prevention of lameness as estimated by the producers. Among seven other diseases, lameness prevention costs ranked as the third greatest, only behind mastitis ($9/cow per year) and fertility problems ($7/cow per year). Miller and Dorn (Reference Miller and Dorn1990) estimated lameness prevention expenditures (including preventive trimming, veterinary services and labor) using data from 16 Ohio dairy farms (1 304 total cows) to be $2/cow per year. Prevention expenditures for lameness were greater than for hypocalcemia, displaced abomasum or dystocia, but less than mastitis, infertility, pneumonia or ‘other’ diseases. For both of these studies, prevention cost estimates focused on disease-specific costs rather than general management practices like nutrition and housing, likely resulting in underestimation of prevention costs for all diseases. In addition, these estimates of prevention expenditures were all reported as $/cow per year rather than $/case. Although prevention is generally paid in $/cow per year, producers should also consider how much they are spending on prevention per case to help determine if prevention expenditures are beneficial. For example, Bennett et al. (Reference Bennett, Christiansen and Clifton-Hadley1999) estimated expenditures on lameness prevention via hoof trimming in the UK to range from $6 to $12 per case of non-specific lameness (4% to 7% of total case costs, depending on the assumptions used in their model).
Ettema and Østergaard (Reference Ettema and Østergaard2006) estimated the value of five lameness prevention strategies (footbathing, rubber flooring, pasture access, trimming and biotin supplementation) using a stochastic Monte Carlo model. The model included reduced milk yield, reduced feed intake, weight loss, reduced conception rate and increased mortality as lameness outcomes. Assuming an average Danish dairy herd, all strategies increased the total profit margin per cow-year with rubber flooring providing the greatest increase ($9/cow-year) and footbathing providing the least increase ($2/cow-year). However, the cost associated with each prevention strategy was not included. Therefore, the increase in profit margin would only be realized if expenditures on the prevention strategy were less than the potential profit. The expenditures associated with implementation (including labor, supplies, etc.), the current herd prevalence of lameness, and the effectiveness of the prevention strategy would influence the overall value of each control and prevention strategy.
Lameness losses
Whereas expenditures involve increased costs, losses revolve around reduced returns. The three categories that most losses will fall under are reduced outputs, reduced output quality and animal welfare effects. In previous estimates, losses represent 37% to 93% of total lameness costs, outweighing the expenditures in most cases (Table 1).
Estimates of disease losses typically come from epidemiological or survey studies. Commonly, animals are observed over a defined period of time and comparisons (e.g. milk production, reproductive performance) are made between those cows that became lame and those cows that did not. Results between studies conducted this way can be difficult to compare for many reasons. First, the definition and identification of lameness are not always consistent. Whereas some studies use periodic visual lameness scoring to define lameness, others use lesion presence and still, others rely on farmer or veterinarian identified lameness cases. Second, the losses associated with a disease are specific to both the severity of disease and the timing of disease occurrence within the lactation, which depends on the disease definition and identification strategy. Studies using periodic visual lameness scoring will likely identify and treat cows before the time a producer generally would, resulting in an underestimation of lameness losses because of reduced lameness severity. On the contrary, cases defined by a farmer or veterinarian diagnosis will likely be more severe but may mean that mild lameness is entirely overlooked. Third, the potential confounding factors that studies account for can differ. Some of the losses associated with lameness, including reduced milk production and reduced reproductive performance, are related to many other factors (e.g. nutrition, other diseases) that need to be considered to accurately estimate losses associated with just lameness. This is different from expenditures, which are linked to a specific disease or condition.
Undoubtedly, other losses beyond those mentioned exist but are hard to define or difficult to quantify. Losses are discussed with emphasis on the general influence of lameness on the amount or quality of the product (e.g. milk production, days open) rather than the exact value of that amount because market values fluctuate greatly with farm location and time.
Non-saleable milk
Milk discarding is required after antibiotic treatment. Although antibiotic use is common for mastitis cases (Rollin et al., Reference Rollin, Dhuyvetter and Overton2015), most lameness cases do not require antibiotics, resulting in no discarded milk. Stricter antibiotic use guidelines worldwide could further reduce discarded milk associated with lameness and other diseases. Non-saleable milk loss estimates were consistent between the studies identified, ranging from 1% to 11% of the total cost per case of non-severe lameness, making it on average the least important cost category of those evaluated in Table 1.
Lameness treatments including antibiotic use are more common when lesions are severe. Charfeddine and Pérez-Cabal (Reference Charfeddine and Pérez-Cabal2017) found in their survey that no antibiotics, and therefore no resulting discarded milk, were needed for mild lesions. However, survey respondents did use antibiotics for severe lesions, resulting in some discarded milk (258, 331 and 312 kg/treatment for severe digital dermatitis, sole ulcer and white line disease, respectively). They estimated that milk withholding represented the second most important cost for severe lesions (24%, 20% and 20% of the total costs associated with a cow affected by severe digital dermatitis, severe sole ulcers and severe white line disease, respectively). The specific dollar value of discarded milk is dependent on the milk market where a herd is located and the potential alternative uses of that milk (i.e. feeding discarded milk to calves).
Reduced milk production
Lameness influences milk production via many different and interrelated factors. Huxley (Reference Huxley2013) summarized previous studies that estimated a milk yield loss of 270 to 574 kg/lactation when lameness occurred. Evidence exists that this milk loss occurs during not only clinical lameness but also pre-diagnosis and post-recovery depending on lameness type (Green et al., Reference Green, Hedges, Schukken, Blowey and Packington2002; Amory et al., Reference Amory, Barker, Wright, Mason, Blowey and Green2008; Charfeddine and Pérez-Cabal, Reference Charfeddine and Pérez-Cabal2017). Because of this, the point in lactation that a lameness case occurs will influence the total milk loss associated with the incidence of the disease (i.e. milk loss may continue until the end of the lactation). The relationship between lameness and milk production is two-fold. Although lameness incidence decreases milk production, increased milk production is also a risk factor for lameness (Barkema et al., Reference Barkema, Westrik, Van Keulen, Schukken and Brand1994; Green et al., Reference Green, Hedges, Schukken, Blowey and Packington2002; Amory et al., Reference Amory, Barker, Wright, Mason, Blowey and Green2008). Barkema et al. (Reference Barkema, Westrik, Van Keulen, Schukken and Brand1994) estimated that for every 100 kg increase in milk production during the first 100 days in milk of the previous lactation, cows experienced a 1.1 times greater chance of lameness in the current lactation. Therefore, the effect of lameness incidence on milk production may lead to some high producing cows becoming average producing cows rather than average producing cows becoming low producing cows.
The exact dollar value of reduced milk production is dependent on the estimated yield reduction, the value of milk (milk price plus bonuses), and the change in feed costs (Charfeddine and Pérez-Cabal, Reference Charfeddine and Pérez-Cabal2017). Because this milk is never produced, as compared with discarded milk, the feed costs savings are especially important to account for. Reduced milk production expenditure estimates have ranged from 9% to 39% of the total cost per case of lameness, making it on average the third most important cost category of those evaluated in Table 1. Variation in the percentage of total lameness costs contributed to reduced milk production may result from some studies considering higher yielding cows to be more susceptible to lameness whereas others did not.
Lameness condition type also influences observed reduced milk production. Charfeddine and Pérez-Cabal (Reference Charfeddine and Pérez-Cabal2017) estimated reduced milk production to contribute between 13% and 18% to total costs per case for mild and severe digital dermatitis, sole ulcers and white line disease. The only exception was an increased percentage (34%) for mild digital dermatitis cases because their shorter duration resulted in reduced expenditures and other losses. Cha et al. (Reference Cha, Hertl, Bar and Gröhn2010) estimated reduced milk production to represent 27% of total costs per case for both digital dermatitis and foot rot and an even greater amount (38% of the total case cost) for sole ulcers. The increased percentages of total cost attributed to reduced milk production reported by Cha et al. (Reference Cha, Hertl, Bar and Gröhn2010) were likely the result of only three factors being included in their estimates: treatment, reduced milk production and reduced reproductive performance.
Reduced reproductive performance
Traditionally, lameness has been thought to reduce reproductive performance via decreased estrus detection (Lucey et al., Reference Lucey, Rowlands and Russell1986). However, Collick et al. (Reference Collick, Ward and Dobson1989) noted that overall days open was affected by lameness more than the time to the first service, suggesting that reduced estrus detection may not be the only factor contributing to poor reproductive performance in lame cows. Recently, hormone profiles of lame cows have been studied to further define the relationship between lameness and reproductive performance (Walker et al., Reference Walker, Smith, Jones, Routly and Dobson2008; Sood et al., Reference Sood, Singh Nanda and Singh2009; Morris et al., Reference Morris, Kaneko, Walker, Jones, Routly, Smith and Dobson2011). The exact physiological mechanism by which lameness affects reproductive performance remains undefined but is likely a combination of multiple factors.
Huxley (Reference Huxley2013) provided a summary of studies that considered the effect of lameness on reproductive performance. In the reported papers, lameness resulted in a mean 7 days longer time to the first service, 30 days increase in days open, 20% lesser conception rate and 1.2 more services per conception. The exact value of these adverse effects depends on the cost of a day open or the value of a pregnancy. Both of these are herd specific, making an estimate of the economic influence of lameness on reproduction difficult. A critical contributor to the extent of reduced reproductive performance resulting from lameness is the timing of the disease (Lucey et al., Reference Lucey, Rowlands and Russell1986). If lameness occurs in later lactation, after pregnancy establishment, its effect on reproduction will likely be lesser than if the occurrence is before first breeding. However, the effect of late lactation lameness on the next lactation has not been thoroughly explored.
The reported percentage of total lameness costs attributed to reduced reproductive efficiency ranged from 0% to 48%, making it on average the second most important cost category of those evaluated in Table 1. Parity contributed to some of the variation observed. Liang et al. (Reference Liang, Arnold, Stowe, Harmon and Bewley2017) found that reproductive losses represented 3% and 25% of the total costs per case for primiparous and multiparous cows, respectively, noting that unique market conditions assumed in their study resulted in deviations from the previous cost of days open estimates. On the other extreme, both Kossaibati and Esslemont (Reference Kossaibati and Esslemont1997) and Esslemont (Reference Esslemont2005) estimated the greatest percentage of total lameness costs attributed to reduced reproductive performance (42% and 48%, respectively) when considering interdigital lameness. The actual effect (in days open) of interdigital lameness on reproductive performance was assumed less than a sole ulcer in the same studies, but because interdigital lameness was assumed to have no effect on culling, the percentage of the total cost per case attributed to reduced reproductive performance was greater.
As with expenditures and other losses, the type of lameness also influences the value of reduced reproductive performance. Cha et al. (Reference Cha, Hertl, Bar and Gröhn2010) found that although the percentage of costs attributable to reduced reproductive performance was similar between sole ulcers (33%) and digital dermatitis (31%), that percentage was greater (45%) in foot rot cases partially because of relatively lesser treatment costs for foot rot. However, Charfeddine and Pérez-Cabal (Reference Charfeddine and Pérez-Cabal2017) found a lesser percentage of costs attributable to reduced reproductive performance with only around 3% for severe digital dermatitis and white line disease ($12 and $19, respectively), but 6% for severe sole ulcers ($38). Their lesser contribution of costs to reduced reproductive performance can be attributed to the reduced effects of lameness on days open in their study compared with those summarized by Huxley (Reference Huxley2013).
Increased death and culling
Relatively few animals die as a direct result of lameness. However, welfare standards requiring cows to be ambulatory to enter a slaughter facility result in euthanasia of some lame cows on-farm rather than them being sold as cull cows. Thomsen et al. (Reference Thomsen, Kjeldsen, Sørensen and Houe2004) found in interviews with Danish producers that although only 2% of unassisted deaths were attributed to lameness, 40% of euthanized cases were. The United States Department of Agriculture (USDA) (2007) National Animal Health Monitoring System Dairy Survey reported that 20% of US dairy cow deaths resulted from euthanasia after either lameness or injury. McConnel et al. (Reference McConnel, Lombard, Wagner, Kopral and Garry2015), utilizing the same data, noted a relationship between lameness and mortality where mortality was predicted to increase by 0.8% for every 1% increase in the proportion of lame cows. However, this could be a result of lameness causing other diseases to occur which are ultimately the cause of euthanasia rather than lameness itself.
The exact percent of lameness cases that result in death remains mostly undefined in the literature. Based on previous veterinary experience in the US, Guard (Reference Guard2008) estimated that 2% of lame cows become disabled to the point that they are not accepted for slaughter. However, this anecdotal estimate may be more accurate for herds before the strict non-ambulatory guidelines put into place in the US in 2004. Regardless, for any lameness cases that do result in euthanasia, the cost to the producer is the same as a dead cow plus the cost of euthanasia (captive bolt, gunshot, veterinarian, etc.) and the emotional toll that does not have a well-defined value.
Alternatively, the effect of lameness on culling has been extensively explored with the general conclusion being that lameness incidence decreases the productive life of a dairy cow (Huxley, Reference Huxley2013). Charfeddine and Pérez-Cabal (Reference Charfeddine and Pérez-Cabal2017) found that incidence of either sole ulcer or white line disease decreased the length of productive life between 35 and 71 days compared with unaffected animals. No significant effect of digital dermatitis on the length of productive life was found. Similarly, Cramer et al. (Reference Cramer, Lissemore, Guard, Leslie and Kelton2009) identified no effect of infectious lameness (foot rot, digital dermatitis and heel horn erosion) on culling. In studies where culling has not been found to be affected by non-infectious lameness this is rationalized because the cows that are more susceptible to culling are also the superior producing cows and, therefore, they are not viewed by producers as uneconomical (Barkema et al., Reference Barkema, Westrik, Van Keulen, Schukken and Brand1994; Archer et al., Reference Archer, Green and Huxley2010). In addition, cows might be recorded as leaving the herd for low production or reproductive failure when lameness was the root cause of removal (Guard, Reference Guard2008). This emphasizes the importance of disease incidence recording and the proper identification of culling reason to be able to accurately estimate the effects of different diseases on culling.
Estimates for losses associated with an increased risk of culling or death ranged from 0% to 50% of the total cost per case of lameness, making it on average the most important cost category of those evaluated in Table 1. The extremely low values (0%) were only found in estimates for interdigital lameness, with most estimates falling between 20% and 40%. Charfeddine and Pérez-Cabal (Reference Charfeddine and Pérez-Cabal2017) found that premature culling was the greatest contributor to the cost of a case of mild or severe sole ulcers or white line disease and severe digital dermatitis (23% to 40%). The contribution of culling costs to the cost of mild digital dermatitis was less (10%). Liang et al. (Reference Liang, Arnold, Stowe, Harmon and Bewley2017) found parity to have little effect on the portion of total lameness costs attributable to culling which accounted for 14% and 16% in primiparous and multiparous cows, respectively.
The cost of culling depends greatly on how culling is calculated. Basic culling costs can be calculated as the cost of a replacement minus the slaughter value of the cull cow. However, this method only accounts for the financial cost of culling, ignoring the economic costs (Bewley et al., Reference Bewley, Boehlje, Gray, Hogeveen, Kenyon, Eicher and Schutz2010). More complex and thorough methods, like retention pay-off, are better for capturing the difference between the potential future value of a cow and the potential future value of her replacement (Groenendaal et al., Reference Groenendaal, Galligan and Mulder2004) and should be used for disease culling cost estimates.
Disease relationships and recurrence
Relationships between diseases are complex and not well defined. When lame and non-lame cows have been compared, similar percentages of common diseases (retained placenta, metritis, hypocalcemia, left displaced abomasum and dystocia) have been found (Melendez et al., Reference Melendez, Bartolome, Archbald and Donovan2003; Booth et al., Reference Booth, Warnick, Gröhn, Maizon, Guard and Janssen2004; Hernandez et al., Reference Hernandez, Garbarino, Shearer, Risco and Thatcher2005). Contradicting results exist for hyperketonemia, potentially because of the method of comparison and definitions of hyperketonemia used. Peeler et al. (Reference Peeler, Otte and Esslemont1994) noted that both dystocia and mastitis increased the risk of lameness pre-breeding (odds ratios=1.5 and 1.5, respectively), whereas lameness incidence itself increased the risk of mastitis (odds ratio=1.4). However, other studies have found no link between lameness and mastitis (Melendez et al., Reference Melendez, Bartolome, Archbald and Donovan2003; Booth et al., Reference Booth, Warnick, Gröhn, Maizon, Guard and Janssen2004; Hernandez et al., Reference Hernandez, Garbarino, Shearer, Risco and Thatcher2005). Another investigated relationship that could be related to the reduced reproductive performance of lame cows is the connection between ovarian cysts and lameness. Melendez et al. (Reference Melendez, Bartolome, Archbald and Donovan2003) found that the odds of a lame cow having an ovarian cyst were 2.63 times greater than the odds of a non-lame cow. However, given that this was an observational study only, it cannot be concluded that a cause-effect relationship exists.
In situations where lameness is directly responsible for changing the incidence of other diseases, the expenditures and losses associated with those diseases should be included in total lameness costs. Alternatively, if a lameness case is the result of another disease, costs associated with that case should not be considered as contributing to total lameness costs. Very few total lameness cost estimates have even attempted to account for this source of loss. When estimating total lameness costs, Enting et al. (Reference Enting, Kooij, Dijkhuizen, Huirne and Noordhuizen-Stassen1997) did account for relationships between lameness and other diseases, finding that the contribution of other diseases to total lameness costs (i.e. costs associated with other diseases resulting from lameness) was minimal (1% of total lameness costs).
Not only is the relationship between lameness and other diseases important, but also the potential for lameness recurrence. Costs associated with recurring cases should be considered as part of the total cost of the original case, rather than separately. In previous lameness cost estimates, some studies assume lame cows undergo costs associated with 1.4 cases because of recurrence rates (Kossaibati and Esslemont, Reference Kossaibati and Esslemont1997 and Reference Esslemont2005; Ettema and Østergaard, Reference Ettema and Østergaard2006). Using this assumption, Esslemont (Reference Esslemont2005) found that repeat case costs were 3%, 7% and 3% of total lameness costs per cow affected by digital, interdigital, and sole ulcer conditions, respectively. However, the recurrence rate of 1.4 appears to be an assumption made by these authors rather than supported by published literature. More recently, Charfeddine and Pérez-Cabal (Reference Charfeddine and Pérez-Cabal2017) recorded relapse rates on 804 Spanish farms, finding a range of 2.0 to 3.1 relapses per case depending on lameness condition and parity. However, accurate recurrence rate estimates alone do not answer the question of how much extra cost is attributed to repeat cases. Although recurrence does incur additional costs, those costs are likely not as great as the original case (i.e. total lameness costs do not double with recurrence). Because data is lacking to know how to handle this, some disease models have assumed that recurring disease cases only increase direct costs (labor, therapeutics, and non-saleable milk) and have no influence on indirect costs (milk loss, reproductive performance, culling, etc.; Kossaibati and Esslemont, Reference Kossaibati and Esslemont1997, Rollin et al., Reference Rollin, Dhuyvetter and Overton2015) . Estimates for losses associated with lameness case recurrence ranged from 3% to 14% of the total cost per case of lameness, making it on average the sixth most important cost category of those evaluated in Table 1.
Until we have a better understanding of relationships between other diseases and lameness, lameness recurrence rates and lameness recurrence costs, estimating the economic losses associated with these factors is difficult. Regardless, acknowledging these factors highlights that current estimates may not be accounting for every economic loss associated with lameness.
Reduced animal welfare
Often, diagnosis of lameness does not occur until the cow is obviously limping (Mill and Ward, Reference Mill and Ward1994), indicating a high level of pain (Whay et al., Reference Whay, Waterman, Webster and O’Brien1998). In surveys, producers have acknowledged the link between lameness and cow pain and suffering (Mill and Ward, Reference Mill and Ward1994; Leach et al., Reference Leach, Whay, Maggs, Barker, Paul, Bell and Main2010b), but they do not always acknowledge a cost associated with pain and suffering. As previously mentioned, the fact that lame cows might also be the highest yielding cows may influence a producer’s view on the welfare effects of the disease. In reality, the pain and suffering associated with lameness have at least two economic consequences.
First, some of the previously mentioned losses associated with lameness (i.e. reduced milk production, reduced reproductive performance) are likely a result of responses to pain and suffering. For example, lame cows tend to spend less time feeding (González et al., Reference González, Tolkamp, Coffey, Ferret and Kyriazakis2008) potentially because they spend more time lying down to relieve pressure from their feet (Ito et al., Reference Ito, Von Keyserlingk, LeBlanc and Weary2010). The result is reduced milk production and economic losses. The association between lameness and reduced reproductive performance might also be related to increased cortisol levels (caused by pain and stress that the animal is experiencing from lameness) affecting hormone function (Dobson and Smith, Reference Dobson and Smith2000). In these cases, the economic losses associated with pain and suffering during lameness are already accounted for within other loss categories.
The second economic consequence of poor animal welfare (i.e. pain and suffering) is the potential to influence consumer perception. McInerney (Reference McInerney1996) pointed out that one mistake farmers make is assuming lameness costs occur only at the farm level. Recently, Leach et al. (Reference Leach, Whay, Maggs, Barker, Paul, Bell and Main2010b) found that this view may be changing. In all, 72% of surveyed UK dairy farms ranked the desire for a good public image as a ‘very’ or ‘extremely’ important factor contributing to lameness control. However, 35% of those farmers still felt the risk of lame cows influencing farm accreditation was of ‘very little’ or ‘no’ importance.
In reality, consumer perception of the quality of life of our livestock animals could someday result in economic consequences. If consumers lose faith in the production process of a product and reduce their consumption, the market for that product could be affected. This may result in indirect economic consequences to the farmer (i.e. a smaller milk market) or direct consequences in the form of new rules and regulations that dictate the amount of lameness that can be present on a farm or protocols for handling lameness cases. For example, Version 3 of the US Farmers Assuring Responsible Management program sets the expectation that 95% of the cows on each evaluated dairy will score a 2 or less for lameness (on a 1 to 3 scale; National Milk Producers Federation (NMPF), 2016). Lameness is a critical component in farm welfare audits around the world and producers will be (or already are) required to follow set guidelines to sell their milk. To date, no economic estimates of the total cost of lameness have included animal welfare.
Total lameness costs
Total lameness cost estimates
Previously reported total lameness cost estimates (expenditures+losses), adjusted to 2017 US dollar values, are listed in Table 2 along with which factors each cost estimate included. None of the identified studies considered expenditures associated with lameness detection or losses associated with animal welfare when calculating total lameness costs, pinpointing these two cost factors as requiring further research to estimate. Very rarely were costs associated with lameness control or prevention, interactions with other diseases or lameness recurrence included. The few studies that did consider these factors were studies mostly conducted in 2006 or earlier. Although this seems counterintuitive, one possibility is that authors of more recent estimates purposely avoided including these factors because they understand the difficulty in accurately accounting for them. In addition, some of these factors may be difficult to calculate at the case level rather than the herd level (e.g. lameness detection and control or prevention strategies). Factors considered in all or nearly all of the identified studies included labor for treatment (both producer and veterinary), therapeutics, non-saleable milk, reduced milk production, reduced reproductive performance and an increased risk of culling.
Table 2 Detailed summary of published research estimates of total dairy cow lameness costs, including lameness definition used, estimation method and expenditure and loss categories accounted for within the estimates

L=producer labor; V=veterinary or hoof trimmer labor; T=therapeutics; D=lameness detection; P=lameness control and prevention; N=non-saleable milk; M=reduced milk production; F=reduced reproductive performance; C=increased risk of culling; X=increased risk of death; O=relationships with other diseases; R=recurrence of lameness; W=animal welfare.
1 All foreign cost estimates were adjusted from the value reported to US dollars using the mean exchange rate for the year of publication.
2 All costs were adjusted for inflation from the year of publication to 2017.
For each study in Table 2, cost estimates were calculated as either the cost per cow per year or the cost per case. In studies where the cost per cow per year was calculated, lameness costs were spread across all animals in the herd, regardless of which cows experienced the disease. The resulting cost is highly dependent on the individual farm size and the prevalence of lameness in the herd. For this reason, the cost per case is preferred. Estimates of the cost per case of non-specific lameness ranged from $76 to $533, depending on the location of the study, the calculation method used and the expenditures and losses that were selected for inclusion (Table 2). Liang et al. (Reference Liang, Arnold, Stowe, Harmon and Bewley2017) estimated that this total cost per case of non-specific lameness was less than a case of mastitis or displaced abomasum, but more than a case of metritis retained placenta, ketosis or hypocalcemia. Although more useful than costs per cow per year, these non-specific lameness total cost estimates assume all lameness to be identical.
Often, different lameness disease conditions have been classified into categories and costs are evaluated based on those lameness categories. The most commonly used categories include interdigital disease, digital disease and sole ulcers (Esslemont and Peeler, Reference Esslemont and Peeler1993; Kossaibati and Esslemont, Reference Kossaibati and Esslemont1997; Esslemont, Reference Esslemont2005; Willshire and Bell, Reference Willshire and Bell2009). Among these, sole ulcers are estimated as having the greatest total costs ranging from $232 to $1 073 per case or affected cow (thereby accounting for recurrence), depending on the location of the study, the calculation method used, and the expenditures and losses that were selected for inclusion (Table 2). Recently, the total costs of specific lameness conditions have been further explored. Willshire and Bell (Reference Willshire and Bell2009) added estimates for digital dermatitis and white line disease in addition to the aforementioned general categories. Cha et al. (Reference Cha, Hertl, Bar and Gröhn2010) and Charfeddine and Pérez-Cabal (Reference Charfeddine and Pérez-Cabal2017) both looked at the total costs associated with digital dermatitis and sole ulcers whereas Charfeddine and Pérez-Cabal (Reference Charfeddine and Pérez-Cabal2017) alone looked at white line disease and Cha et al. (Reference Cha, Hertl, Bar and Gröhn2010) alone looked at foot rot. Based on these limited studies, digital dermatitis appears to have the least total costs of the evaluated conditions whereas sole ulcers have the greatest total costs (Table 2). Charfeddine and Pérez-Cabal (Reference Charfeddine and Pérez-Cabal2017) noted that digital dermatitis generated overall lesser costs than non-infectious disorders mainly because of the reduced length of time the disease affected the animal, resulting in reduced treatment, labor, discarded milk and milk loss; however, none of the studies considered the possibility of digital dermatitis or other infectious diseases transmitting to other animals. The importance of looking at total lameness costs specific to disease type was emphasized by Cha et al. (Reference Cha, Hertl, Bar and Gröhn2010) who noted that the top cost contributors differed by disease. Milk loss contributed the most to the total cost of sole ulcers (38%), treatment was the greatest contributor to the total cost of digital dermatitis (42%), and decreased fertility was the greatest contributor to the total cost of foot rot (50%).
Accuracy of total lameness costs
Although condition-specific lameness costs are an improvement over non-specific cost estimates, these estimates are still highly dependent on the assumptions used in the model. In reality, the cost of lameness conditions varies by herd, cow and lameness case characteristics. At the herd level, variation in market prices and management styles will affect lameness incidence, treatment and recovery. At the cow level, the cost of a case of lameness depends on an individual cow’s milk production potential, pregnancy status and age (Cha et al., Reference Cha, Hertl, Bar and Gröhn2010). Finally, characteristics of the lameness case beyond disease type, including the point in lactation when a cow becomes lame and the severity of the lameness condition, will affect total lameness costs (Cha et al., Reference Cha, Hertl, Bar and Gröhn2010; Charfeddine and Pérez-Cabal, Reference Charfeddine and Pérez-Cabal2017). Of all these influential factors, only the severity of the lameness condition has been considered in any lameness cost estimates and only once by Charfeddine and Pérez-Cabal (Reference Charfeddine and Pérez-Cabal2017). They found that although severe lesions were less common, their cost was almost three times greater than the cost of mild lesions because of their effect on the cow’s longevity. The ideal scenario would be to provide decision support tools that could use herd, cow and case-specific information to help a producer determine the best individual treatment and culling strategies whenever a cow became lame.
Beyond the definition of lameness used in an economic analysis (i.e., overall, disease type or cow-specific) the accuracy of these estimates depends on many factors. First, the correct expenditures and losses for a disease need to be included in the model. Our understanding of lameness and all of the factors associated with it continues to develop, as emphasized by the variation in factors included in the fourteen studies in Table 2. Likely, past estimates excluded some critical factors and current estimates are still missing factors we have yet to consider.
Even if researchers agreed on which expenditures and losses to include, this does not completely solve the problem. The reliability of cost estimates depends on the accuracy, availability and reliability of the empirical data used to create them (Dijkhuizen et al., Reference Dijkhuizen, Huirne and Jalvingh1995). Estimates for some of the factors are lacking (e.g. the expenditures associated with detection and the losses associated with animal welfare issues). In addition, most existing estimates for losses associated with lameness were generated from data sets where lameness was defined by a lameness or gait score rather than by the presence or absence of specific conditions. Therefore, the ability to generate further condition-specific lameness cost estimates is limited until this data exists. Recently, Charfeddine and Pérez-Cabal (Reference Charfeddine and Pérez-Cabal2017) used a data set containing over 108,000 records to estimate the effect of three specific claw disorders (digital dermatitis, sole ulcer and white line disease) on milk production, fertility performance and longevity. More studies of this nature and studies including additional lameness disease types, severity and timing of occurrence would be valuable for improving total lameness cost estimates.
Conclusions
Accurate calculations of total lameness costs should include numerous expenditures and losses. Most of these require further empirical research to precisely define, especially with regard to specific lameness disease types, severity level, and the stage of lactation at the occurrence. Total lameness costs are also influenced by many herd- and cow- specific factors. Regardless of the limitations of current lameness cost estimates, having an understanding of the components of total lameness costs can help to guide future research and to identify the potential effect of control and prevention strategies, leading to more proactive decision making and management.
Acknowledgments
The authors appreciate the financial support provided by Elanco Animal Health (Greenfield, IN) to complete this research.
Declaration of interest
None.
Ethics statement
None.
Software and data repository resources
None.


 Open access