


Introduction
Despite the importance of Patagonian glaciers from scientific, economic and global-change perspectives, fundamental glaciological data were still remarkably limited until recently (Reference Warren and SugdenWarren and Sugden, 1993). In particular, calving dynamics were overlooked prior to the 1990s, but have been the focus of much recent work (Reference Warren and AniyaWarren and Aniya, 1999; Reference Naruse and SkvarcaNaruse and Skvarca, 2000; Reference Warren, Benn, Winchester and HarrisonWarren and others, 2001). Several of the temperate outlet glaciers which drain the eastern flank of Hielo Patagónico Sur (HPS; southern Patagonia icefield) calve profusely into large, deep proglacial lakes. Among the largest HPS outlets is Glaciar Upsala, 60 km long and covering 902 km2 (Reference Aniya, Sato, Naruse, Skvarca and CasassaAniya and others, 1997). The lower glacier divides into two termini. The larger, western terminus (Upsala West terminus (UWT)) calves into Brazo Upsala, the northernmost arm of Lago Argentino, and the eastern terminus (Upsala East terminus (UET)) into Lago Guillermo (Fig. 1 and 2). The glacier has been retreating rapidly since the early 1980s. Large recessions of UWT occurred during the periods 1981–84 (Reference Aniya and SkvarcaAniya and Skvarca, 1992),1990–93 (Reference Skvarca, Satow, Naruse and LeivaSkvarca and others, 1995b) and in mid-1994 (Reference Skvarca, Rott and NaglerSkvarca and others, 1995a; Reference Naruse, Skvarca and TakeuchiNaruse and others, 1997). UETalso retreated rapidly during the 1980s and 1990s (Reference Warren, Greene and GlasserWarren and others, 1995). Retreat rates of UWT declined somewhat after 1994, only to accelerate again in the late 1990s (Reference Aniya, Dhakal, Park and NaruseAniya and others, 2000; Reference Naruse and SkvarcaNaruse and Skvarca, 2000).

Fig. 1. Map of the central portion of HPS showing the drainage basins of Glaciares Upsala, Moreno and Ameghino in darker gray (after Reference Aniya, Sato, Naruse, Skvarca and CasassaAniya and others, 1997).

Fig. 2. Section of a Landsat TM image of 17 March 1997, showing the lower part of Glaciar Upsala with the western terminus (UWT) calving into Brazo Upsala (BU) of Lago Argentino, and the eastern terminus (UET) into Lago Guillermo (LG). Note the large amount of broken ice in front of UWT, the product of a major calving episode a few days earlier. Image provided by courtesy of Comisión Nacional de Investigaciones Espaciales (CONAE), Argentina.
The drastic recession has been accompanied by rapid thinning which averaged 11 ma–1 between 1990 and 1993 (Reference Skvarca, Satow, Naruse and LeivaSkvarca and others, 1995b). This large thinning rate is partly explained by regional warming and partly by the reduction of back-stress as a consequence of glacier retreat (Reference Naruse, Skvarca and TakeuchiNaruse and others, 1997). The first estimates of calving fluxes for UWT, based on a simple mass-balancemodel, were given by Reference Naruse, Aniya, Skvarca and CasassaNaruse and others (1995). Reference Warren, Greene and GlasserWarren and others (1995) investigated calving dynamics at UET and presented an improved calving-rate/water-depth (Vc/Hw) relationship for calving rates in fresh water. The new ratio was derived by combining new data from Patagonia with existing data from other regions collated by Reference Funk and RöthlisbergerFunk and Röthlisberger (1989). Reference Naruse and SkvarcaNaruse and Skvarca (2000) recently concluded that the fluctuations of UWT’s western section during the 1980s were strongly controlled by lake topography, and that the termini of temperate glaciers can float. Reference Warren, Benn, Winchester and HarrisonWarren and others (2001) came to similar conclusions for Glaciar Nef, located in Hielo Patagónico Norte (northern Patagonia icefield.
This paper presents detailed monitoring and analysis of UWT’s recession from 1996 to 2000, based on optical and radar images and global positioning system (GPS) field measurements. We also present the first systematic bathymetic survey of Brazo Upsala, carried out in late 1998 and 1999 in the region of recent glacier retreat. In addition, ice-proximal water depths were measured at nearby Glaciar Moreno (Fig.1).On the basis of recently derived calving rates and lake bathymetry, a refined Vc/Hw relationship is proposed. These data mostly consist of high calving rates in deep water; lack of such data has hitherto hindered attempts to derive a robust Vc/Hw relationship for fresh water (Reference Funk and RöthlisbergerFunk and Röthlisberger, 1989; Reference Warren, Greene and GlasserWarren and others, 1995).
Data Sources And Methodology
Areal change and rate of change in position of UWT front (dL/dt)
The rate of change of UWT from the end of 1996 to mid-2000 (3.52 years) was measured using ten satellite images combined with GPS field survey. Optical images of the persistently cloud-covered Patagonian icefields are very scarce, but a comparatively large number of sequential Landsat Thematic Mapper (TM) images have become available since 1997 with the establishment of a ground receiving station in Córdoba, Argentina. For the present work the available dataset consists of Landsat TM images acquired on 14 January 1986, 17 March1997 (Fig. 2), 21 April, 8 June and 12 September 1998, 23 March, 24 April and 18 November 1999 and 13 June 2000, and RADARSAT images of 22 January and 4 May 1997. Due to the lay-over effect in radar images in regions of high relief, the ice front may be partially obscured (see position 2, Fig. 7, shown later). In addition, two differential GPS field surveys carried out in December 1996 and April 2000 complement the remotely sensed dataset. The solar elevation angle of Landsat TM images varies from 7˚ in winter to a maximumof 46˚ in late spring. Shadows in low-angle images make the separation of ice–rock boundaries difficult. In this case, however, the shadow helps to discriminate between the east–west-orientated ice front and dense brash ice and icebergs in Brazo Upsala. In addition, the shadow projection in the winter image of 8 June 1998 reveals a very high variability in the height of the ice cliff (Fig. 3). For image analysis, band 4 (near-infrared) was selected because it allows good discrimination of glacier surface features.

Fig. 3. Section of Landsat TM image of 8 June 1998 (band 4).Note highly irregular height of the ice cliffacross the glacier front, revealed by shadow projection over brash ice due to the low-incidence sun elevation angle in winter.
The Landsat TM image of 17 March 1997 (Fig. 2) was used for image co-registration. This reference image was georeferenced to the World Geodetic System 1984 ellipsoid (Universal Transverse Mercator zone 18 F) bymeans of shorelines and other conspicuous and stable features mapped in the field with kinematic differential GPS. All GPS field surveys are tied to the Argentine geodetic network Posiciones Geodésicas Argentinas (POSGAR). All other images were co-registered to the reference imageusing a second-order polynomial fit, fixed to over 25 tie points selected on each image. The resulting rms error obtained for each image was less than a single pixel. Image analyses and interpretation were performed with standard PCI Geomatics software packages. After the compilation of the complete database the terminus positions were manually delineated. The total error made in delineating two succesive ice fronts on TM images is estimated at ±42m (Reference Williams, Hall, Sigurðsson and ChienWilliams and others, 1997).
Bathymetric survey
Bathymetric surveys of Brazo Upsala, covering the section exposed by recent glacier retreat, were carried out in December 1998 and 1999 using a 24V hydrographic echo sounder (ECHOTRAC DF 3200 MK II) operated from an inflatable boat. The instrument depth range is 7.5–6000m and the accuracy given by the manufacturer is 0.042% of the depth. The echo sounder was connected to a GPS, which recorded depth data at 5 s time intervals; continuous echoes at each second were simultaneously recorded on thermal paper. Positional accuracy in 1998 is estimated to be ±100m, while the measurements carried out in 1999 (about 90% of the map) were positioned by means of kinematic differential GPS, yielding a sub-metre accuracy. The region between the islands and the ice front was systematically surveyed only in 1999 due to adverse weather and ice conditions in 1998. The bathymetric datawere plotted onto the Landsat TM image of 13 June 2000 (Fig. 4). The map was produced with automatic contouring using minimum curvature interpolation. It reveals a very deep channel extending along the central part of Brazo Upsala (Fig. 4 and 5a). Average water depths for the different periods of glacier retreat were obtained by areal integration between the ice-front positions. Figure 5b shows a cross-section close to the present UWT front including the 600 m deep channel.

Fig. 4. Bathymetric map inserted on Landsat TM image of 13 June 2000, covering the section of Brazo Upsala exposed by glacier retreat between 1996 and 2000. Isobaths are in meters. Note the deep channel trending north-northwest–south-south-east where the glacier was thickest and probably temporarily afloat, as discussed in Reference Naruse and SkvarcaNaruse and Skvarca (2000). L indicates the position of the longitudinal profile, and T of the cross-profile, shown on Figure 5a and b, respectively.
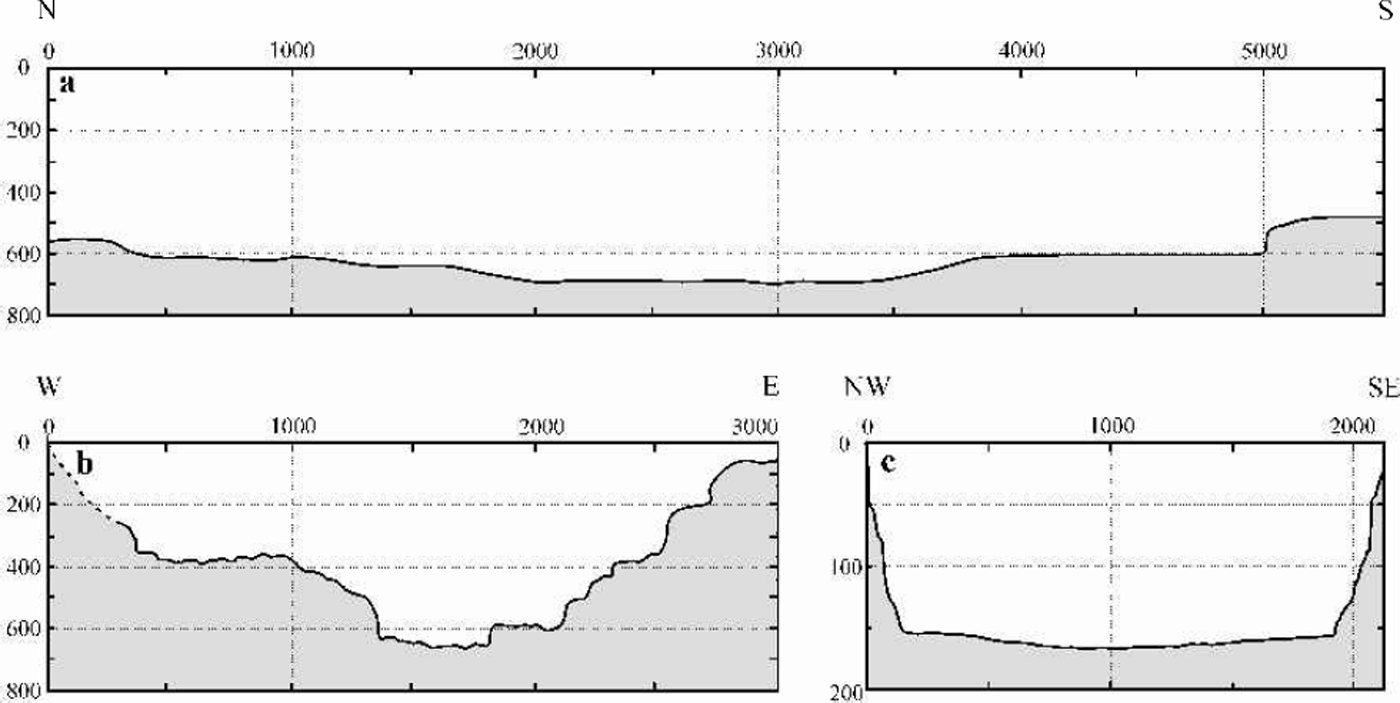
In 1998 the lake depth in front of the steady-state Glaciar (Perito) Moreno was also sounded, in both Brazo Rico and Canal de los Témpanos, in order to complement and extend the previous non-continuous (spot) depth sounding (Reference Rott, Stuefer, Siegel, Skvarca and EckstallerRott and others, 1998; Reference StueferStuefer, 1999). Differential GPS permitted a sub-meter locational accuracy. The textbook U-shaped cross-section shown in Figure 5c was used to improve the Vc/Hw relationship (Fig. 6).

Fig. 6. Refined calving-rate vs water-depth relationship considering 19 datasets (C). Also shown are the relationships proposed by Reference Brown, Meier and PostBrown and others (1982) for Alaskan tidewater glaciers (D), and those proposed for fresh water by Reference Funk and RöthlisbergerFunk and Röthlisberger (1989) (A) and Reference Warren, Greene and GlasserWarren and others (1995) (B).
Results And Discussion
Recent retreat of Glaciar Upsala
Ice-front positions of UWT from late 1996 to mid-2000 are shown in Figure 7. The areal changes, maximum and average front variations, front variation rates and the calving rates are summarized in Table 1. Cumulative average front variations are plotted in Figure 8. Although net retreat occurred throughout the period 1996–2000, two small advances took place in April–November 1999 and April–June 2000. In addition, the glacier advanced slightly on the eastern part of UWT from 22 January to 17 March 1997 (positions 2 and 3, Fig. 7). While the retreat from positions1–4 (Fig.7) affected the western and central-western parts of the terminus most significantly, the more recent recessions prior to June 2000 affected the eastern part, creating a deep re-entrant and partly exposing a new island. Image analyses and in situ information indicate that most of the area lost between 8 December 1996 and 4 April 1998 (3.4 km2) corresponds to a major calving episode which occurred after 14 March 1997, producing an iceberg 0.3 km2 in area, shown on the RADARSAT image of 4 May 1997 (Reference Aniya, Dhakal, Park and NaruseAniya and others, 2000). Regarding the high peak in calving rate revealed by images of 23 March and 24 April 1999 (Table 1), it is known from field observation that this major calving event occurred in about 1hour on 25 March 1999 (observed by the first author).

Fig. 7. Ice-front positions of Glaciar Upsala from late 1996 to mid-2000, derived from sequential Landsat TM images, RADARSAT images and GPS field survey. Note the major calving events which occurred between 8 December 1999 (1), 17 March 1997 (3) and 4 May 1997 (4), affecting mainly the central western part of the terminus.

Fig. 8. Cumulative average front variations referred to the terminus position at 8 December 1996.
Table 1. Ice-front variations, area change and calving velocities of Glaciar Upsala, 1986–2000
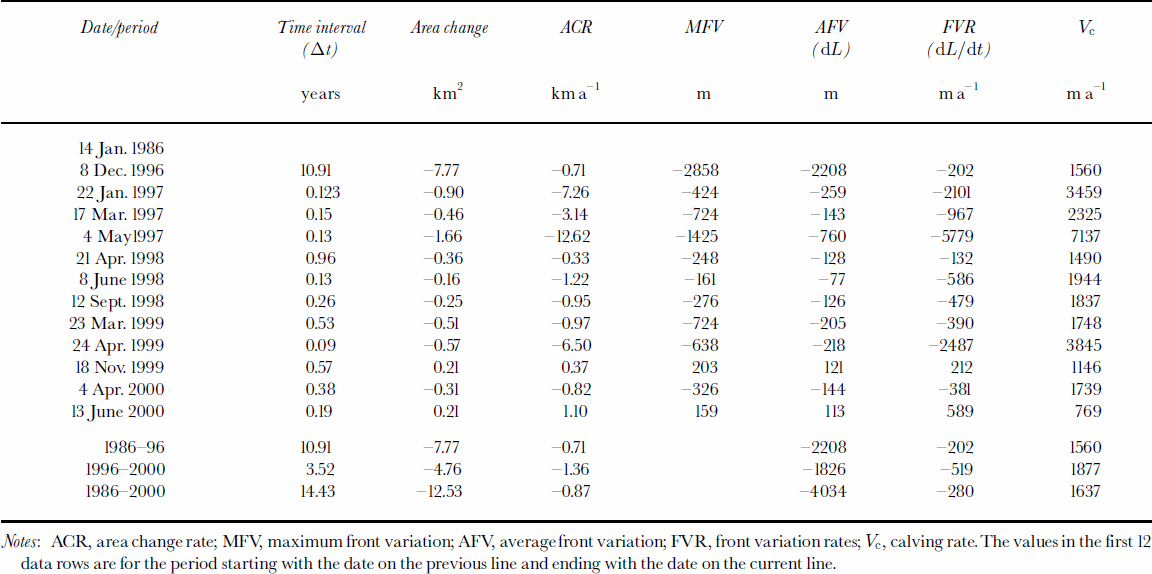
Reference Aniya, Sato, Naruse, Skvarca and CasassaAniya and others (1997) report an area loss of 11.9 km2 for the period 1945–86, yielding a mean rate of area loss of 0.29 km2 a–1. Subsequently, the loss rates have increased significantly, averaging 0.71 km2 a–1 (7.77 km2) during the period 1986–96, and reaching 1.36 km2 a–1 (4.78 km2) between 1996 and 2000. Respectively, this represents an apparent doubling and a quadrupling of retreat rate compared to the period 1945–86, although the temporal resolution in the earlier period is insufficient to rule out the possibility of rapid retreats and readvances.
Calving rates in fresh water
The position of calving termini is controlled by the interplay between ice velocity (Vi) and calving speed (Vc). Neglecting melting at the calving face, this is expressed as:
Ice velocities measured by Reference Skvarca, Satow, Naruse and LeivaSkvarca and others (1995b) between 22 and 28 November 1993 ranged from 0.08md–1 at the eastern glacier margin to 4.44md–1 at the glacier center line. The velocity profile extended across the eastern half of the glacier to the approximate glacier center line. Across-channel integration of these ice velocities yields a mean value of 3.72 md–1. Assuming that velocity is constant with time and extrapolating to a year gives ∼1360ma–1. There is evidence that seasonal variability in ice-flow velocity in Patagonia is limited, especially for fast-flowing calving glaciers (Reference WarrenWarren, 1999), and thus that extrapolations from seasonal to annual values can be meaningful. Nevertheless, these short-term data allow only a preliminary estimate of annual velocity and hence of calving speed. If Vi =1360ma–1 and dL/dt =–520ma–1, Equation (1) yields a mean calving rate for 1996–2000 of 1880ma–1, somewhat lower than the value of 2020ma–1 reported by Reference Warren and AniyaWarren and Aniya (1999) for the period 1990–93.
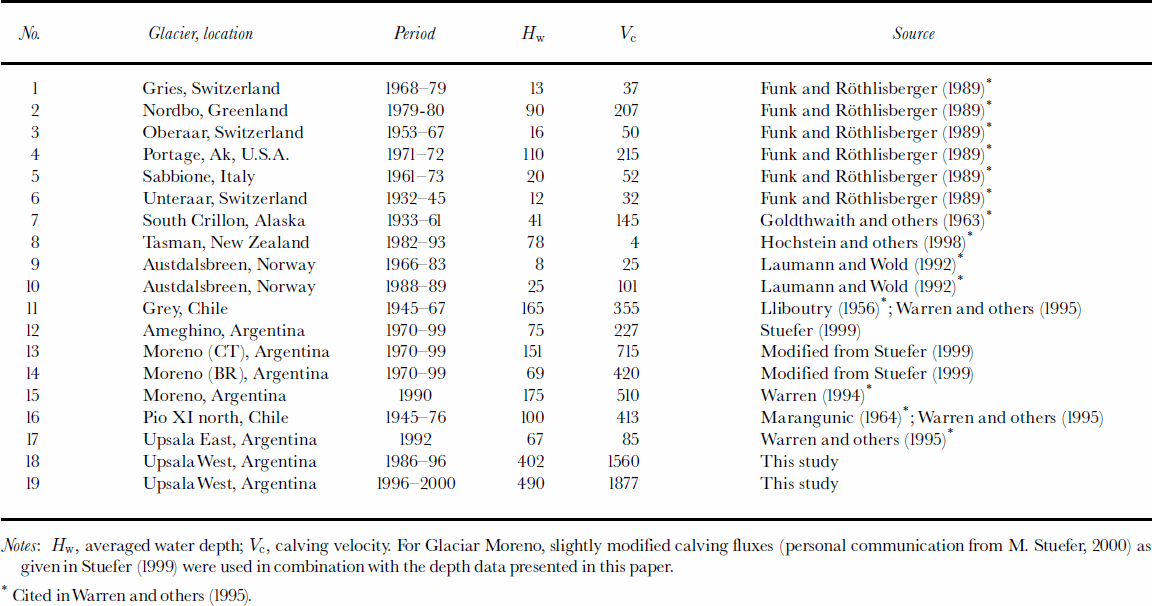
Calving rates exhibit a strong linear correlation with water depth in all settings so far examined, whether tidewater or fresh-water, temperate or polar, although the slope coefficient varies significantly (Reference Meier and PostMeier and Post, 1987; Reference Warren, Greene and GlasserWarren and others, 1995). However, there is unresolved controversy concerning the physical basis (if any) of this correlation (Reference Van der VeenVan der Veen, 1997; Reference Hanson and LeBHanson and Hooke, 2000). There has also been debate concerning the apparent contrast in calving rates in fresh water and tidewater, those in the former being about an order of magnitude less than in the latter. Though consistent, this contrast has been based on a small freshwater dataset, mostly from shallow (550 m) water sites (Reference Warren, Greene and GlasserWarren and others, 1995). The expanded dataset presented here is based on the previously published data for lake calving glaciers augmented by recent deep-water data from Glaciares Upsala, Moreno and Ameghino (Table 2). The calving-rate/water-depth ratio of UWT is comparable with those derived for nearby Glaciar Moreno (Reference Rott, Stuefer, Siegel, Skvarca and EckstallerRott and others, 1998; Reference StueferStuefer, 1999), and well above the average previously proposed for lacustrine calving. The new data allow a refinement of the Vc/Hw relationship for calving in fresh water, with a proportionality coefficient of 3.62, namely:
Table 2. Data on fresh-water calving glaciers modified after Warren and others (1995) by incorporating recent data from Glaciares Upsala,Moreno (BR, Brazo Rico; CT, Canal de los Témpanos) and Ameghino, southern Patagonia
Furthermore, they strengthen the hypothesis that freshwater calving rates are a distinct population, consistently lower than tidewater rates for any given water depth.
Conclusions
Glaciar Upsala is undergoing a rapid and accelerating retreat. Image analysis reveals an area loss of 4.8km2 from late 1996 to mid-2000. The maximum recorded rate of areal loss, 5.78 km a–1 between March and May 1997, was mostly accounted for by a single massive calving episode. The 1945–86 retreat rate of 0.29 km2 a–1 increased to an average of 0.87 km2 a–1 from 1986 to 2000. Between 1996 and 2000 the retreat averaged 1.36 km2 a–1. The average calving velocity during the 3.5 year period was 1880ma–1. The ratio of calving velocity vs water depth is comparable with the calving rates calculated for the nearby steady-state Glaciar Moreno, though above the average commonly reported for lacustrine calving. In addition, the recently obtained calving rates together with ice-proximal bathymetry improve the linear relationship accepted so far by incorporation of new data derived from glaciers calving rapidly in deep fresh water.
Acknowledgements
The authors are grateful to CONAE, Argentina, for providing the Landsat TM images used in the work. Thanks are also due to R.V. Reibel, M. Costa Purry, R. Mañerey, J. Pavelek and all personnel of Sub-Prefectura Lago Argentino, Prefectura Naval Argentina, for their logistic support during the field campaigns carried out in Lago Argentino; to Servicio de Hidrografía Naval, Armada Argentina, for providing the echo sounder; and to M. Brizuela for hard work during the bathymetric survey in severe weather conditions. This work is a result of Glaciological Project in Patagonia of Dirección Nacional del Antártico–Instituto Antártico Argentino, and is also supported by grants from the Ministry of Education, Science, Sports and Culture of Japan.


