Introduction
Vostok station is the only deep-drilling site in Antarctica where the isotope composition of snow thickness can directly be compared to the relatively long (45 years) instrumental records of meteorological observations. In our previous work (Reference Ekaykin, Lipenkov, Barkov, Petit and Masson-DelmotteEkaykin and others, 2002) we made a first attempt at such a comparison, revealing a linear relationship between snow isotope composition (δ) and surface air temperature (T S). In this study, we try to refine the isotope– temperature correlation by using the balloon-sounding record available for 1963–91. The correlations obtained are then used together with the stratigraphic and geochemical data to reconstruct the isotope composition and accumulation rate of snow at Vostok over the past 200 years. The aims of this study fall within the scope of the International Trans-Antarctic Scientific Expedition (ITASE) project coordinated through the Scientific Committee on Antarctic Research (SCAR) Global Change Program Office (ITASE, 1997).
Methods and Experimental Data
In January 1980, stratigraphic observations were carried out in the 10 m snow pit vk10 (independently on the left and right sides of the snow wall) dug about 1 km upwind (west-southwest) of the station. The liquid conductivity measurements allowed identification of the Tambora (Indonesia) layer, dated back to 1816. In January 1997, stratigraphic studies were completed in the 2.5 m pit vk22, excavated about 50 m away from the previous one in order to extend the vk10 accumulation series to 1996.
From December 1999 to January 2000, studies were carried out in two 12m pits (vk99 and st30), one located 165 m upwind from vk10 and the other near stake 30 of the stake network, respectively. Aside from stratigraphic observations, snow samples were taken in both pits to be measured for isotope composition (continuously with resolution 2–5 cm), total beta radioactivity (in the depth range 1.5–3.0m with resolution 5 cm) and liquid conductivity (from intervals 0–3 and 9–11m in vk99 and 9–10.5m in st30 with resolution 3 cm). The location of the pits studied is shown in Figure 1.
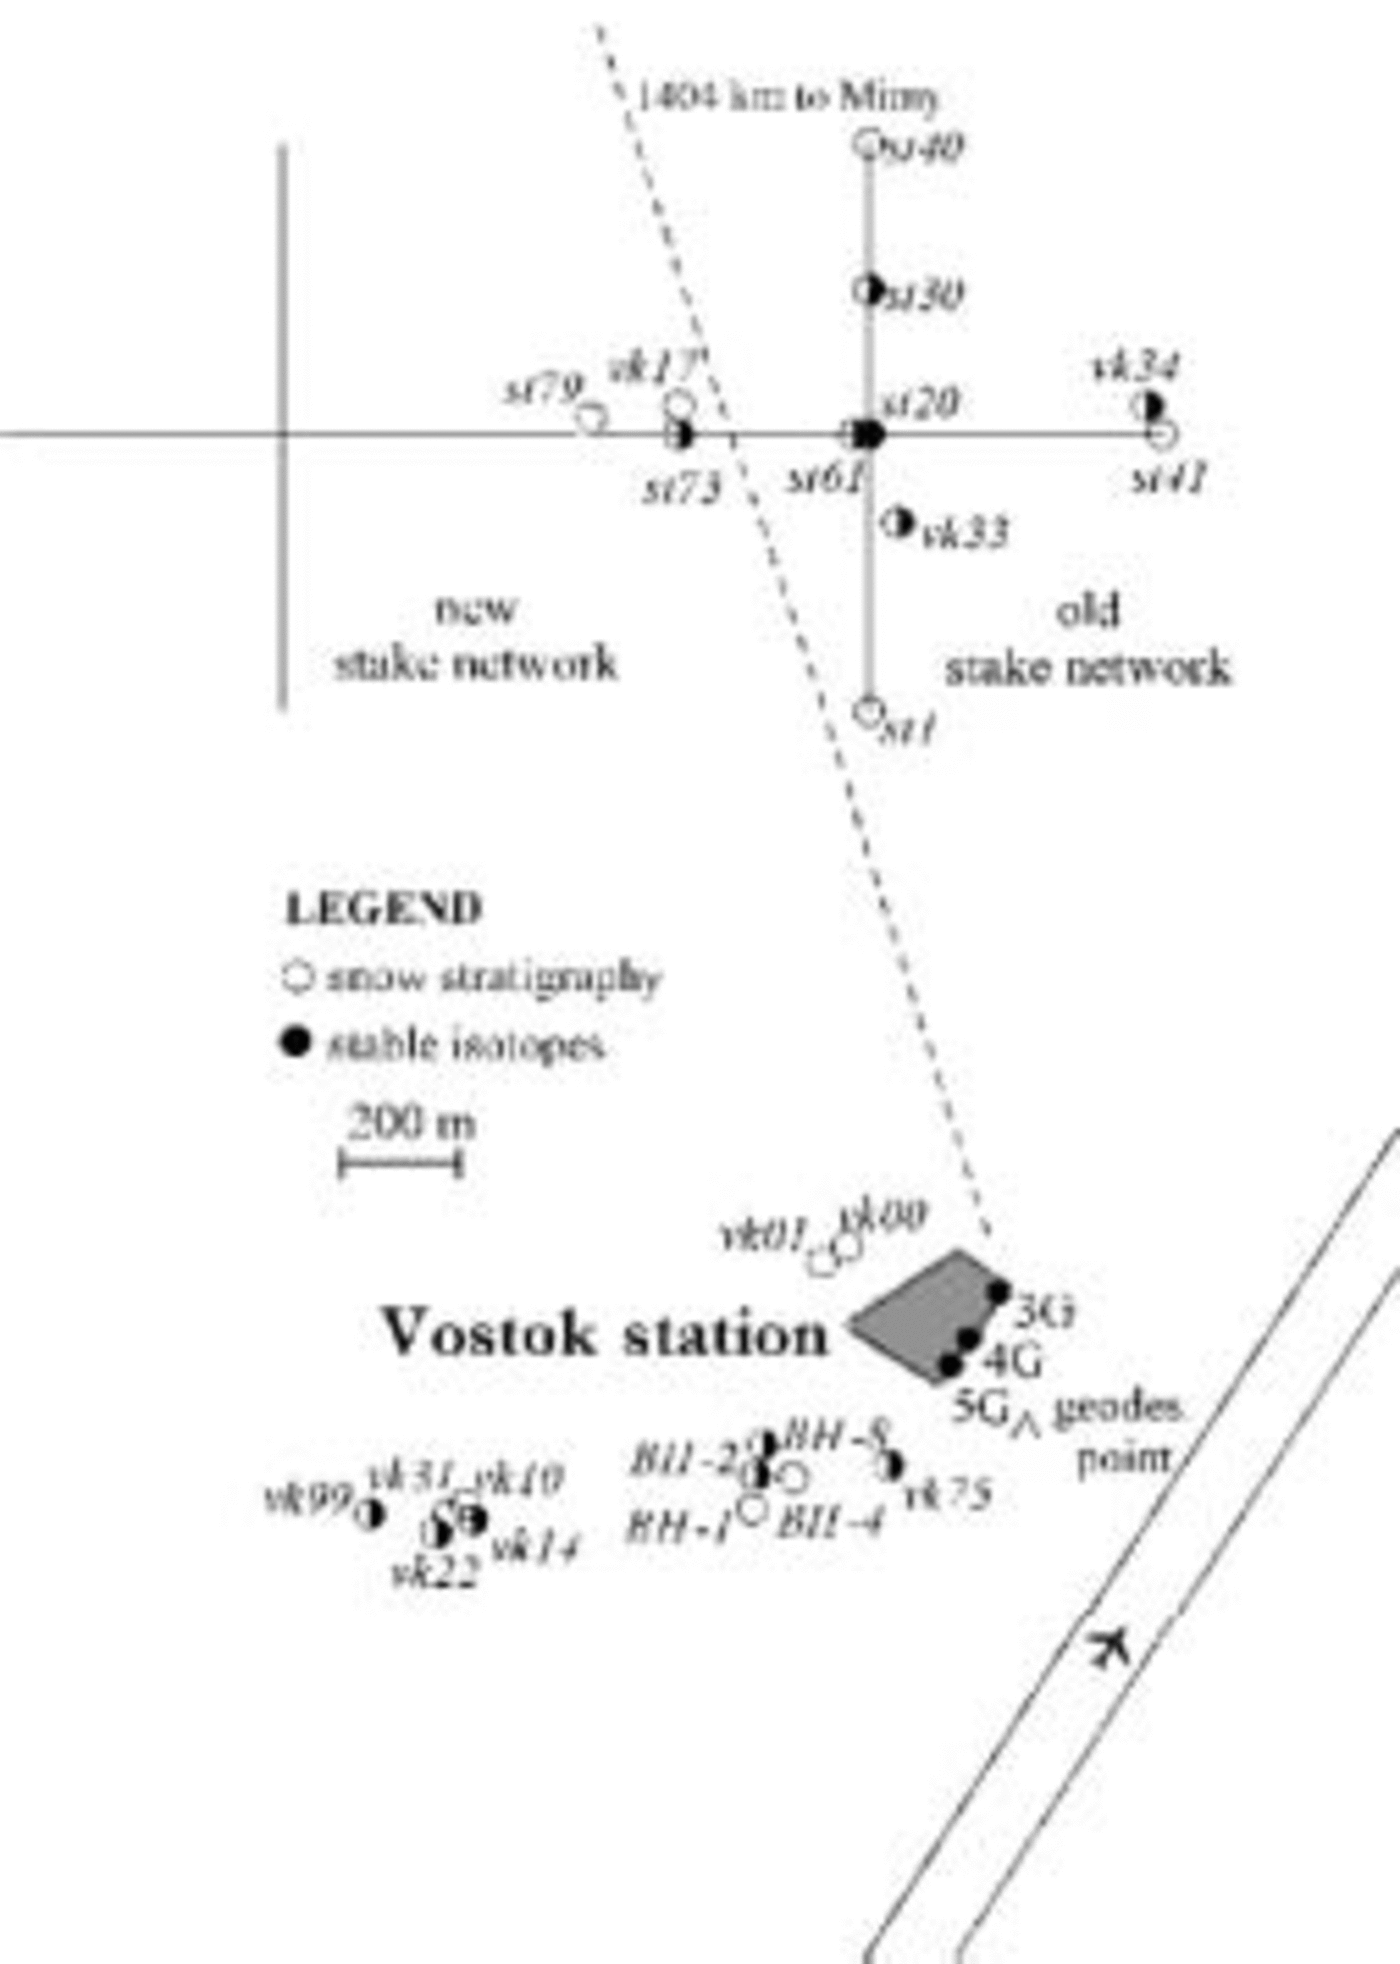
Fig. 1. Location of the snow pits and stake networks in the vicinity of Vostok station. The new stake network was set up in December 1998.
The deuterium and oxygen-18 content was measured in the mass-spectrometric laboratory of the Laboratoire des Sciences du Climat et de l’Environnement (LSCE), Saclay, France, and The Niels Bohr Institute (NBI), Copenhagen, Denmark, with a reproducibility of 0.6–0.8 and 0.05‰ (1σ), sufficient for the present study. The beta-radioactivity and conductivity measurements were made at the Laboratoire de Glaciologie et Géophysique de l’Environnement (LGGE), Grenoble, France.
All the pits discussed here were dated using the stratigraphic observations taking into account the probability of annual-layer hiatus (Reference Ekaykin and BarkovEkaykin and others, 1998). The initial stratigraphic dating was then corrected using the depths of the 1955 and 1965 radioactive reference layers (for pits vk99 and st30) and the 1816 Tambora layer established for each pit. The stratigraphic and geochemical data obtained from pits vk99 and st30 are shown in Figure 2.
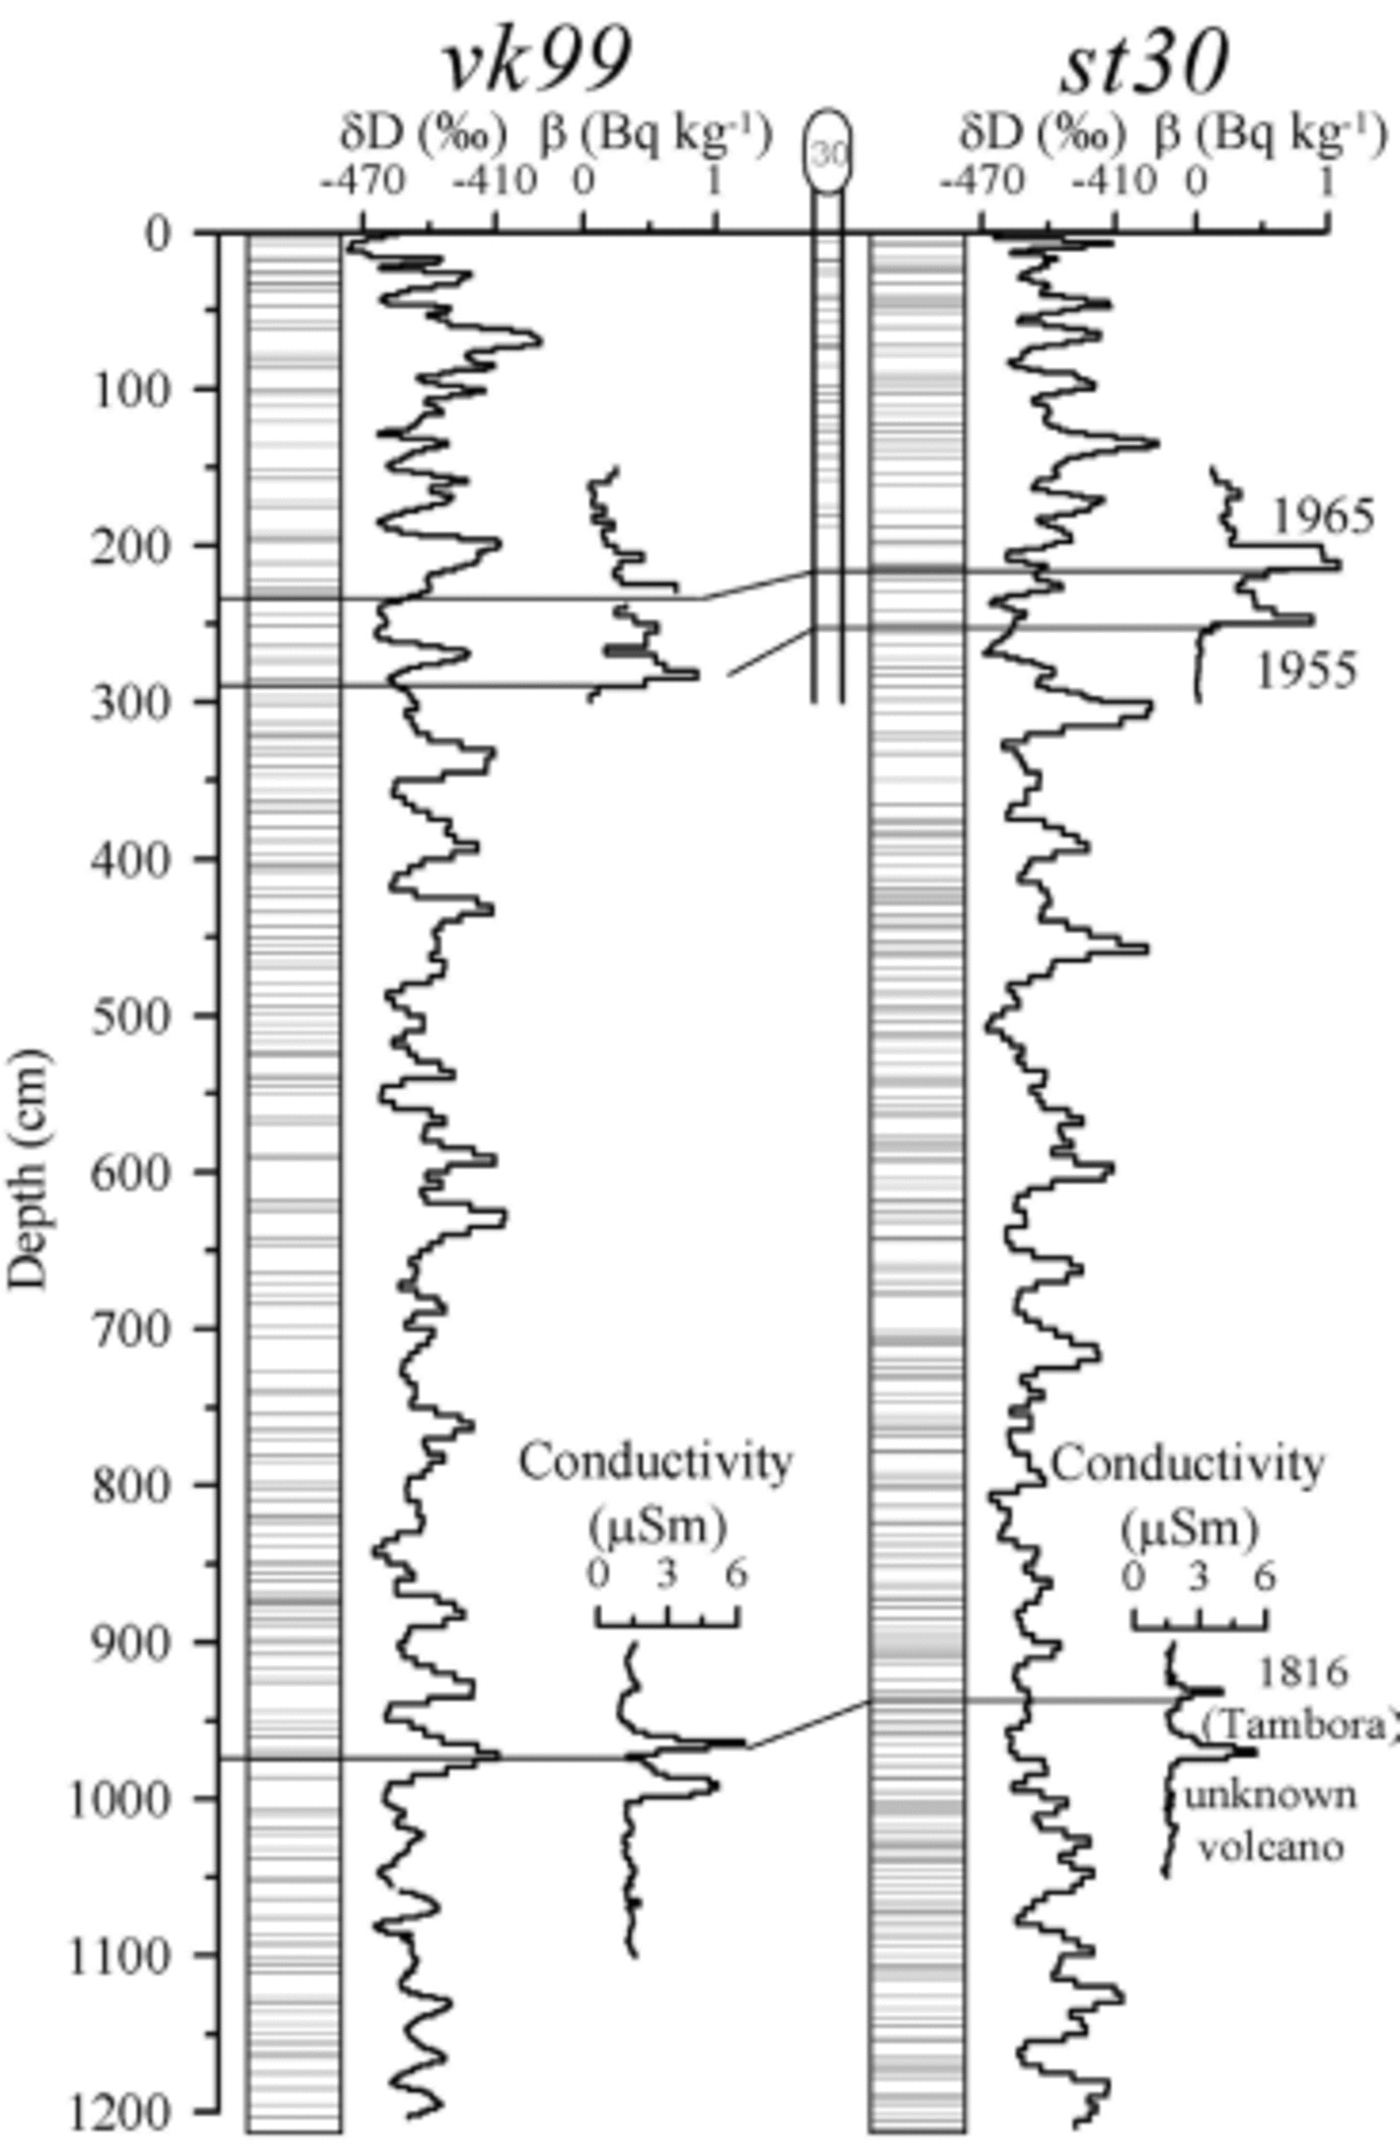
Fig. 2. The results of snow thickness study (layer boundaries, isotope composition, total beta activity and liquid conductivity of snow) in pits vk99 and st30. The annual snow build-up values measured at stake 30 were corrected for snow settling to correspond with annual layer thickness. The horizontal lines represent the reference horizons of 1955, 1965 and 1816 as determined by the total beta-activity and liquid conductivity measurements.
According to our dating, the snow in the investigated pits was deposited during the following periods: 1796–1979 for vk10, 1945–96 for vk22, 1774–1999 for vk99 and 1750– 1999 for st30.
To reconstruct the snow accumulation rate from the annual-layer thickness, we used the stacked density profile established for Vostok (Reference Ekaykin, Lipenkov, Petit and Masson-DelmotteEkaykin and others, 2003). The interval 0–1m of the profile comprises the data from 17 pits and mini-pits dug in 1980–97. The interval 1–3m includes the data from six pits, whereas below 3 m the data from only two pits (vk10 for 3–10m and vk99 for 10–12 m) are available. The stacked profile can be approximated by the
following linear equation:
where ρ (kg m–3) is the density at depth H (m).
The isotope composition of snow precipitation was measured on 49 samples collected between December 1999 and December 2000.
The electronic database of balloon-sounding measurements was created using the original paper files stored in the archives of the Arctic and Antarctic Research Institute (AARI), St Petersburg, Russia. The dataset covers the whole period of balloon observations at Vostok, from December 1957 to January 1992. However, the data from the first 4 years were rejected because of the poor quality of temperature measurements made by radiosonde ’P3-049’ (personal communication from N. N. Kazakova, 2003). In 1962 and 1982 the balloon-sounding observations were not carried out.
The mean monthly data of the main meteorological parameters at Vostok were taken from the official website of AARI: http://www.aari.nw.ru/projects/Antarctic/default_en/asp.
Figure 2 displays the vertical δD profiles obtained from pits vk99 and st30. The mean values of δD in vk99 and st30 are –442.3‰ and –440.7‰, respectively. The 12 m deep δ profiles have the same characteristic features as those previously found in the 3m profiles (Reference Ekaykin and BarkovEkaykin and others, 2002). In particular, in both deep pits quasi-periodical δ oscillations are observed with a wavelength of 20–30 and 60–80cm and a magnitude of about 60–80‰. It has been shown that these oscillations are primarily caused by the drift of snow accumulation waves of various scales (Reference Ekaykin and BarkovEkaykin and others, 2002).
Since the present work is mainly devoted to the δ changes with the time-scales from decades to centuries, the diffusive smoothing (Reference Johnsen, Clausen, Cuffey, Hoffmann, Schwander, Creyts and HondohJohnsen and others, 2000) of the isotope profiles has not been taken into account. Nevertheless, it is worth mentioning the apparent influence of the smoothing on the 12 m profiles shown in Figure 2.
Changes in δD and a Over the Last 50 Years
Based on the pit stratigraphy, snow density data and high-resolution isotope measurements, we reconstructed a time series of annual accumulation rates and isotope composition of snow for each pit. The mean correlation coefficient (r) between unsmoothed individual accumulation series is 0.1. The latter supports the conclusion that stratigraphic noise accounts for about 90% of the total variance of snow accumulation as observed in a single point (Reference Ekaykin, Lipenkov, Barkov, Petit and Masson-DelmotteEkaykin and others, 1998). At the same time, r increases up to a statistically significant value of 0.21 for the series obtained from the left and right walls of pit vk10 separated by a distance of 1.5 m. The r coefficient between the vk99 and st30 δD series is close to zero, but after smoothing with a period of 21 years it increases to a significant value of 0.45.
In order to improve the climatic signal in the pit data, we constructed the stacked time series of accumulation rate and deuterium content of snow. The stacked series ‘δD12m’ and ‘a12m’ shown in Figure 3b reveal a high level of stratigraphic noise still remains. The period of smoothing necessary to suppress this noise was estimated to be 7 years (for details see Reference Fisher, Reeh and ClausenFisher and others, 1985; Reference Ekaykin and BarkovEkaykin and others, 2002) both for a and for δD time series. Interestingly, the amount of noise is much lower for δD than for a probably due to diffusive smoothing of δD profiles (Reference Fisher, Reeh and ClausenFisher and others, 1985; Reference Johnsen, Clausen, Cuffey, Hoffmann, Schwander, Creyts and HondohJohnsen and others, 2000).
The intervals 1944–99 of ‘δD12m’ and ‘a12m’ are blown up in Figure 3a together with the following time series (all are 7 year running means):
-
1. mean annual (1958–99) near-surface air temperature (T S), according to meteorological observations at 2m above snow surface;
-
2. stacked a and δD series from eight shallow pits covering the period 1944–98 (Reference Ekaykin and BarkovEkaykin and others, 2002);
-
3. annual snow accumulation, as observed at the stake network in the period 1970–99.
The correlation coefficients between the above series are, in the main, statistically significant, in accordance with the apparent similarity between different curves in Figure 3a. Most of the parameters show a minimum around 1960, with a subsequent increase until the maximum approximately in 1980, the tendencies earlier reported for different parts of East Antarctica (Reference Pourchet, Pinglot and C. LoriusPourchet and others, 1983; Reference Morgan, Goodwin, Etheridge and WookeyMorgan and others, 1991). According to Reference Pourchet, Pinglot and C. LoriusPourchet and others (1983), the accumulation rates at 14 East Antarctic sites in 1965–77 were 30% higher than during the preceding decade. Over the last 10–20 years, all the parameters in Figure 3a show a distinct decrease in values, especially pronounced for T S. This is in good agreement with Antarctic climate cooling in the 1990s reported for almost the whole continent except the Antarctic Peninsula (Reference DoranDoran and others, 2002).
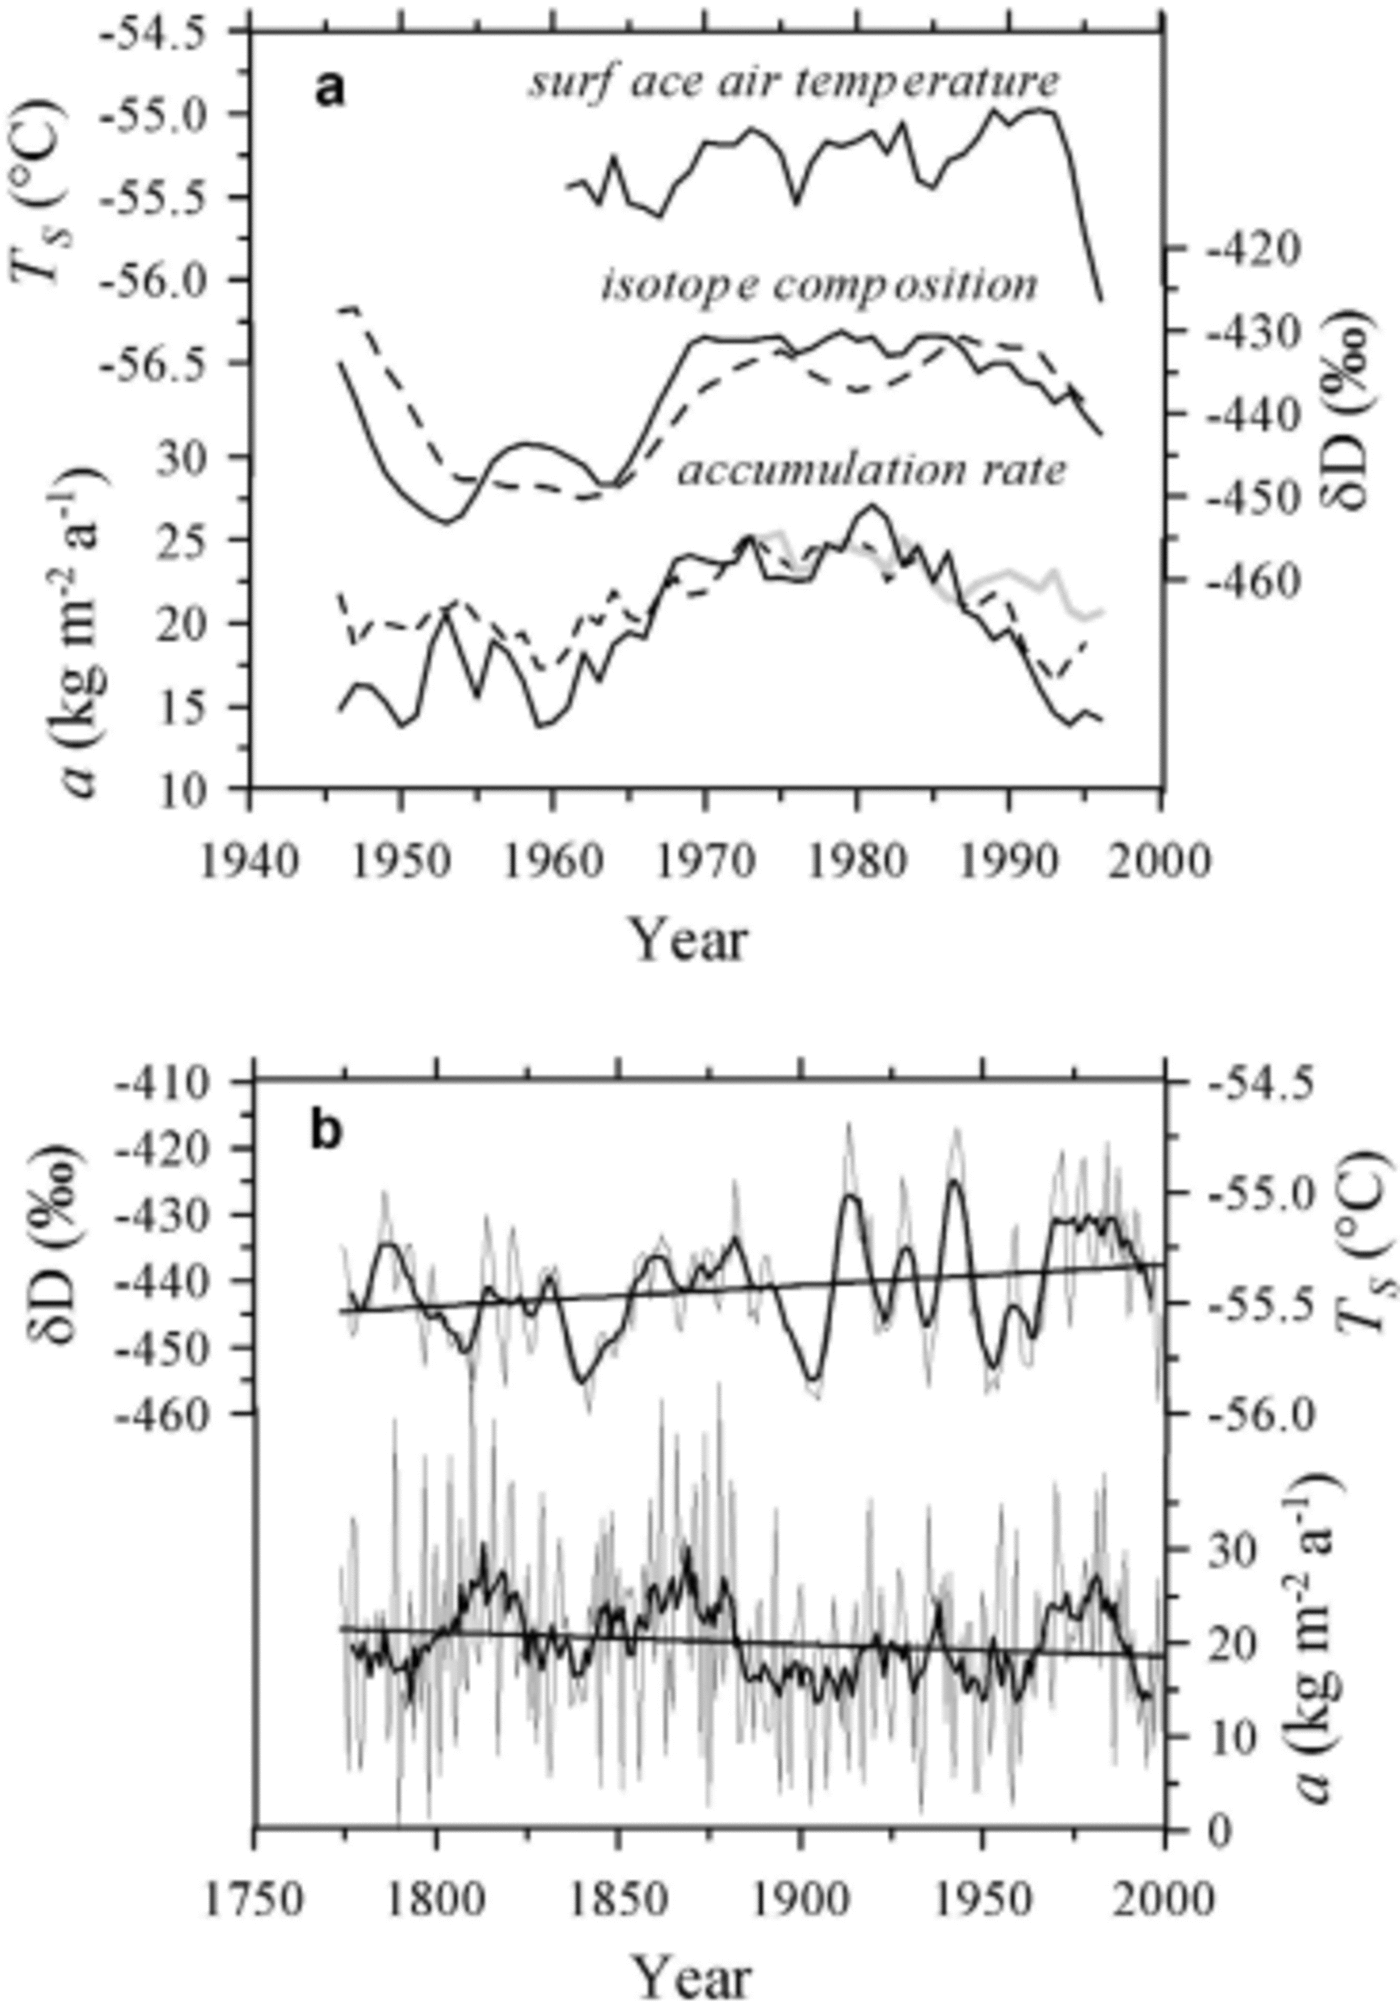
Fig. 3. (a) The stacked accumulation and isotope series from deep (solid lines) and shallow (dashed lines) pits and the near-surface air temperature. Thick gray line represents accumulation record from the stake network. All series are smoothed with a period of 7 years. (b) Accumulation and isotope records from deep pits. Thin lines represent stacked annual series; thick lines show 11 year running means. The temperature scale (T S) corresponds to the δD–T S slope of 28‰C–1.
The observed changes are likely related to the variations of cyclonic activity in Antarctica (Reference EnomotoEnomoto, 1991; Reference Morgan, Goodwin, Etheridge and WookeyMorgan and others, 1991; Reference Simmonds and KeaySimmonds and Keay, 2000). Since precipitation events are associated with higher air temperatures, increases in cyclonic activity followed by more frequent or long-lasting precipitation events lead to warmer temperatures (Reference Morgan, Goodwin, Etheridge and WookeyMorgan and others, 1991). In addition, the water-vapor saturation pressure and thus the water content of the air column are controlled by temperature (Reference RobinRobin, 1977), implying a relation between snow accumulation rate and air temperature.
To summarize, the comparison of ‘δD12m’ and ‘a12m’ with other data available for Vostok suggests that obtained series represent climatic variations over the last 40–60 years and thus likely over the past two centuries.
As shown in Reference Ekaykin and BarkovEkaykin and others (2002), mean annual near-surface air temperature accounts only for 34% of the interannual variability of isotope composition of central Antarctic precipitation. Aside from the factors related to origin and moisture transport (see review by Reference JouzelJouzel and others, 2003), the main reasons for this are: (1) the very low occurrence of cyclones that are thought to bring a considerable (but yet unknown) portion of precipitation, and (2) the difference between T S and the temperature of condensation T C, the latter being unknown, too.
Here we attempt to evaluate the contribution of the two main precipitation types, from clouds and from clear sky (the latter is also referred to as ‘diamond dust’), to the total precipitation in central Antarctica using the monthly accumulation data from the Vostok stake network. Based on this analysis, we then estimate the condensation temperature using the balloon-sounding data.
To perform the former task, the annual accumulation rate a must first be corrected for the amount of summer evaporation e, to obtain the annual amount of precipitation p. As an estimation of e we took the average of the empirical data obtained by the method of turbulent diffusion in 1966 (Reference ArtemievArtemiev, 1976) and the results of direct evaporation measurement carried out by V. K. Nozdryukhin in November 1961–January 1962 (Aver’yanov, 1990). According to these works, the total evaporation for the period November– February varies from 4 to 2 mm (17% to 8% of total annual precipitation), whereas during the other months it is nearly zero. We assume that the interannual variability of e is negligible with respect to the uncertainty of its mean annual value since evaporation is mostly determined by local solar radiation, temperature and wind regime, which were essentially unchanged during the period of instrumental observations. According to the instrumental measurements, the mean annual accumulation rate for the period 1970–95 is 22.9 ± 1.8mm. Thus, the best estimate of mean precipitation rate (p = a + e) for the same period is 26.1 ± 2.6mm. The error bars (95% confidence level) for the mean accumulation value were estimated as
where σ is the interannual variability (standard deviation) of
accumulation rate and n is the period of observations (26 years). The error bars for the precipitation are calculated as
where σ e and σ a are the errors of evaporation and accumulation rate, respectively.
To estimate the proportion of precipitation originating either from clouds or from clear sky, we calculated mean monthly snow accumulation measured at the stake network separately for the months with and without precipitation from clouds, using the data on precipitation occurrence from the meteorological dataset. The results thus obtained suggest that about three-quarters (59–91% with 95% confidence level) of annual precipitation originates from clear skies and only one-quarter from clouds. Such a low contribution of the cloud precipitation could be explained by its rare occurrence (on average, only 37 events per year, according to the meteorological data) and low intensity. Because of the low accuracy of the data, we do not discuss here the seasonal variability of precipitation.
The condensation temperature was estimated separately for the two main types of precipitation.
Diamond dust is thought to be formed throughout the thickness of the temperature inversion layer where the air is supersaturated with water vapor with respect to ice, but most of the crystals are generated in the relatively moist upper part of the surface inversion characterized by a low gradient of T (Reference RobinRobin, 1977; Reference BromwichBromwich, 1988). The thermal conditions of diamond dust formation in this case are well described by the mean annual temperature of this quasi-isothermal layer. The average temperature profile for the period 1963–91 is presented in Figure 4 (curve I). One can see that the condensation temperature for diamond dust most likely lies in the range –40 to –38˚C (i.e. –39 ± 1˚C).
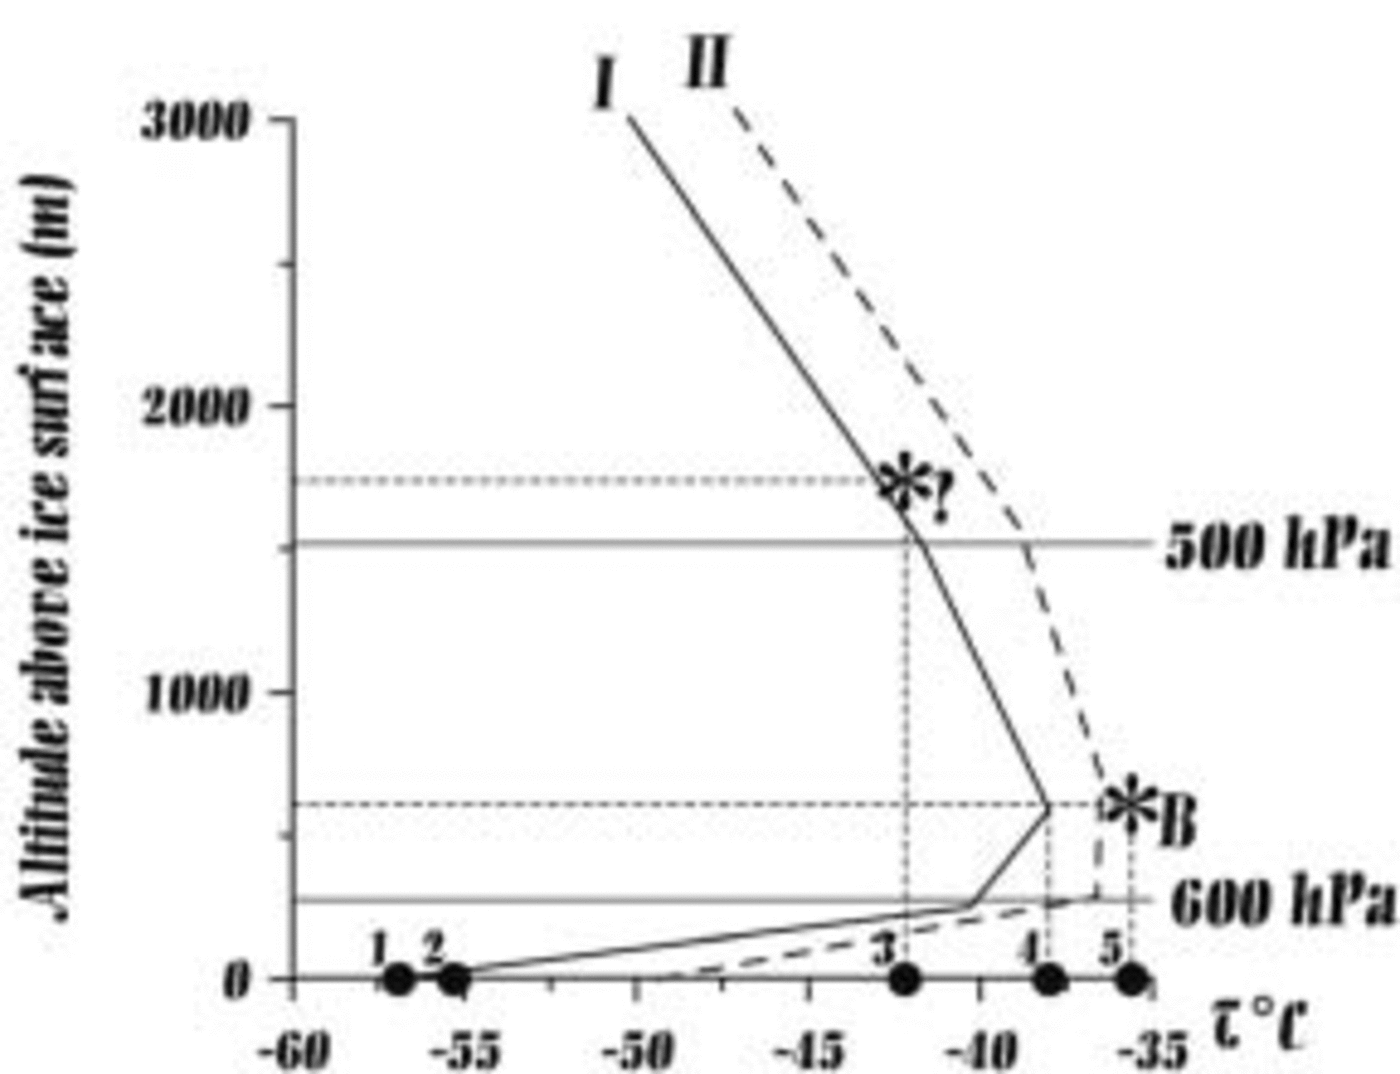
Fig. 4. The mean annual vertical profile of the air temperature (curve I), and the mean temperature profile for snow precipitation events (curve II). A and B show the mean height and the temperature of middle (As, Ac) and lower (St, Sc) clouds, respectively. Circles 1–5 show positions of some characteristic temperatures on the temperature scale: 1 and 4 are temperatures at the bottom and the top (T i) of the inversion layer, respectively; 2 is near-surface air temperature (T S); 3 and 5 are mean temperatures at the lower boundary of the middle and lower clouds, respectively.
Precipitation from clouds in central Antarctica is formed at two different levels, in lower (St and Sc) and middle (As and Ac) clouds (Aver’yanov, 1990). Mean height and temperature at the lower boundary of these two cloud levels are shown in Figure 4 by the asterisks B and A, respectively. Thus, mean weighted condensation temperature for cloud precipitation (TCP) could range between –42 and –36˚C (i.e. –39 ± 3˚C) depending on the relative contribution of different cloud types in the total amount of precipitation. Taking into account that the occurrence of snow from lower and middle clouds at Vostok is roughly the same according to the meteorological data, the mean TCP should be nearly equal to the temperature of diamond dust formation within the given uncertainty (but probably closer to its warmer limit if considering that the intensity of precipitation from lower clouds is higher (Aver’yanov, 1990)).
Thus, the best estimation for the present-day mean annual condensation temperature at Vostok (T C) is –39˚C, with an accuracy of ±1.1˚C (the latter is calculated assuming that 75% of precipitation is represented by diamond dust). The conclusion can be drawn that T C is close to the mean annual temperature at the top of the inversion layer, T i (–38.0 ± 0.2˚C in 1963–91), in full accordance with the earlier finding by Reference RobinRobin (1977).
Curve II in Figure 4 represents the mean Vostok temperature profile during the cloud precipitation events. As expected, the atmosphere is substantially warmer at all levels due to advection of warm air and less cooling of the snow surface. However, the distance between profiles I and II varies with altitude, first decreasing from 6˚C at the surface to 1.5˚C at the top of the inversion (which reflects weakening of the inversion strength), and then increasing again to 3˚C in the free atmosphere. Given that most of the precipitation is formed under clear-sky conditions (diamond dust), we argue that precipitation-weighted condensation temperature at Vostok is not much biased from its simple mean annual value. This is because diamond dust is observed practically every day throughout the year. Therefore, in the following we use mean annual temperature at the top of the inversion layer as the most reliable approximation of precipitation formation conditions.
Table 1 shows the values of the correlation coefficient between the stacked δD series from eight shallow pits and the mean annual air temperature at different levels.
Table 1 Correlation coefficients between stacked δD series and mean annual air temperature at different levels at Vostok

The results suggest fast weakening of the relationship between δ and T with ascent into the free atmosphere. Surprisingly, already for the top of the inversion r is nearly zero. This is because the short-term (with a period of about 10 years) variations of isotope composition may be linked with factors other than the local air temperature (Reference Ekaykin, Lipenkov, Petit and Masson-DelmotteEkaykin, 2003). Indeed, after smoothing of both the δ and T series with an 11 year filter, the δ–T i correlation becomes positive (0.37 ± 0.23), though still insignificant due to the shortness of the temperature series.
The observed correlation of δ with the near-surface air temperature may be of a non-climatic origin. Alternatively, higher air (and thus snow surface) temperature may accelerate post-depositional processes, leading to a heavier isotope composition of the annual snow layer of a given year (Reference Waddington, Steig and NeumannWaddington and others, 2002; Reference Jouzel, Merlivat, Petit and LoriusJouzel and others, 2003). This effect, however, can be counterbalanced by increased snow accumulation during a warmer year, which results in more rapid burying of the corresponding annual layer, preventing its isotopic alteration.
The δ–T slope between the stacked isotope record and T i (both smoothed with a period of 11 years) is 5.4 ± 3.4‰ ˚C–1, which is essentially less (even taking into account the large uncertainty of our data) than the theoretical prediction (9‰˚C–1) derived from a Rayleigh-type isotope fractionation model (Reference Jouzel and MerlivatJouzel and Merlivat, 1984). The slope between δ and T S varies from 17 ± 4‰˚C–1 for the series smoothed with the period of 7 years (Reference Ekaykin and BarkovEkaykin and others, 2002) to 28 ± 4.5‰˚C–1 for those smoothed by an 11 year filter. The gradient dT i /dT S equals 0.8 ± 0.2, which is close to the corresponding present-day spatial slope of 0.67 (Reference Jouzel and MerlivatJouzel and Merlivat, 1984) conventionally used in paleoclimatic reconstructions (Reference PetitPetit and others, 1999).
In Figure 5, the seasonal variations (mean monthly values) of snow precipitation during the year 2000 are shown. The total magnitude of the δD variations is nearly 90‰ (–405‰ to –493‰, with annual average of –453‰). The correlation coefficient between monthly values of δD and surface air temperature for the period December 1999–November 2000 is significant and equals 0.89 ± 0.14. The corresponding regression coefficient is 2.12 ± 0.35‰˚C–1. The latter value is considerably lower than the 6‰˚C–1 predicted by simple isotope models. The difference is primarily due to the significant seasonal changes in local conditions, in particular, inversion strength controlled by radiation and heat balance. Another reason for the observed discrepancy is the significant change of moisture-source conditions between summer and winter periods suggested by strong intra-annual changes of deuterium excess values, also shown in Figure 5.
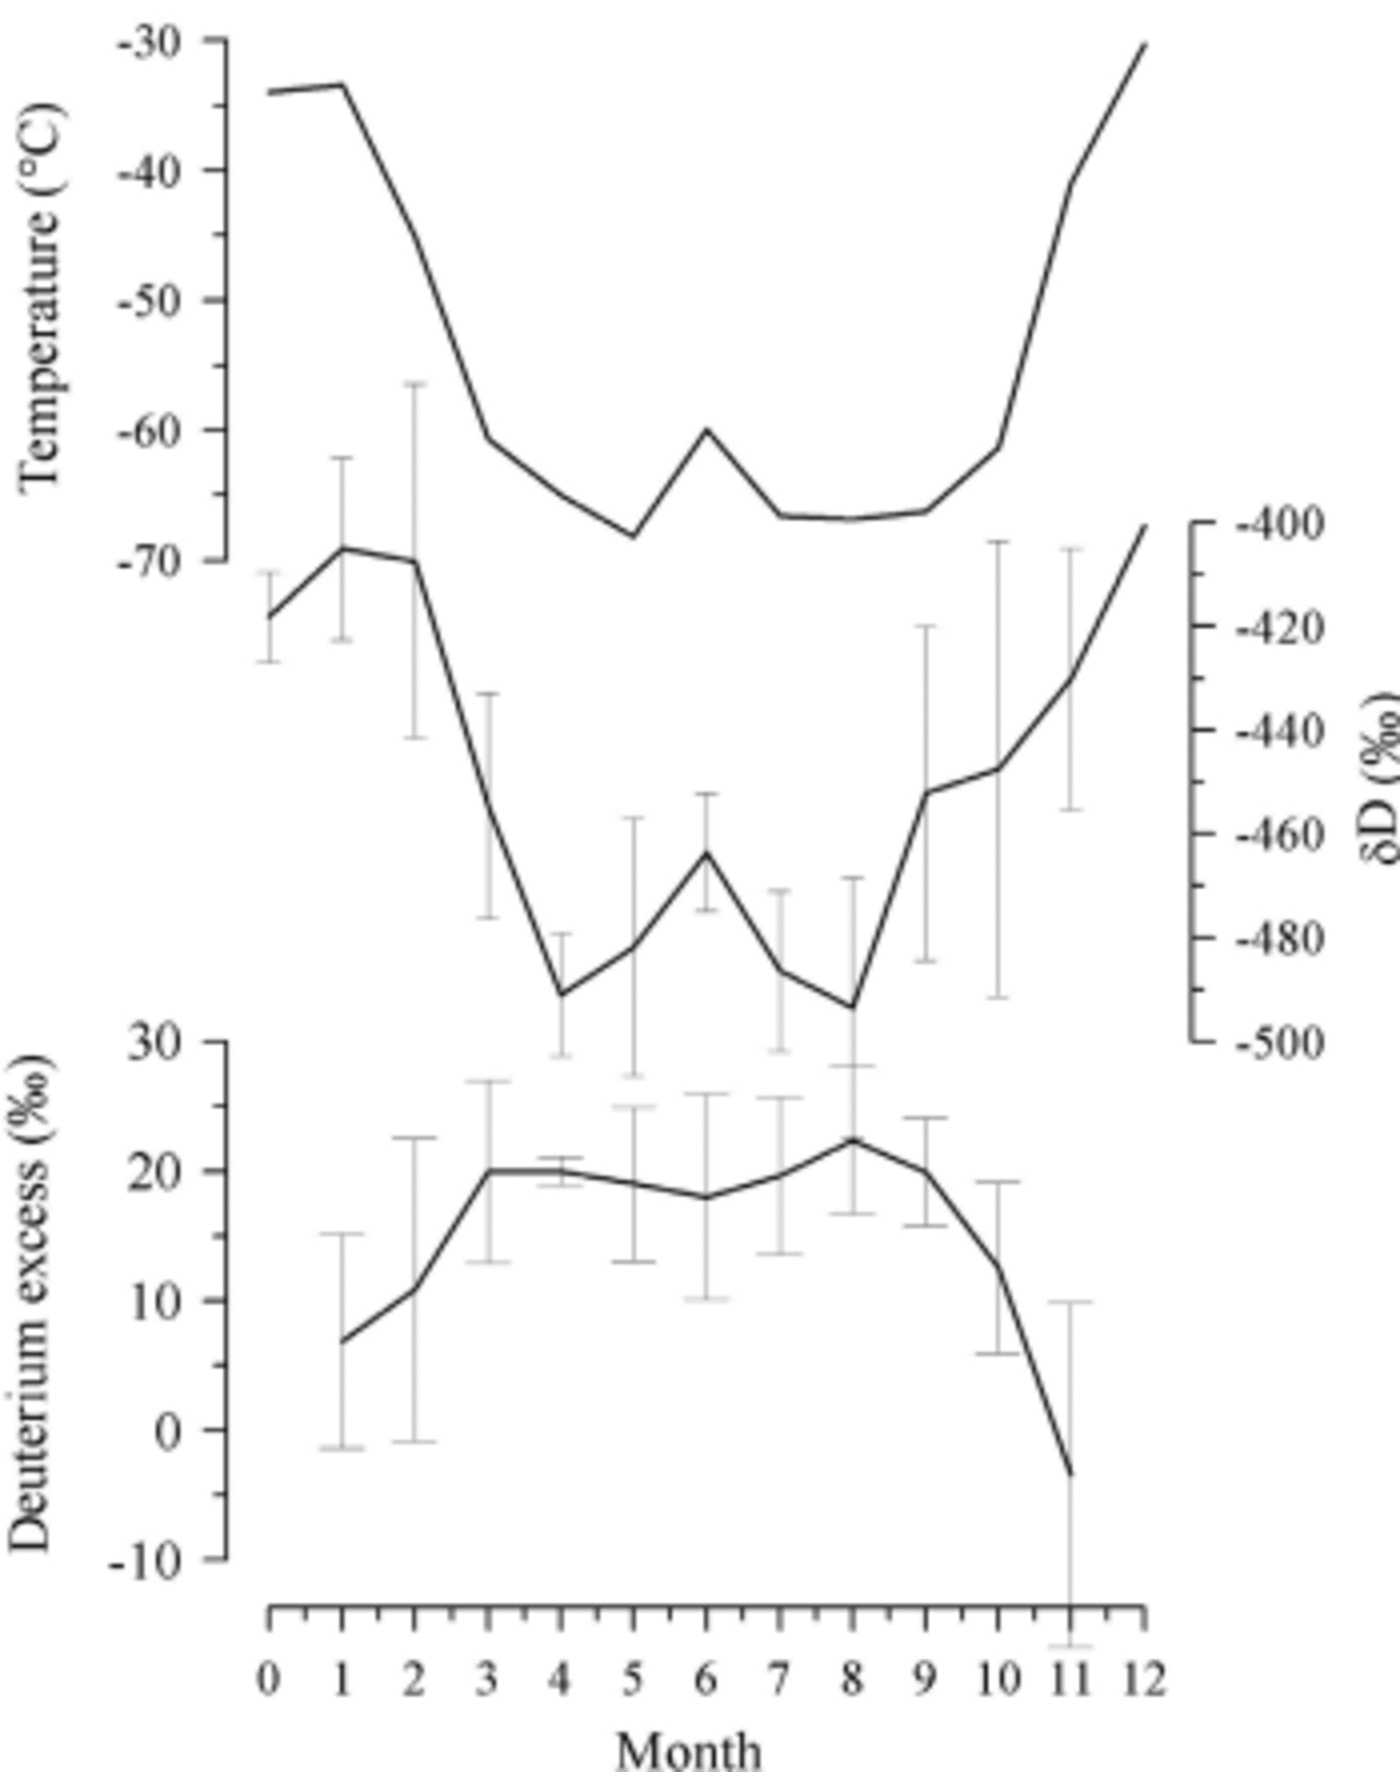
Fig. 5. Seasonal variations of isotope composition (δD and deuterium excess) of precipitation and the near-surface air temperature. Error bars show standard deviation of isotope composition in individual precipitation samples collected within a given month.
It is not possible to determine the relationship between δD in precipitation and the corresponding inversion temperature, because balloon-sounding observations were not carried out in 2000. Instead, we took the mean monthly values of T i for the period 1963–91, keeping in mind the comparatively low interannual variability of this parameter. The δD–T i slope is equal to 6.2 ± 1.1‰˚C–1. As with the interannual variations, this value is less than the 9‰˚C–1 given by the Rayleigh model.
Thus, for both intra- and interannual variations of snow isotope composition, the slope between δ and the condensation temperature (estimated as the temperature at the top of the inversion layer) equals about 6‰˚C–1, which is 30% less than that predicted by the simple isotope model.
Changes in δD and a Over the Last 200 Years
Spectral analysis of the 200 year series of a and δD (not shown) revealed oscillations with a periodicity of 50– 60 years, more pronounced for accumulation than for isotopes. Based on the data discussed in the previous section, we assume that the observed variations are linked to the changes of cyclonic activity around Antarctica (Reference EnomotoEnomoto, 1991; Reference Morgan, Goodwin, Etheridge and WookeyMorgan and others, 1991). In particular, Reference EnomotoEnomoto (1991) analyzed data on mean July sea surface pressure in the 40–50˚ S band over the period 1873–1981 and found a 40–60 year cycle of meridional circulation.
Recently, semi-centennial variations were found in changes of sea surface temperature, intensity of zonal and meridional circulation, CO2 concentration and biological production in the Pacific Ocean (Reference Chavez, Ryan, Lluch-Cota and NiquenChavez and others, 2003). These variations are related to the Pacific Decadal Oscillation (PDO), which is a similar mechanism to El Niñño. Over the last century, both a and δD at Vostok are practically in phase with the PDO index (see Fig. 6). The correlation between δD and PDO is significant and equal to 0.44 ± 0.10, which suggests a climatic teleconnection between the central Antarctic and the tropical Pacific on a decadal scale. The mechanism of this teleconnection will be investigated in future studies.
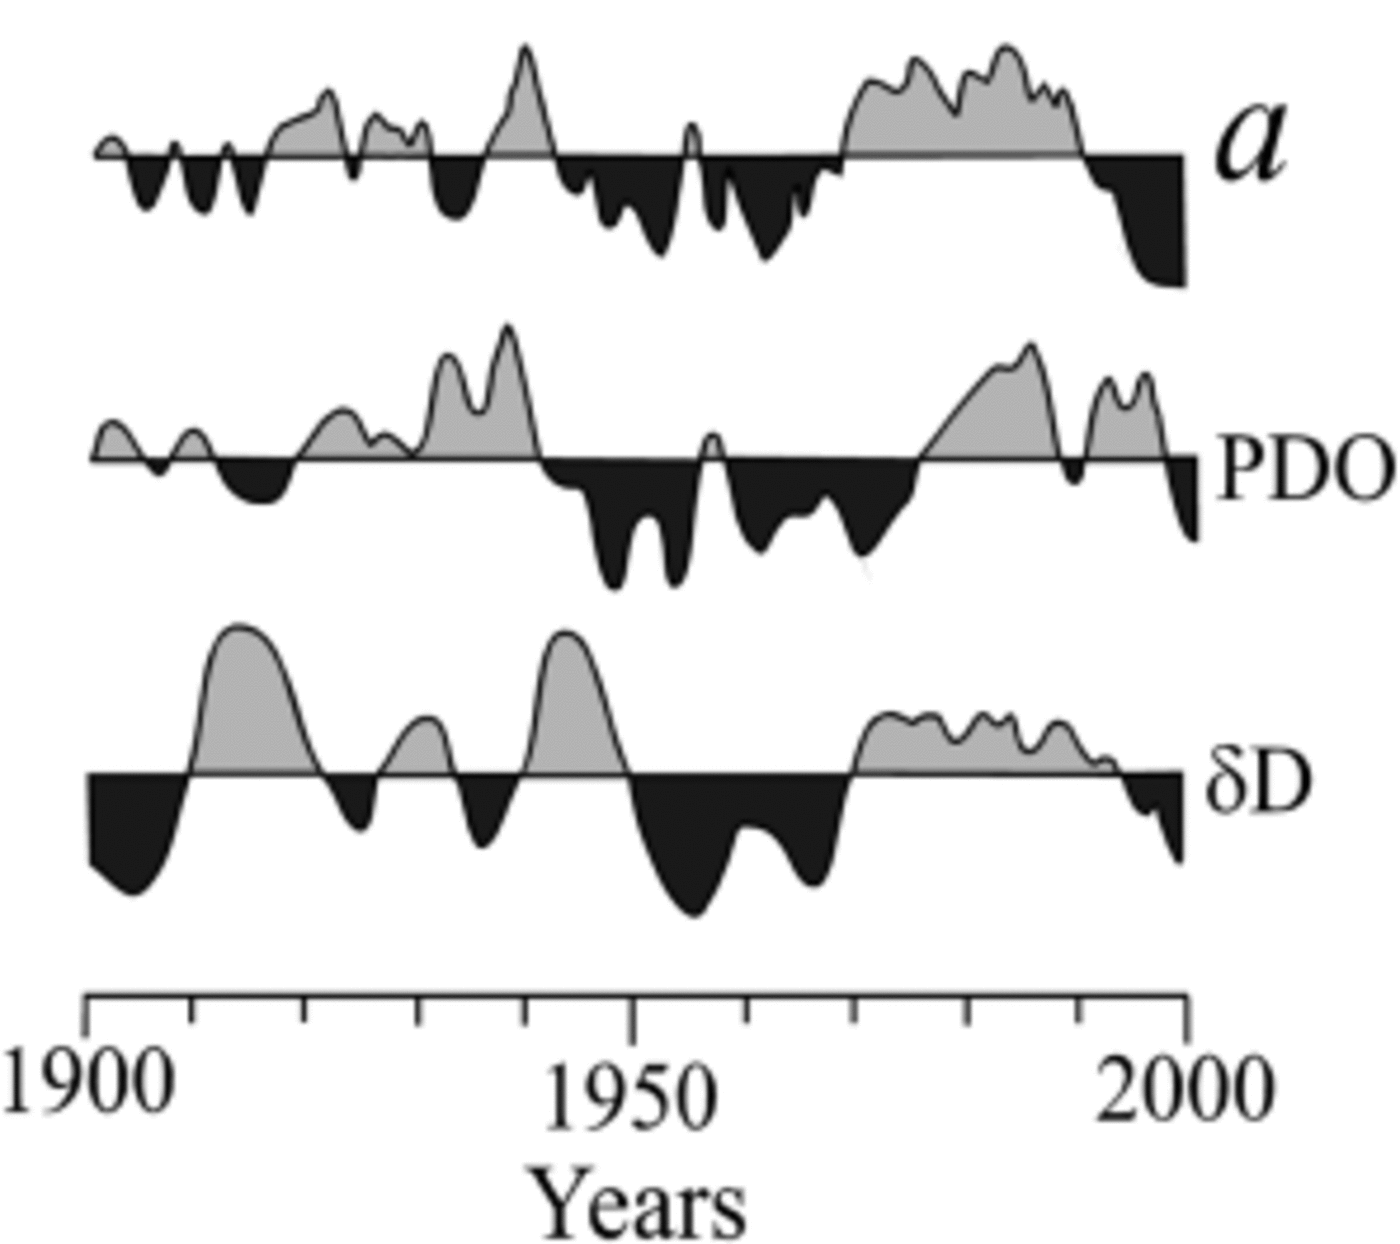
Fig. 6. Vostok snow accumulation and isotope composition series and variations of PDO index over the period 1900–2000. All the series are de-trended and smoothed with a period of 7 years.
In general, according to the climate reconstruction presented in Figure 3b, the absolute magnitude of snow-accumulation changes over the past 200 years was 15 kg m–2 a–1 (from 15 kg m–2 a–1 to 30 kg m–2 a–1). The corresponding magnitude of the isotope composition changes is 20–30‰. With the δD-T s slope of 28‰˚C–1 established above, this implies that 11 year means of the annual temperature have varied over the past two centuries between –55 and –56˚C.
During the period of interest, snow accumulation rate decreased by –3 kg m–2 a–1 (20% of the total magnitude of 11 year means) and δD increased by 7‰ (nearly 30% of the total magnitude). The trend of deuterium content is statistically significant with the confidence level of 95%, which suggests a slight warming during the past two centuries. As shown in Reference Ekaykin, Lipenkov, Petit and Masson-DelmotteEkaykin and others (2003), a negative accumulation trend can be related to red noise caused by the drift of large snow relief forms. In order to establish the true climatic change of snow accumulation rate over the last 200 years, we collected additional accumulation data from six shallow cores (vk12, vk15, BH-1, BH-2, BH-4 and BH-8) drilled in the period 1985–96 (Fig. 1) in which the Tambora layer was detected. The mean accumulation rate at eight sites around Vostok (six boreholes and three deep pits; the values from vk12 and vk15 located close to each other were taken as one value) from 1816 to the present is found to be 20.6 ± 0.3 kg m–2 a–1. This is lower than the 21.5 ± 0.5 kg m–2 a–1 obtained for the period since 1955 from beta-radioactivity measurements at nine sites around Vostok, which implies a slight increase of snow accumulation rate during the last two centuries.
Conclusions
Based on meteorological, balloon-sounding and snow-accumulation data available for Vostok station, as well as published data on snow evaporation, we estimated the mean annual precipitation rate and determined the ratio of cloud precipitation to that from clear skies. From our estimates, the mean annual precipitation at Vostok is 26.1 ± 2.6 mm, 3 ± 1mm of the water evaporates during November– February, and 22.9 ± 1.8 mm contributes to the firn thickness formation. Roughly three-quarters of the annual precipitation originates from clear skies and only one-quarter from clouds. Taking into account the origin of the precipitation, the mean weighted condensation temperature at Vostok is –39 ± 1.1˚C.
As a result of stratigraphic and geochemical investigations in the deep pits, snow accumulation and isotope composition series were reconstructed for the period 1774– 1999. Linear relationships were established between the snow isotope composition and the air temperature at different levels in the atmosphere. The slope between δ and the air temperature at the top of the inversion layer (considered as the best approximation of the condensation temperature) was found to be about 6‰˚C–1, for both the intra- and interannual variations, which is 30% less than the value derived from simple isotope models.
Snow accumulation rate has varied during the past 200 years with a magnitude of 15 kg m–2 a–1, from 15 kg m–2 a–1 to 30 kg m–2 a–1. The magnitude of the temperature variations (for the 11 year means of the near-surface temperature) within the same period of time amounts to 1˚C (between –56 and –55˚C). Our results suggest a slight increase in temperature and accumulation rate in the Vostok region over the past two centuries.
One of the important results of the work is a 50 year cycle discovered in the high-resolution record from snow pits at Vostok. The variations of snow accumulation and isotope composition significantly correlate with the PDO index, which implies a teleconnection between the climates in central Antarctica and the tropical Pacific.
Acknowledgements
The authors are grateful to all the participants in the Russian Antarctic Expedition who helped with the fieldwork, and especially V. Solyanik, A. Antoshin and M. Gandriev for their aid in deep-pit digging; V. A. Persky for collecting the snow precipitation samples; J. F. Pinglot and M. Pourchet (LGGE) for providing the beta-radioactivity measurements; C. Alba, O. Cattani, S. Falourd, M. Stievenard (LSCE) and A. Boas (NBI) for assistance with isotope measurements; A. Bykova, D. Anufrieva, A. Zakharov, Yu. Popov (St Petersburg State University) and A. Preobrazhenskaya (AARI) for participating in creating the database of balloon-sounding data; D. Peel for valuable comments and corrections; and F. P. Chavez for providing the data on the PDO index. This work is a contribution to Project 4 of the Subprogram ‘Study and research of the Antarctic’, FTP ‘World Ocean’ of the Russian Federation and part of the Russian–French–Danish contribution to the ITASE project. The study was supported through INTAS grant 2001-2268.


