


Introduction
Surge-type glaciers undergo cyclical non-steady flow (e.g. Reference Meier and PostMeier and Post, 1969; Reference RaymondRaymond, 1987). A relatively short active phase (a few months to a few years), during which glacier velocity increases by at least an order of magnitude and advance of the glacier terminus usually takes place, punctuates much longer intervals of stagnation (tens to a few hundreds of years), during which the lower portion of the glacier thins and mass builds up in an upper, reservoir area. A further surge transfers this mass down-glacier once more. The geographical distribution of surge-type glaciers appears to be non-random (Reference PostPost, 1969). In the 36600 km2 of ice-covered area in Svalbard, for example, at least 132 glaciers representing ∼50% of the total glaciated area have been classified as surge-type (Reference Hagen, Liestøl, Roland and JørgensenHagen and others, 1993; Reference Jiskoot, Murray and BoyleJiskoot and others, 2000). However, in the more easterly Russian islands of FranzJosef Land, Severnaya Zemlya and Novaya Zemlya, with 55600 km2 of ice, very few glaciers appear to have undergone surge activity (Reference Dowdeswell and WilliamsDowdeswell and Williams, 1997).
The Canadian High Arctic islands, also known as the Queen Elizabeth Islands (QEI), contain almost 110 000 km2 of polythermal glaciers and ice caps (Reference Koerner and FultonKoerner, 1989) (Fig. 1). This is about 40% of the total area of Arctic ice outside Greenland (Reference DowdeswellDowdeswell, 1995), and 5% of the Northern Hemisphere’s ice cover (Reference Koerner and FultonKoerner, 1989). Ice covers 80500 km2 on Ellesmere Island, about 16200 km2 on Devon Island, and 11700 km2 on Axel Heiberg Island (Fig. 1). Despite the large number of outlet and valley glaciers on these islands, very few have been observed to surge (Reference Hattersley-SmithHattersley-Smith, 1964, Reference Hattersley-Smith1969; Reference MullerMuller, 1969; Reference OmmanneyOmmanney, 1969). However, no systematic study of these ice masses has been undertaken to investigate present and past surge activity.
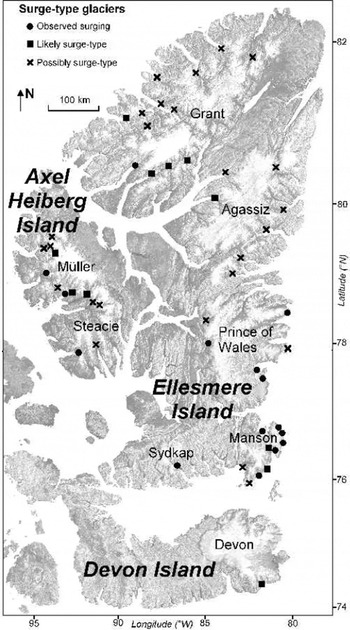
Fig. 1. Distribution of surge-type glaciers in the QEI identified in this study (base imagery from the RADARSAT Orthomosaic of Canada courtesy of the Canadian Centre for Remote Sensing). Icefield and ice-cap names are shown.
The aim of this paper is to assess the extent of surge behaviour of glaciers of the Canadian High Arctic islands. Recent field observations of glaciers in the active phase of the surge cycle are combined with earlier reports of surge activity, and supplemented by a systematic search of imagery of the ice masses on Ellesmere, Devon and Axel Heiberg Islands for indications of surge activity.
Methods
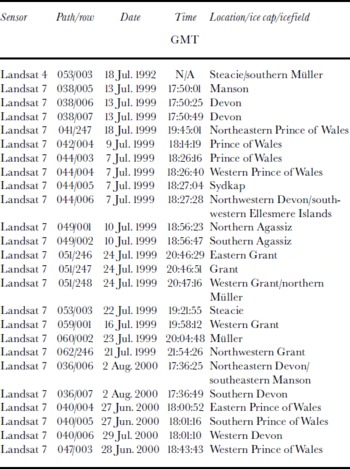
Digital satellite imagery from the Landsat 7 Enhanced Thematic Mapper Plus (ETM+) was used as the basis for a systematic search for criteria indicative of surges (Table 1). Summer imagery of the ice masses was acquired, because ice-surface features diagnostic of glacier surging are most clearly recognized on bare glacier ice. These features can be recognized readily on Landsat 7 imagery, which has a spatial resolution in panchromatic mode of 15 m (e.g. Reference Bindschadler, Dowdeswell, Hall and WintherBindschadler and others, 2001). The available imagery covers all glacierized areas of the QEI up to the northern limit of data acquisition at ∼81.5° N. An additional Landsat 4 image of southern Axel Heiberg Island from 1992 was used to further investigate the surging glaciers present in this area.
Table 1. Details of the Landsat imagery used in this study (see Fig. 1 for icefield and ice-cap locations)
The 1959/60 aerial photography database, consisting of ∼ 1 0 000 images, was produced by scanning all available 1: 60 000 scale vertical aerial photographs of Devon, Ellesmere and Axel Heiberg Islands. The majority of these photographs originated from the Canadian Glacier Inventory at the National Water Resources Institute in Saskatoon, Saskatchewan, Canada. These stereo photographs were originally taken by the Royal Canadian Air Force for the production of the first detailed maps of the Canadian High Arctic islands. Each grey-scale photo covers an area of approximately 10×10 km, and was scanned at 300 dpi resolution. Comparison was made between the aerial photography and Landsat 7 imagery for every glacier outlet and ice-marginal area in the region of interest. The only exception was northernmost Ellesmere Island beyond the coverage of Landsat 7 (approximately 5% of Grant Ice Cap), for which only the aerial photography was analyzed.
A number of features are regarded as indicators of whether or not glaciers and larger ice masses have surged during the residence time of the ice within a given drainage basin (Reference Meier and PostMeier and Post, 1969; Reference SturmSturm, 1987; Reference Williams, Hall and BensonWilliams and others, 1991; Reference Hambrey and DowdeswellHambrey and Dowdeswell, 1994). These include: (a) looped moraines, formed as fast-flowing, active-phase surge-type glaciers flow past less active or stagnant neighbours, and deform the medial moraines between them; (b) ice structures, and in particular foliation, deformed in a similar fashion to looped moraines; (c) a heavily crevassed surface, indicative of a glacier in the active phase of the surge cycle; (d) potholes on the glacier surface during the quiescent phase; (e) a rapid advance of a glacier terminus when surrounding glaciers are relatively stable in ice-margin position; (f) shear margins on the glacier surface, formed at the boundary between fast-moving surging ice and slower non-surging ice; (g) surface velocities which are typically an Remote order of magnitude or so higher than during the quiescent phase; (h) a strandline of ice on surrounding bedrock, formed when the glacier surface rapidly falls in elevation as a surge removes ice from the basin; and (i) a highly digitate tidewater terminus (i.e. a terminus which is markedly splayed by longitudinal crevasses) for actively surging glaciers that flow into the ocean.
Most of these features can occur on non-surge-type glaciers, but the presence of many of the features together is suggestive of surge behaviour. Marked velocity changes, heavy crevassing and rapid terminus retreat can also occur on glaciers during the tidewater glacier cycle (Reference Meier and PostMeier and Post, 1987), when they are not related to surging. Consequently, on tidewater glaciers in our study area, we used additional evidence such as rapid terminus advance, looped surface moraines, deformed ice structures, potholes and strandlines to define a glacier as surge-type.
Each satellite image and the corresponding aerial photographs were examined systematically, in segments of up to approximately 100 km2, for the presence of surge features. This search was supplemented by direct visual observations of the glaciers and ice caps over much of Ellesmere and Devon Islands, made during 445 hours of flying, representing about 6000 km of flight tracks. This work was undertaken in April 2000, primarily to obtain radio-echo sounding data on ice thickness and surface and bed topography for another project. During the airborne programme, visualobservations were made throughout, and the locations and descriptions of any ice-surface features indicative of possible surge activity were logged.
Where glaciers were thought to be surging, IMCORR software (Reference Scambos, Dutkiewicz, Wilson and BindschadlerScambos and others, 1992) was used to determine ice velocities when repeat clear-sky Landsat 7 coverage was available for both 1999 and 2000. IMCORR takes two orthorectified images as input, and attempts to match small subscenes to determine displacements. The highest correlation index between subscenes within a specified search radius provides the best estimate of surface velocity and direction. Image correlation results are reported here only when velocity vectors displayed a consistent pattern across the glacier surface.
Few glaciers in the study area are named, so, to facilitate description, nearby features were often used to generate unofficial names. Table 2 indicates where such unofficial names have been used and in the text all unofficial names are initially identified by inverted commas. Official names were verified against the master record held by the Canadian Permanent Committee on Geographical Names website (http://geonames.nrcan.gc.ca). In Table 2, reference is also made to the inventory number (where available) for each glacier provided in the Glacier Atlas of Canada (Reference OmmanneyOmmanney, 1989). Due to space limitations, most of this discussion focuses on glaciers that have been observed in the active phase of the surge cycle.
Table 2. List of surge-type glaciers in the QEI (* indicates unofficial name)
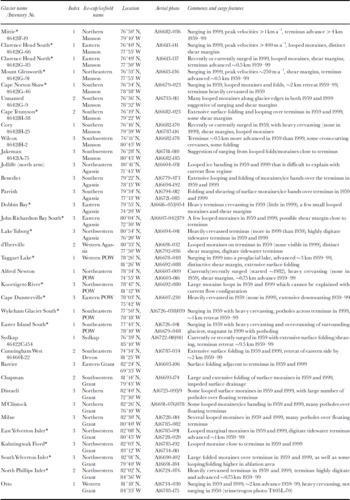
Table 2. List of surge-type glaciers in the QEI (* indicates unofficial name)

Results
To provide an indication of the likelihood that a glacier is surge-type, we classified all glaciers in the QEI into one of four categories (similar to Reference HamiltonHamilton, 1992):
-
1. Confirmed surging: active surge phase observed, many distinct surge features
-
2. Likely to have surged: many distinct surge features, but active phase not observed
-
3. Possible: a few surge features present, and active phase not observed
-
4. Non-surge: no surge features present.
Most glaciers from the Canadian High Arctic islands were of non-surge type, but 51 were identified as surge-type (Fig. 1; Table 2). Of these, 15 were observed in the active phase and classified as type 1; 11 were classified as type 2 (likely surge-type); and 25 were classified as type 3 (possibly surge-type). This provides a conservative estimate of the number of surge-type glaciers in the Canadian High Arctic, as the surge features are not always easy to identify, and a glacier must have surged relatively recently to produce diagnostic remnant surge features. For example, glaciers which were actively surging in 1999/2000 often showed little evidence of surging in 1959/60 imagery.
Manson Icefield
The highest concentration of glaciers observed in the active phase of the surge cycle occurs around the north and east coast of Manson Icefield, southeast Ellesmere Island (Fig. 1; Table 2). This is one of the smaller icefields in the study area, and no surge-type glaciers have previously been described from this area.
“Mittie” Glacier, draining north from Manson Icefield, is the largest glacier observed to be actively surging in the QEI, with a drainage area of approximately 2000 km2.The glacier surface was relatively undisturbed and uncrevassed in 1959/60, but very heavily crevassed in 1999 and 2000. Observations by one of the authors (J.A.D.) during an overflight in April 2000 confirmed that the crevassing extended from the terminus into the accumulation basin about 30 km up-glacier. The tributary glaciers to the east and west were also crevassed, in many cases right to their headwalls. There is evidence of surface lowering of 10–25 m around 15–20 km from the margin, as indicated by a strandline. The glacier has advanced 44km northward into Smith Bay across a 9 km wide terminus relative to its position in 1959/60, and the inner part of Smith Bay contains large numbers of icebergs. The icebergs vary in shape from tabular to highly irregular, reach >0.5 km in width, and are larger and more numerous than those seen from other non-surging tidewater glaciers in this region. Image correlation between Landsat 7 imagery from 7 July 1999 and 2 August 2000 indicates that maximum velocities reached ∼1kma–1 approximately 20 km up-glacier from the terminus, with velocities in most areas >600ma–1.
Three actively surging glaciers along the eastern margin of Manson Icefield (from north to south: “Mount Glenworth”, “Clarence Head North” and “Clarence Head South” all show similar changes since 1959/60. Their surfaces have changed from smooth to heavily crevassed, there are distinct shear margins between fast-moving ice in the glacier centre and non-surging ice towards the glacier edges in 1999/2000, their tidewater termini have advanced by ∼0.5 km, and their termini are now markedly digitate (Fig.2a and b). Image correlation indicates that peak velocities on Mount Glenworth Glacier were >250ma–1 in 1999/2000. Good image-correlation results could not be obtained for Clarence Head North Glacier, which suggests either that the glacier surface is too broken up for comparison, or that the ice motion is too low for detection because the glacier has recently stopped surging. On Clarence Head South Glacier, a very clear pattern of surface velocities was determined by IMCORR, with distinct shear margins on either side of the main fast-moving ice body (Fig. 2c). Velocities near the equilibrium line reached a peak of almost 400 m a–1, and gradually decreased to a velocity of ∼100 m a–1 close to the terminus. For comparison, typical mean annual surface velocities on large valley glaciers in the Canadian High Arctic are 20–40ma–1, although summer velocities on valley glaciers may reach twice these (Reference IkenIken, 1974; Koerner, 1989; Reference CoplandCopland, 2001).
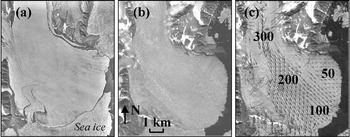
Fig. 2 “clarence head south” glacier (76° 40’ n, 77° 55’ w): (a) in 1959 aerial photography (© a16613-141, 7 july 1959); (b) in 1999 landsat 7 imagery (path 038, row 005, 13 july 1999); (c) surface parallel velocities (m a–1) determined from image correlation between 1999 and 2000 landsat 7 imagery (path 038, row 005,13 july 1999; path 036, row 007, 2 august 2000). large, localized vectors with anomalous flow directions indicate locations where the image correlation software did not correctly match the two images, and should be ignored.
Two other glaciers on Manson Icefield were observed in the active phase: “Cape Norton Shaw” and Cory Glaciers. Both of these were surging in 1959/60, when their respective termini were ∼2 and ∼0.75 km more advanced than today. They currently appear to be in the quiescent phase, with relatively smooth and uncrevassed surfaces compared to heavily crevassed surfaces in 1959/60. Looped surface moraines and looped ice foliation are evident in both the aerial photography and Landsat imagery of these glaciers.
Sydkap Ice Cap
Only one glacier on Sydkap Ice Cap was identified as surge-type. Sydkap Glacier, flowing into South Cape Fiord, appearsto have been surging in 1959/60, but its tidewater terminus has retreated ∼9.5km since then. This is one of the largest retreats of any glacier reported in the Canadian High Arctic, and Reference Koerner and FultonKoerner (1989) states that ∼6.5 km of retreat occurred between 1957 and 1974. This glacier has not previously been mentioned as surge-type, although extensive surface folding, shearing and crevassing are evident in the aerial photography. It is also possible that this retreat occurred as part of the tidewater glacier cycle, although the features such as surface folding and shearing suggest that surging is a more likely explanation.
Prince of Wales Icefield
Alfred Newton Glacier on the eastern side of Prince of Wales Icefield, and “Taggart Lake” Glacier on the western side of the icefield, are both currently surging but were not surging in 1959/60.W. Blake, Jr and E. Blake (personal communication, 2000) made observations of Alfred Newton Glacier from nearby Cape Herschel. The previously relatively unbroken surface of this glacier became crevassed and the glacier began to advance in summer 1982. The digitate tidewater terminus is currently advanced ∼0.75 km from its 1959 position. Landsat 7 imagery from summer 1999 shows that the entire glacier is still crevassed, especially high up in the accumulation area. No velocity measurements are available for the glacier, but the implication of these observations is that the glacier has remained active for at least 17 years.
Taggart Lake Glacier was observed to be surging by one of the authors (M.J.S.) during an overflight in May 1999, when a heavily crevassed surface, extensive surface looping and folding, and distinctive shear margins were apparent. The glacier terminus is currently advanced ∼ 3 km from its 1959/60 position, resulting in the almost complete filling of the large proglacial Taggart Lake that used to exist in front of the glacier. This glacier is somewhat unusual in comparison to the other surge glaciers identified in the QEI because its terminus is not well confined within a valley, but is rather a part of the broad western margin of Prince of Wales Icefield (Fig.1).
In the southeast part of the icefield, two nearby glaciers (“Wykeham Glacier South”and“Easter Island South”) were observed to be surging in the 1959/60 aerial photography, but were not surging in 1999. Both of these glaciers form part of a large ice lobe that dominates the southeast part of Prince of Wales Icefield, and are not well constrained by surrounding bedrock. They were heavily crevassed across their termini in the earlier imagery, compared to a markedly potholed surface in 1999. Easter Island South Glacier also over-ran an adjacent outlet ice lobe to the south in 1959/60 and prevented it reaching the ocean, whereas today the glacier has retreated by ∼1–2 km and the adjacent ice lobe is now able to reach the ocean.
Grant Ice Cap
Otto Glacier, which flows southwestwards from Grant Ice Cap, was reported to be surging by Reference Hattersley-SmithHattersley-Smith (1964, Reference Hattersley-Smith1969). The surge reportedly began between 1950 and 1959 when the lower 25 km of the glacier became highly crevassed, all traces of surface melt streams were obliterated and the previously grounded terminus over-rode stagnant marginal ice and entered tidewater as it advanced ∼ 3 km into Otto Fiord. By 1964 the glacier had advanced a further 2–3 km from its 1959 position. A maximum ice-surface velocity of 7.7md–1 (equivalent to 2.8 kma–1) was measured over a period of 41 days in July–August 1959 (Reference Hattersley-SmithHattersley-Smith, 1969). This surge may be continuing, or a further surge may have occurred, as the glacier surface is still highly crevassed in the 1999 Landsat 7 imagery, and the terminus is digitate and in a similar position to 1964. Unfortunately no repeat Landsat 7 imagery is available for this location, so it has not been possible to determine present-day velocities. The active phase of this surge lasted a minimum of 5 years (between 1959 and 1964) and maybe as long as 50 years.
Several other glaciers close to Otto Glacier also appear to be surge-type, but have been classified as type 2 because their active phase has not been observed (Table 2; Fig. 1). The most notable are “East Hare Fiord” Glacier and Chapman Glacier, which were both mentioned by Reference Hattersley-SmithHattersley-Smith (1969) as possible surge-type glaciers. These large glaciers display extensive folding and looping of moraines and ice foliation over their terminus areas in both the aerial photography and Landsat 7 imagery. Chapman Glacier also displays impeded surface drainage similar to that described by Reference SturmSturm (1987) for surge-type glaciers in Alaska.
Muller and Steacie Ice Caps
Along the west coast of Axel Heiberg Island, three large glaciers appear to be surging at present, and all have advanced significantly since 1959/60. Reference MullerMuller (1969) discussed the surge of “Good Friday Bay” Glacier, and Reference OmmanneyOmmanney (1969) mentioned that Iceberg Glacier (and tributary Finsterwalder Glacier) displayed evidence of a past surge. The surge of “Airdrop Glacier” has not previously been reported, however, and Iceberg Glacier has surged since Reference OmmanneyOmmanney’s (1969) report.
Reference MullerMuller (1969) reports that the lowermost 2 km of the 650 km2 Good Friday Bay Glacier became crevassed and advanced by 600 m between 1952 and 1959. From 1959 to 1964 the glacier terminus advanced a further 650 m, with a large increase in the number of crevasses. Between 4 and 6 km up-glacier, surface lowering was suggested by a rim of ice some 10–15m above the glacier surface. The maximum annual velocity over this period was >250 ma–1. The terminus advanced a further 600 mbetween1964 and 1967, and by a further 200 m between August 1967 and April 1969. The 1992 Landsat 4 imagery indicates that the terminus had advanced by ∼ 7 km from its 1959 position, or approximately ∼5.5km from its last recorded position in 1969. By 1999 the glacier had advanced by a further ∼100 m since 1992, infilling ice-marginal lakes in the process. It appears to still be surging in 1992 and 1999 as it is heavily crevassed across its terminus, with marked looping of surface moraines and ice foliation. Reference MullerMuller’s (1969) measurements indicate that the active phase lasted for a minimum of 10 years, but the observations presented here suggest that the active phase may have lasted for 40 years or more. Without further imagery from the period 1969–92, it is not possible to ascertain whether the glacier went through a quiescent phase during this period.
Airdrop Glacier, one of the few currently surging glaciers in the QEI which terminates on land rather than in marine waters, has advanced by ∼4.5km since 1959/60 (Fig. 3). The glacier terminus was heavily crevassed in 1999 Landsat 7 imagery, and extensive surface folding and looping are apparent in both the 1999 imagery and the aerial photography. Unfortunately, this glacier is out of the range of the 1992 Landsat 4 imagery.
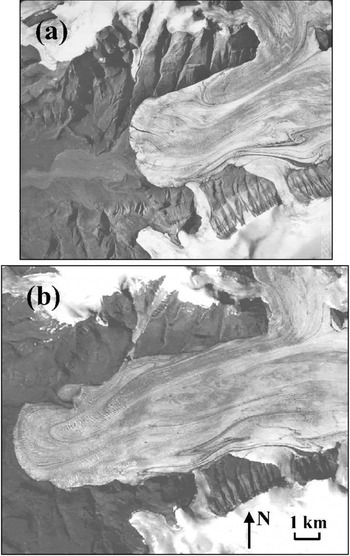
Fig. 3 the terminus of “airdrop glacier”, western muller ice cap (79°50’ n, 93°40’ w): (a) in 1959 aerial photography (© a16755-052, 28 july 1959); (b) in 1999 landsat 7 imagery (path 060, row 002, 23 july 1999). terminus has advanced ∼4.5 km between the two images.
The tidewater terminus of Iceberg Glacier, to the south of Airdrop Glacier, advanced by ∼3.5km between 1959/60 and 1992, and by a further ∼1.5 km between 1992 and 1999 (Fig.4). This implies an active phase lasting at least 7 years, and probably much longer. The glacier surface is heavily crevassed with large looped moraines in both the 1992 and 1999Landsat imagery, and some near-terminus surface features have been displaced by ∼ 4 km over this period. This equates to a mean annual velocity of approximately 575 ma–1. In the 1959/60 aerial photography the glacier surface is largely uncrevassed, but very heavily potholed. The potholing is the most extensive observed on any glacier during this analysis, and it extended for a distance of at least 10km up-glacier from the position of the terminus in 1959/60.
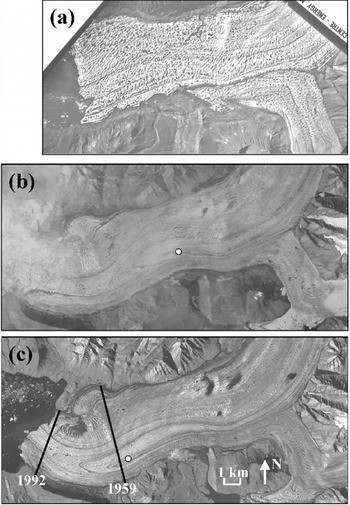
Fig. 4 the terminus of iceberg glacier, western muller ice cap (79˚28’n, 92° 15’ w): (a) in 1959 aerial photography (© a16754-105, 7 july 1959); (b) in 1992 landsat 4 imagery (slightly cloudy) (path 053, row 003,18 july 1992), (c) in 1999 landsat 7 imagery (path 053, row 003,22 july 1999); lines mark approximate location of terminus from (a) and (b) white dot in (b) and (c) marks location of the same point in 1992 and 1999: displacement is ∼4 km.
Long duration of the active phase in the Canadian High Arctic and Svalbard
In discussing the behaviour of Good Friday Bay Glacier, Reference MullerMuller (1969) pointed out that the long active phase (at least 10 years) inferred for this glacier implied that the dynamics of this glacier differed from those which are characteristic of “a classical surge”. It is clear that many surge-type glaciers at lower latitudes have a much shorter active phase than Good Friday Bay glacier (Reference Dowdeswell, Hamilton and HagenDowdeswell and others, 1991). However, the evidence presented above for surges lasting up to 50 years indicates that the behaviour of Good Friday Bay Glacier may not be unusual for surging glaciers in the Canadian Arctic archipelago. Reference MullerMuller (1969) concluded that long active phases might be a characteristic of subpolar surge-type glaciers, which contain cold ice close to the surface and sometimes at a thin margin, but may be at the pressure-melting point nearer to the bed. Glaciers with this thermal structure, sometimes referred to as polythermal glaciers, are also found in the Svalbard archipelago (Reference SchyttSchytt, 1969; Reference Dowdeswell, Hamilton and HagenDowdeswell and others, 1991). Observations from eight Svalbard glaciers show that they too have an active phase of long duration relative to surge-type glaciers in, for example, Iceland, the Pamirs and parts of Alaska (e.g. Reference Dowdeswell, Hamilton and HagenDowdeswell and others, 1991; Reference Murray, Dowdeswell, Drewry and FrearsonMurray and others, 1998). Observations by Reference Jiskoot, Pedersen and MurrayJiskoot and others (2001), however, indicate that polythermal Sortebræ, East Greenland, has short active and quiescent phases similar to those observed on Alaskan surge glaciers.
In addition to possible thermal controls on surge behaviour, several workers have postulated a relationship between climate and the duration of the surge cycle. Reference Eisen, Harrison and RaymondEisen and others (2001) argued that the duration of the quiescent phase of the surge cycle at Variegated Glacier, Alaska, was determined by the time required to achieve a critical cumulative accumulation in the upper regions of the glacier. Thus the interval between surges was inversely related to the net balance in this region. Similarly, Reference Dowdeswell, Hodgkins, Nuttall, Hagen and HamiltonDowdeswell and others (1995) argued that surging had become less common in Svalbard during the 20th century because of a climatically induced shift to negative mass balance, which had lengthened the quiescent phase of the surge cycle. There is some evidence that in high-accumulation regions where the duration of the surge cycle is relatively short, the active phase of the cycle is both short and intense (e.g. southeast Alaska; Reference LawsonLawson, 1997). In regions of lower accumulation, however, such as Svalbard and the Canadian Arctic, surges appear to be more long-lived and less intense (Reference MullerMuller,1969; Reference Dowdeswell, Hamilton and HagenDowdeswell and others, 1991). Discussion of the physical mechanisms that might explain this apparent linkage between mass balance and surging dynamics is, however, beyond the scope of this paper.
Conclusions
From an analysis of 1959/60 aerial photography and 1999/ 2000 Landsat 7 imagery, 51 potential surge-type polythermal glaciers have been identified in the Canadian High Arctic. Fifteen of these have been observed in the active phase. The data available suggest that the duration of the active phase of the surge cycle on glaciers in this region is relatively long, perhaps reaching as much as 50 years. The distribution of surging glaciers in the QEI appears to be non-random, as most of the surge-type glaciers identified are large tidewater valley glaciers draining to coastal areas with relatively high snowfall. Not all of the glaciers that occur in these areas are surge-type, however, so some other as yet unknown controls must also determine whether or not a glacier will surge.
Plans for future work include a more comprehensive analysis of the characteristics of surge basins (e.g. geology, slope, area, aspect and ice thickness). A search for imagery for the period 1960–99 is also planned, as this will permit improved estimates of the length of the active phase of the surge cycle in the Canadian Arctic.
Acknowledgements
This study was funded by U.K. Natural Environment Research Council grant NER/A/S/1998/00015 to Dowdeswell, and by grants from the Natural Sciences and Engineering Research Council, Canada, Environment Canada (MSC-CRYSYS program) and the Canadian Space Agency (Climate and Cryosphere Initiative) to M. J. Sharp. We gratefully acknowledge C. S.L. Ommanney, R. Mackay, T. D. Prowse and the National Water Research Institute, Saskatoon, for providing us with access to the aerial photography. A. S. Dyke (Geological Survey of Canada) made available additional aerial photography of the Devon Ice Cap. G. Wolken, D. Burgess and K. Filbert assisted with the scanning. H. Jiskoot and M. Truffer provided helpful reviews of the manuscript. The aerial photographs in Figures 2a, 3a and 4a © 1959 Her Majesty the Queen in Right of Canada, reproduced from the collection of the National Air Photo Library with permission of Natural Resources Canada.


