


Introduction
The physical characteristics of the soils of the McMurdo Dry Valleys (MCM), southern Victoria Land, Antarctica, have been investigated for almost 50 years (e.g. Reference Campbell and ClaridgeCampbell and Claridge, 1987). In a recent survey, Reference BockheimBockheim (2002) found that ∼42% of the soils that he examined in the MCM contained dry permafrost (1–3% water) to a depth of ≥100 cm. In Taylor Valley (Fig. 1), dry permafrost is pervasive in soils older than 1Ma Reference Bockheim(Bockheim, 2002). The younger soils in Taylor Valley contain ice-cemented permafrost, and 13% of all the sites evaluated by Reference BockheimBockheim (2002), predominantly in locations near coastal areas and on the floor of lower Taylor Valley, also contain massive ice.

Fig. 1. Map of Taylor Valley, Antarctica.
The MCM long-term ecological research (LTER) site was established in 1993 to assess the impact of climate and climate change on the structure and function of ecosystems, primarily in Taylor Valley. Understanding the production, transport and accumulation of liquid water is key to understanding the functioning of the MCM ecosystem. In these systems, small changes in climate can have a great impact on the ecosystem through the change of state of H2O between ice and water. The coupling between climate, hydrology and biology in the MCM ecosystem may be tighter than in any other system on the planet (Reference LyonsLyons and others, 2001). As part of the MCM-LTER program, meteorological measurements, glacier mass-balance, stream-discharge and lake-level measurements have been made to quantify the hydrologic cycle within the sub-basins of Taylor Valley (Reference FountainFountain and others, 1999; Reference McKnight, Niyogi, Alger, Bomblies, Conovitz and TateMcKnight and others, 1999; Reference DoranDoran and others, 2002b). In addition, soil manipulation experiments have been established to simulate the effects of changing climate and nutrient conditions on the soil ecosystems (Reference Wall and VirginiaWall and Virginia, 1999).
In this paper, we describe a serendipitous observation related to our ongoing hydrologic monitoring and soil experiments. From 1993, the beginning of the MCM-LTER monitoring, through 2000, stream-flows were low and lake levels dropped. This record was extended back to 1986 using pre-MCM-LTER data and indicated that the hydrologic cycle of Taylor Valley was responding to a 0.7˚C per decade cooling over this period (Reference DoranDoran and others, 2002a). However, examinations of historical records from the MCM reveal decadal warm events with periodic high flows in the Onyx River in Wright Valley (the next valley north of Taylor Valley) (Reference McKnight, Niyogi, Alger, Bomblies, Conovitz and TateMcKnight and others, 1999). The drivers of these periodic warm years are not currently known (Reference Wharton, Crosby, McKay and RiceWelch and others, 2003). In the 2001/02 austral summer, a significant warming event occurred in the MCM, which has been referred to as ‘the year of the flood’ (Reference Foreman, Wolf and PriscuForeman and others, 2004). During this summer (December–February), the average air temperature at the Lake Bonney meteorological station was –1.7˚C, well above the –3.9˚C experienced the previous summer. Temperatures above 10˚C were measured and the annual stream discharge for gauged sites in the MCM was 33 times that of the previous year (Doran, unpublished information).
Study Site
Taylor Valley, a glacially carved valley trending northeast–southwest, is a mosaic of glaciers, soils, exposed bedrock, ephemeral streams and perennially ice-covered lakes. The three major lakes in Taylor Valley are closed-basin systems, which are filled with meltwater from the glaciers within each basin. Lake Bonney is divided into two lobes, east and west, separated by a sill at 13m deep in the lake, an extension of Bonney Riegel (Fig. 2). The primary source of water to Lake Bonney comes from Taylor and Rhone Glaciers (Fig. 1), although there is also flow from Hughes, Sollas, Matterhorn, LaCroix and Suess Glaciers (Reference FountainFountain and others, 1999). The mean annual temperature in the Lake Bonney basin (Fig. 1) from 1993 to 2000 is –17.9˚C and annual precipitation is about 10cm or less (Reference DoranDoran and others, 2002b). Long-term datasets of both physical and biological information collected by MCM-LTER scientists can be accessed at http://huey.colorado.edu/LTER.

Fig. 2. Digital elevation model (DEM) of the Lake Bonney basin. The channels for Vincent (VC), Bartlette (BC) and Wormherder Creeks (WHC) have been added. The location of Bonney Riegel (BR) is noted. The DEM of the site was created from airborne laser altimetry data collected by NASA’s Airborne Topographic Mapper (ATM) system in December 2001. The ATM system is a conical scanner measuring the surface elevation along consecutive ellipses on the ground. After the removal of outlier observations the irregularly spaced dataset was interpolated into a regular grid with 2 m resolution. The elevations are referenced to the World Geodetic System 1984 (WGS84) ellipsoid, and their estimated absolute vertical accuracy is in the order of 0.2 m.
The focus of this study is in the southern part of the Lake Bonney basin. Throughout the MCM-LTER period, we measured the major-ion and nutrient geochemistry of Vincent Creek (VC) and Bartlette Creek (BC), the two streams that flow from Hughes Glacier (Fig. 2). During the 2001/02 austral summer, we noticed flow of water on the west of Bonney Riegel during soil collection at a previously established plot. This feature, termed ‘Wormherder Creek’ (WHC), appeared to be produced by groundwater seepage. The soil experiment was established in December 1999, and MCM-LTER personnel in this location had not previously observed water. The detailed topographic map clearly demonstrates a channel feature trending almost due east then northeast prior to entering the soil plot (Fig. 2). The elevations of the soil plots are 105–113ma.s.l. This location is in the transition region between zones 1 (coastal) and 2 (intermediate) as defined by the conceptual geomorphologic model of Reference Marchant and DentonMarchant and Denton (1996). Their approach to MCM landscape evolution is based on differences in climate and soil-moisture content. In zone 2 (above ∼100m in the Lake Bonney region) streams are largely restricted to the north-facing slopes with high soil moisture content. The soils in this region of the Lake Bonney basin were developed on tills from the Taylor II glaciation and have ages of 74–98 kyr as summarized in Reference Burkins, Virginia, Chamberlain and WallBurkins and others (2000). In this region the water content of the top 10cm of soils is <1% and the depth to permafrost is 35–45cm (personal communication from J.E. Barrett, 2002). The site itself is rather flat-lying. However, the source of the seep is at greater elevation at a much greater slope that we estimate at >10%.
Analytical Methods
Water samples were collected using pre-cleaned polyethylene bottles and were filtered within 24 hours of collection using 0.4 μm pore-size Nuclepore1 polycarbonate membrane filters and clean plastic filter towers. The methods have been previously documented in detail and will not be repeated here (Reference Lyons and WelchLyons and Welch, 1997; Reference LyonsLyons and others, 2002). Anions (F–, Cl–, SO4 2–, NO3 –) and cations (Na+, K+, Mg2+, Ca2+, Li+) were analyzed by ion chromatographic (IC) techniques (Reference Welch, Greenland, Good-in and SmithWelch and others, 1996). Reactive silicate (i.e. Si) was analyzed using a standard colorimetric method (Reference Pugh, Welch, Lyons, Priscu and McKnightPugh and others, 2002). Alkalinity was determined via charge balance. The precision of the IC measurements, determined as the average per cent difference between duplicates, was 1% for Cl, Na, K, Mg and Ca, 5% for Li and SO4 and 10% for F and NO3, while that of the Si measurements was <2%. Because there are no other major chemical species contributing to the alkalinity, and the pH of the stream waters ranges from 6.2 to 8.7 with a mean of 7.2, we will refer to the alkalinity as HCO3 –.
Results
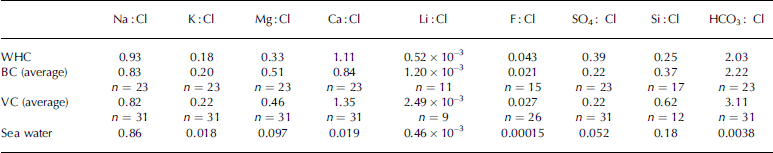
Table 1 shows the solute data for the groundwater seep at WHC and for the streams flowing from Hughes Glacier (Figs 1 and 2). The amount of total dissolved solids (TDS) for WHC is 203 mgL–1, twice that of VC, 99mg L–1, and >6 times that of BC, 32 mgL–1, for samples collected during the same time period, January 2002. The molar ratio of cations and anions to chloride is shown in Table 2. Solute : Cl ratios are extremely useful in comparing the geochemistry of the aquatic systems in the MCM, as they indicate evolutionary paths of the waters and suggest geochemical and biogeochemical processes (Reference Lyons, Welch, Neumann, Moorhead, McKnight and PriscuLyons and others, 1998). For example, the Na : Cl and SO4 :Cl ratios of the seep waters are higher than those of the streams, but the Mg: Cl and HCO3 : Cl ratios are lower, indicating a different source of solutes to the seeps (Table 2). The seep water is depleted in Li and Si and enriched in F relative to Cl, compared to the average stream waters from Hughes Glacier (Table 2). The ratios of Mg, Ca, Li, F, SO4, Si and HCO3 to Cl in both the seep and the stream waters are greater than those of sea water (Table 2), implying a probable aerosol enrichment and/or a weathering source of these elements and compounds to both the seep and stream waters (e.g. Reference Nezat, Lyons and WelchNezat and others, 2001; Reference LyonsLyons and others, 2003).
Table 1. Major-ion concentrations for WHC, VC and BC for samples collected in January 2002. Alkalinity was calculated based on the charge balance

Table 2. Molar ratios for streams on the north-facing slope of the Lake Bonney basin and for sea water. Averages for BC and VC are for all samples collected from 1993 to 2003
Discussion
Geochemistry the source of solutes
The higher TDS in the seep waters suggest that the initial permafrost had a high solute concentration or that the solutes were gained as the water flowed through ground that had accumulated salts since the previous flow period. Previous work has demonstrated that permafrost in the top few meters of the Taylor Valley floor has low TDS (Reference Stuiver, Yang, Denton, Kellogg and McGinnisStuiver and others, 1981). However, permafrost at higher elevations within the MCM can have TDS values as high as 6900 mgL–1 (Reference Dickinson and RosenDickinson and Rosen, 2003). The physical and chemical properties of soils vary greatly with elevation within Taylor Valley; higher TDS and lower moisture are found at higher elevations (Reference Powers, Ho, Freckman and VirginiaPowers and others, 1998). Dry permafrost soils accumulate salts from aerosol deposition through time and can be significant sinks of easily dissolved salts when wetted (e.g. Reference Lyons and WelchLyons and Welch, 1997). We are unable at this time to distinguish between the two potential sources of enhanced solute concentration in the seep waters. However, the shallower permafrost at elevation is enriched in SO4 relative to Cl, similar to the WHC waters, implying that melting permafrost might be a significant source of solutes to these waters. Lack of Li enrichment might also indicate a minor influence of salt dissolution via soil wetting (Reference Lyons and WelchLyons and Welch, 1997). The WHC waters are depleted in Ca and enriched in Mg compared to the permafrost data of Reference Dickinson and RosenDickinson and Rosen (2003). However, these higher relative Mg concentrations might be explained by the differences in the local geology. The Lake Bonney basin has numerous volcanic cones of the McMurdo Volcanic Group within its boundary, and the weathering of these materials may be the source of the observed ‘excess’ Mg in both the seep and stream waters. In addition to the high SO4 : Cl values, WHC is slightly enriched in Na relative to the sea-water ratio of Na : Cl, but Hughes Glacier melt streams are slightly Na-depleted (Table 2). This suggests that dissolution of mirabilite (Na2SO410H2O) might be an important process in controlling the chemical composition of the seep waters. Reference WilsonWilson (1979) initially proposed that, due to the variations in relative humidity with elevation in the MCM and deliquescent properties of the salts, phases such as mirabilite should precipitate and be removed from melted snow within the valleys at higher elevations, leaving the resultant fluid enriched in Ca, Mg and Cl. The fluid is cryoconcentrated by sublimation and subsequent salt freeze-out. This fluid may then migrate along micro-channels, remaining unfrozen even in the colder parts of the year due to high salinity (Reference Dickinson and RosenDickinson and Rosen, 2003). If Wilson’s model is correct, the higher-elevation soils of the MCM could be a major sink of salts such as mirabilite and consequently could be a major source of Na and SO4 when the permafrost and ground ice melt.
Besides the solutes arising from salt dissolution, seep waters also contain 0.183mM Si (Table 1), one of the highest Si concentrations ever observed in an Antarctic stream or river (Reference Lyons, Welch, Neumann, Moorhead, McKnight and PriscuLyons and others, 1998; Reference Pugh, Welch, Lyons, Priscu and McKnightPugh and others, 2002) and which can be accounted for only through the chemical weathering of silicate minerals. It is not clear how this weathering occurs within the permafrost. However, the concentration observed and the very short flow period of the surface manifestation of the seep suggest some in situ generation of dissolved Si within the permafrost zone. The kinetics of alumino-silicate weathering are too slow to have generated these high Si values via soil–water interactions as the seep flowed from its source to our soil plot location. Reference Dickinson and RosenDickinson and Rosen (2003) have argued that brine films originating from the cryoconcentration and sublimation of snow can form and seep or diffuse downward. They argue that this concentrated brine is ‘chemically active’ and reacts with both ice and mineral grains along microchannels. It is plausible that this residual brine within the permafrost may weather silicate minerals in situ (Reference Dickinson and RosenDickinson and Rosen, 2003) and produce H4SiO4 that is transported during melt.
Temperature: threshold of permafrost melting
Figure 3 shows the time series of temperature for 0, 5 and 10cm depths in the soils in the Lake Bonney basin. These temperatures represent the average temperature over the 10 day period 1–10 January for each of the years shown. Soil temperatures recorded during the first 10 days in January 2002 are the warmest observed during that same time period since the Lake Bonney meteorological station was established in 1995 and indicate ∼1˚C higher temperature at 10 cm than observed over the previous decade. This increase in soil temperature must lead to increased permafrost/ice melt at depth.

Fig. 3. Soil temperatures recorded at the Lake Bonney meteorological station for 0, 5 and 10 cm soil depth, representing the average temperature over the 10 day period 1–10 January for each of the years shown.
Soil temperature modeling
A mathematical model of soil temperature is used which includes both conduction from one soil depth to the next and heat storage within the soil (Reference Campbell and ClaridgeCampbell, 1977):
where T is mean annual temperature, A(0) is the amplitude of the surface temperature, z is depth, t is time, ![]() is the damping depth, κ is the thermal diffusivity of the soil and ω is the angular frequency of oscillation given by 2π/τ, where τ is the period of oscillation (365 days for an annual cycle).
is the damping depth, κ is the thermal diffusivity of the soil and ω is the angular frequency of oscillation given by 2π/τ, where τ is the period of oscillation (365 days for an annual cycle).
T and A(0) were set to –17˚C and 26˚C, respectively, based on inspection of surface soil temperature data from Lake Bonney station for the period 1 April 2001 to 31 March 2002. Thermal conductivity of the soil was set at 0.2 mm2 s–1 based on the assumption of a dry soil (<1% gravimetric). We assume the soil does not contain ice near the surface and that melt that produces the springs is generated when the melting isotherm penetrates to the ice table depth. The model compares quite well with the actual Lake Bonney meteorological station soil temperature from 10cm depth (Fig. 4). The depth of thaw can also be determined for the 2001/02 austral summer using the model (Fig. 5). The model results indicate that from early to mid-December the top of the permafrost depth at this site would have begun to thaw and that thaw continued into early February 2002. The maximum depth of thaw extended to ∼60 cm and lasted for ∼10 days (Fig. 5).

Fig. 4. Fit of temperature model (dashed curve) with actual Lake Bonney meteorological station soil temperature data from 10 cm depth (solid curve).

Fig. 5. Depth of thaw calculated from Equation (1) for summer 2001/02.
Geomorphology of the seep channel: inferences of past flow events
Figure 6 shows the soil plot at WHC with water flowing through it. This area looks very different from the surrounding soil where no water flow has been observed. Reference AlgerAlger and others (1997) and Reference McKnight, Niyogi, Alger, Bomblies, Conovitz and TateMcKnight and others (1999) noted the geomorphologic differences of streams within Taylor Valley and discussed how they influenced the ecological processes within the stream channels. They argued that stream channels with stone pavements, similar to those seen in WHC, are the result of periglacial processes acting over long periods of time (Reference McKnight, Niyogi, Alger, Bomblies, Conovitz and TateMcKnight and others, 1999). The ice-thaw activities occurring within the saturated alluvium across the stream channel create a similar stone pavement appearance by rotating the rocks until the flat side is upward (McKnight and others, 1999). This process, which occurs across the expanse where water flows, wedges the rocks together, creating the appearance of a flat pavement (McKnight and others, 1999). Therefore in order to develop stone pavements in regions where sediment is constantly being supplied, the feature must be wetted on at least a sporadic basis. Reference McKnight, Niyogi, Alger, Bomblies, Conovitz and TateMcKnight and others (1999) have speculated that it takes centuries or longer for these pavements to form. They have proposed that these stone pavement channels are important physical legacies from past water-flow events. Therefore their existence implies past water transport over these locations. In fact, images such as Figure 2 reveal numerous ‘relict’ stream channels throughout the MCM. McKnight and her co-workers estimated that only 50% of the streams mapped on the topographic maps of the region have had flow associated with them during the 1990s (Reference McKnight, Niyogi, Alger, Bomblies, Conovitz and TateMcKnight and others, 1999). The stream channels are depicted on maps made from aerial photographs obtained during high-precipitation years (Carey, unpublished information). Some of these relict channels may be related to past glacier positions or melt dynamics, but others may be seeps or springs resulting from subsurface ice melt that are periodically activated during extremely warm austral summers. If the latter is the case, climate warming within the MCM may lead not only to increased flow and lake-level rise, but also to changing geochemical signatures in the streams and lakes. We have not investigated the sources of all these relict stream channels such as WHC. It is possible that some are linked to glaciers, while others could be initiated by snowmelt and sustained by brines at the surface of the permafrost table. More detailed study is warranted and planned.

Fig. 6. Photograph of WMC taken on 11 January 2002. Soil experimental plots can also be seen. Photo courtesy of D. Wall.
The frequency of this type of event
The MCM-LTER program has been monitoring stream-flow in Taylor Valley only since the 1993/94 austral summer, although there have been measurements made in the Lake Fryxell basin since 1990/91 (Reference McKnight, Niyogi, Alger, Bomblies, Conovitz and TateMcKnight and others, 1999). However, New Zealand scientists and now MCM-LTER personnel have monitored the Onyx River in Wright Valley, just north of Taylor Valley, since 1969. In addition, New Zealand and MCM-LTER scientists have monitored lake levels routinely since 1970 (Reference Chinn, Green and FriedmannChinn, 1993). R.F. Scott’s party also surveyed the level of Lake Bonney in 1903, and this value has been used as an important estimate in order to model the past century of hydrologic evolution in Lake Bonney (Reference Bomblies, McKnight and AndrewsBomblies and others, 2001). In addition, Reference Ebnet, FountainandT and NylenEbnet and others (2005) have developed a model based on measured air temperature, solar radiation and stream discharge since 1990 to back-cast glacier melt to 1957. All this information can be utilized to ascertain the significance of the hydrologic response of 2001/02 in the MCM region.
Reference Bomblies, McKnight and AndrewsBomblies and others (2001) determined that the average net volume of water added annually to Lake Bonney between 1973/74 and 1993/94 was ∼1 × 10⁶ m3. The Reference Ebnet, FountainandT and NylenEbnet and others (2005) model suggests that only in 1973/74, 1986/87, 1987/88, 1991/92 and 2001/02 was this average volume input more than double this average, with the 1986/87 and 1987/88 seasons having input >5 times this average. At Lake Hoare using temperature and lake-level records, the same five austral summers mentioned above could be considered ‘flood’ years equal to or greater than 2001/02 (Doran, unpublished information). Finally using Onyx River flow data, M.N. Gooseff (unpublished information) has calculated that daily mean flows exceeding ∼1700 L s–1 at the Lake Vanda gauge could be considered a 10 year event, while daily flows exceeding ∼6600 L s–1 could be considered a 100 year event. The maximum flows in January 2002 were 12 200 L s–1. A close inspection of the Onyx River record indicates peak flows in 1970/71, 1990/91 and 2001/02 along with a broad period (1981/82 through 1987/88) where flows were high, but not higher than in these three austral summers. Clearly a longer record is needed to place the 2001/02 event into perspective, but, from the hydrologic records available in both Taylor and Wright Valleys, this summer’s glacier meltwater flux was unusual, perhaps being one of only six observations of this magnitude that have occurred over the past 47 years.
Extraterrestrial comparisons of these features
The MCM have long been used as an analog to the surface of Mars and the processes that existed on an earlier, warmer Mars (e.g. Reference Wharton, Crosby, McKay and RiceWharton and others, 1995; Reference Doran, Wharton, Des Marais and McKayDoran and others, 1998; Reference Cabrol and GrinCabrol and Grin, 2003). Using detailed images from Mars available to us from the Mars Global Surveyor Orbiter, we can compare the general features of the Martian seeps to those of the MCM. The Martian photos show distinct channels related to either fluid seepage or surface runoff, some of which are thought to be caused by mudflows (Reference Malin and EdgettMalin and Edgett, 2000; Reference ChristensenChristensen, 2003; Reference Oyarzun, Viedma, Marquez and LilloOyarzun and others, 2003). About 80% of these features are associated with impact crater walls, walls of pits and walls of valley systems. Slumping and mass movements are commonly associated with the seepage and runoff and they resemble terrestrial gullies (Reference Malin and EdgettMalin and Edgett, 2000). Reference Malin and EdgettMalin and Edgett (2000) argued that these geomorphic features result from the movement of groundwater to the surface, although such seepage is usually impeded by an ice barrier. Eventually the ice barrier is breached and an outburst event occurs. Reference Doran and FormanDoran and Forman (2000) and Reference Knauth and BurtKnauth and Burt (2002) asserted that in order to be stable under Martian conditions this outburst water must be a brine. Reference Costard, Forget, Mangold and PeulvastCostard and others (2002) suggested that the Martian gully features were produced through melting of near-surface ice under warmer conditions. Reference ChristensenChristensen (2003) proposed that Martian features originated due to melting of snow and surface water flow. Given further investigation, groundwater seeps in Taylor Valley may prove to be useful analogs for determining or constraining the processes responsible for the formation of similar features on Mars. In addition, seep features like those discussed here (although much larger in scale) have been recently demonstrated to occur on other old arid surfaces on Earth (Reference Hoke, Isacks, Jordan and YuHoke and others, 2004), and springs have been previously described in the Arctic (Reference Pollard, Omelon, Anderson and McKayPollard and others, 1999). The future investigation of the Taylor Valley seeps could add new understanding of this type of phenomenon in other regions of our own planet as well.
Conclusions
An extremely warm austral summer (2001/02) led to greater than average glacier melt, very high stream-flows (Reference Ebnet, FountainandT and NylenForeman and others, 2004; Doran, unpublished information) and the development of groundwater seeps in Taylor Valley. Although only one seep was sampled and is discussed in this paper, numerous ‘wet spots’ and flows were observed on steep north-facing slopes of Taylor Valley during the same period.
Our data indicate that the geochemistry of these seeps is different from that of the ephemeral streams that flow during most austral summers in Taylor Valley. The seep waters had higher TDS, very high dissolved Si concentrations and an enrichment of SO4 : Cl compared to other fluvial waters in the MCM. These characteristics suggest that the waters originate from brackish permafrost containing mirabilite, and that substantial silicate mineral weathering has occurred within or close to the permafrost region within these soils. The morphology of the seep channel indicates that the channel has experienced water flow previously and events like the one observed in 2001/02 have occurred before. As part of the MCM-LTER effort in the future, we plan to monitor and evaluate features such as WHC. Based on our data, an increased summer temperature in Taylor Valley of approximately 1˚C could not only lead to the melting of subsurface ice, but also change the overall meltwater geochemistry entering the closed-basin lakes within Taylor Valley. Our observations suggest that increased warming of the soils by ∼1˚C during these anomalously warm austral summers increases the maximum thaw depth so that it intersects the ice table and permafrost melting ensues. What long-term effect this might have on the ecology of soils over which the seeps flow and on the lakes is currently a matter for speculation. Our investigation of the physio-chemical characteristics of the soils in Taylor Valley and their relationship to biodiversity of the soils suggests that the dissolution and transport of soluble solutes within the soils should enhance the suitability of the habitat for soil biota (Reference Wall and VirginiaWall and Virginia, 1999; Reference Courtright, Wall and VirginiaCourtright and others 2001).
Acknowledgements
This work was supported by US National Science Foundation grant OPP-9813061. We thank all our colleagues associated with MCM-LTER for discussions related to the manuscript, and especially D. Moorhead.We thank T. Nylen and T. Fitzgibbon for their help in organizing the soil temperature data. C. Jaros, M. Gooseff and D. McKnight helped us better quantify the hydrologic significance of the 2001/02 summer. J. Barrett provided important soil characteristics at the site. R. Sletten provided important discussion related to permafrost in the MCM. We appreciate the comments of M. Sharp and an anonymous reviewer which greatly improved the original manuscript.


