


Introduction
Antimicrobial stewardship program (ASP) efforts remain challenged by the empiric use of broad-spectrum antimicrobials (BSAs) in patients hospitalized with community-acquired pneumonia (CAP). Despite the low prevalence of methicillin-resistant Staphylococcus aureus (MRSA) and P. aeruginosa, antimicrobial use targeting these organisms remains disproportionately high relative to their prevalence in CAP.Reference Restrepo, Pascual-Guardia and Marin-Corral1–Reference Carugati, Aliberti and Sotgiu3 The Centers for Disease Control and Prevention has identified unnecessary MRSA and P. aeruginosa coverage in CAP as a top priority for hospital ASPs.4 In 2019, the Infectious Diseases Society of America (IDSA) and American Thoracic Society (ATS) retired the healthcare-associated pneumonia (HCAP) framework introduced in 2005.Reference Metlay, Waterer and Long5,Reference Society and IDSo6
Guideline recommendations limit empiric anti-MRSA and antipseudomonal therapies to inpatients with established risk factors. The two risk factors provided by IDSA/ATS are (1) prior respiratory isolation of either organism and (2) hospitalization with receipt of intravenous antibiotics within the previous 90 days for those with severe pneumonia.Reference Metlay, Waterer and Long5 Beyond these risk factors, IDSA/ATS recommend that hospitals evaluate local epidemiology and validate institution-specific risk factors.
In the absence of institution-specific validation, prescribers may favor BSAs, particularly for immunocompromised patients who were not represented in the IDSA/ATS guideline.Reference Metlay, Waterer and Long5
In this study, we aimed to validate risk factors associated with MRSA and P. aeruginosa growth in respiratory cultures among patients presenting with CAP at an academic medical center with a high proportion of immunocompromised patients.
Methods
Study design
We performed a single-center, retrospective cohort study of patients hospitalized with CAP at Mayo Clinic Hospital in Arizona between October 1, 2018, and March 31, 2023. Mayo Clinic Hospital is a 368-bed academic medical center that performed 4,348 solid organ (SOT) and 1,181 hematologic stem cell transplants (HSCTs) between 2018 and 2023. SOT included heart, kidney, pancreas and liver; lung and laryngeal transplants were not performed during the study period.
Participants
We screened adult patients with an International Classification of Diseases—10th revision (ICD-10) discharge diagnosis code for pneumonia. We included those who had respiratory cultures and received systemic antibiotics for a “respiratory tract infection” within 48 hours of admission. Our institution requires all inpatient antimicrobial orders to include an order-specified indication at the time of entry. Prior studies demonstrated this approach to have a high degree of accuracy for antibiotic indication.Reference Beardsley, Vestal and Rosario7,Reference Heil, Pineles and Mathur8
We excluded those who did not have respiratory culture data. We excluded patients who transferred from outside facilities and those with respiratory cultures positive for MRSA or P. aeruginosa within the 12 months prior to the CAP admission.
Data collection
All data were extracted from the electronic health record and an institutional data warehouse. Baseline demographics, including age, sex, race, ethnicity, and transplant history, were collected. Most risk factors were identified using the Charlson Comorbidity Index (CCI), as previously described.Reference Singh, Singh and Ahmed9,Reference Ilges, Kosaski and Seville10 Additional risk factors were collected using the following ICD-10 codes: primary immunodeficiency disorders (D71, D80, D81, D82, D83, D84, D89), bronchiectasis (J47), HIV (Z21), influenza (J09, J10, J11), substance use disorder (F19, F11, F14, F55, F15), alcohol use disorder (F10), tracheostomy (Z93.0), wound care (Z48.00).
Outcomes
The primary objective was to identify factors associated with MRSA or P. aeruginosa isolation in respiratory cultures among hospitalized patients with CAP.
Data analysis
For the primary analysis, multivariate logistic regression was used to calculate an adjusted odds ratio (aOR) for the association between each risk factor and respiratory isolation of MRSA or P. aeruginosa. Separate models were constructed for each organism. Three sequential models were run for each risk factor as follows:
-
1. Unadjusted/univariate model (infection as the outcome and risk factor as the predictor)
-
2. Model for each risk factor adjusted for age, sex, and BMI (confounder-adjusted)
-
3. Multivariate model adjusted for age, sex, BMI, and any risk factors found in step 2 to have a P-value ≤ .1.
Variables with zero event counts in at least one group were considered not estimable and are reported as such.
In a secondary analysis, risk factors for ICU admission, length of stay, 30-day readmission, and 30-day mortality were assessed using the same covariates as the primary analysis, with additional adjustment for MRSA or P. aeruginosa isolation. Logistic regression was used for ICU admission, 30-day readmission, and 30-day mortality, while length of stay (hours) was modeled using Gamma regression with a log link. Statistical significance was defined as a two-sided P-value < .05.
Results
Population
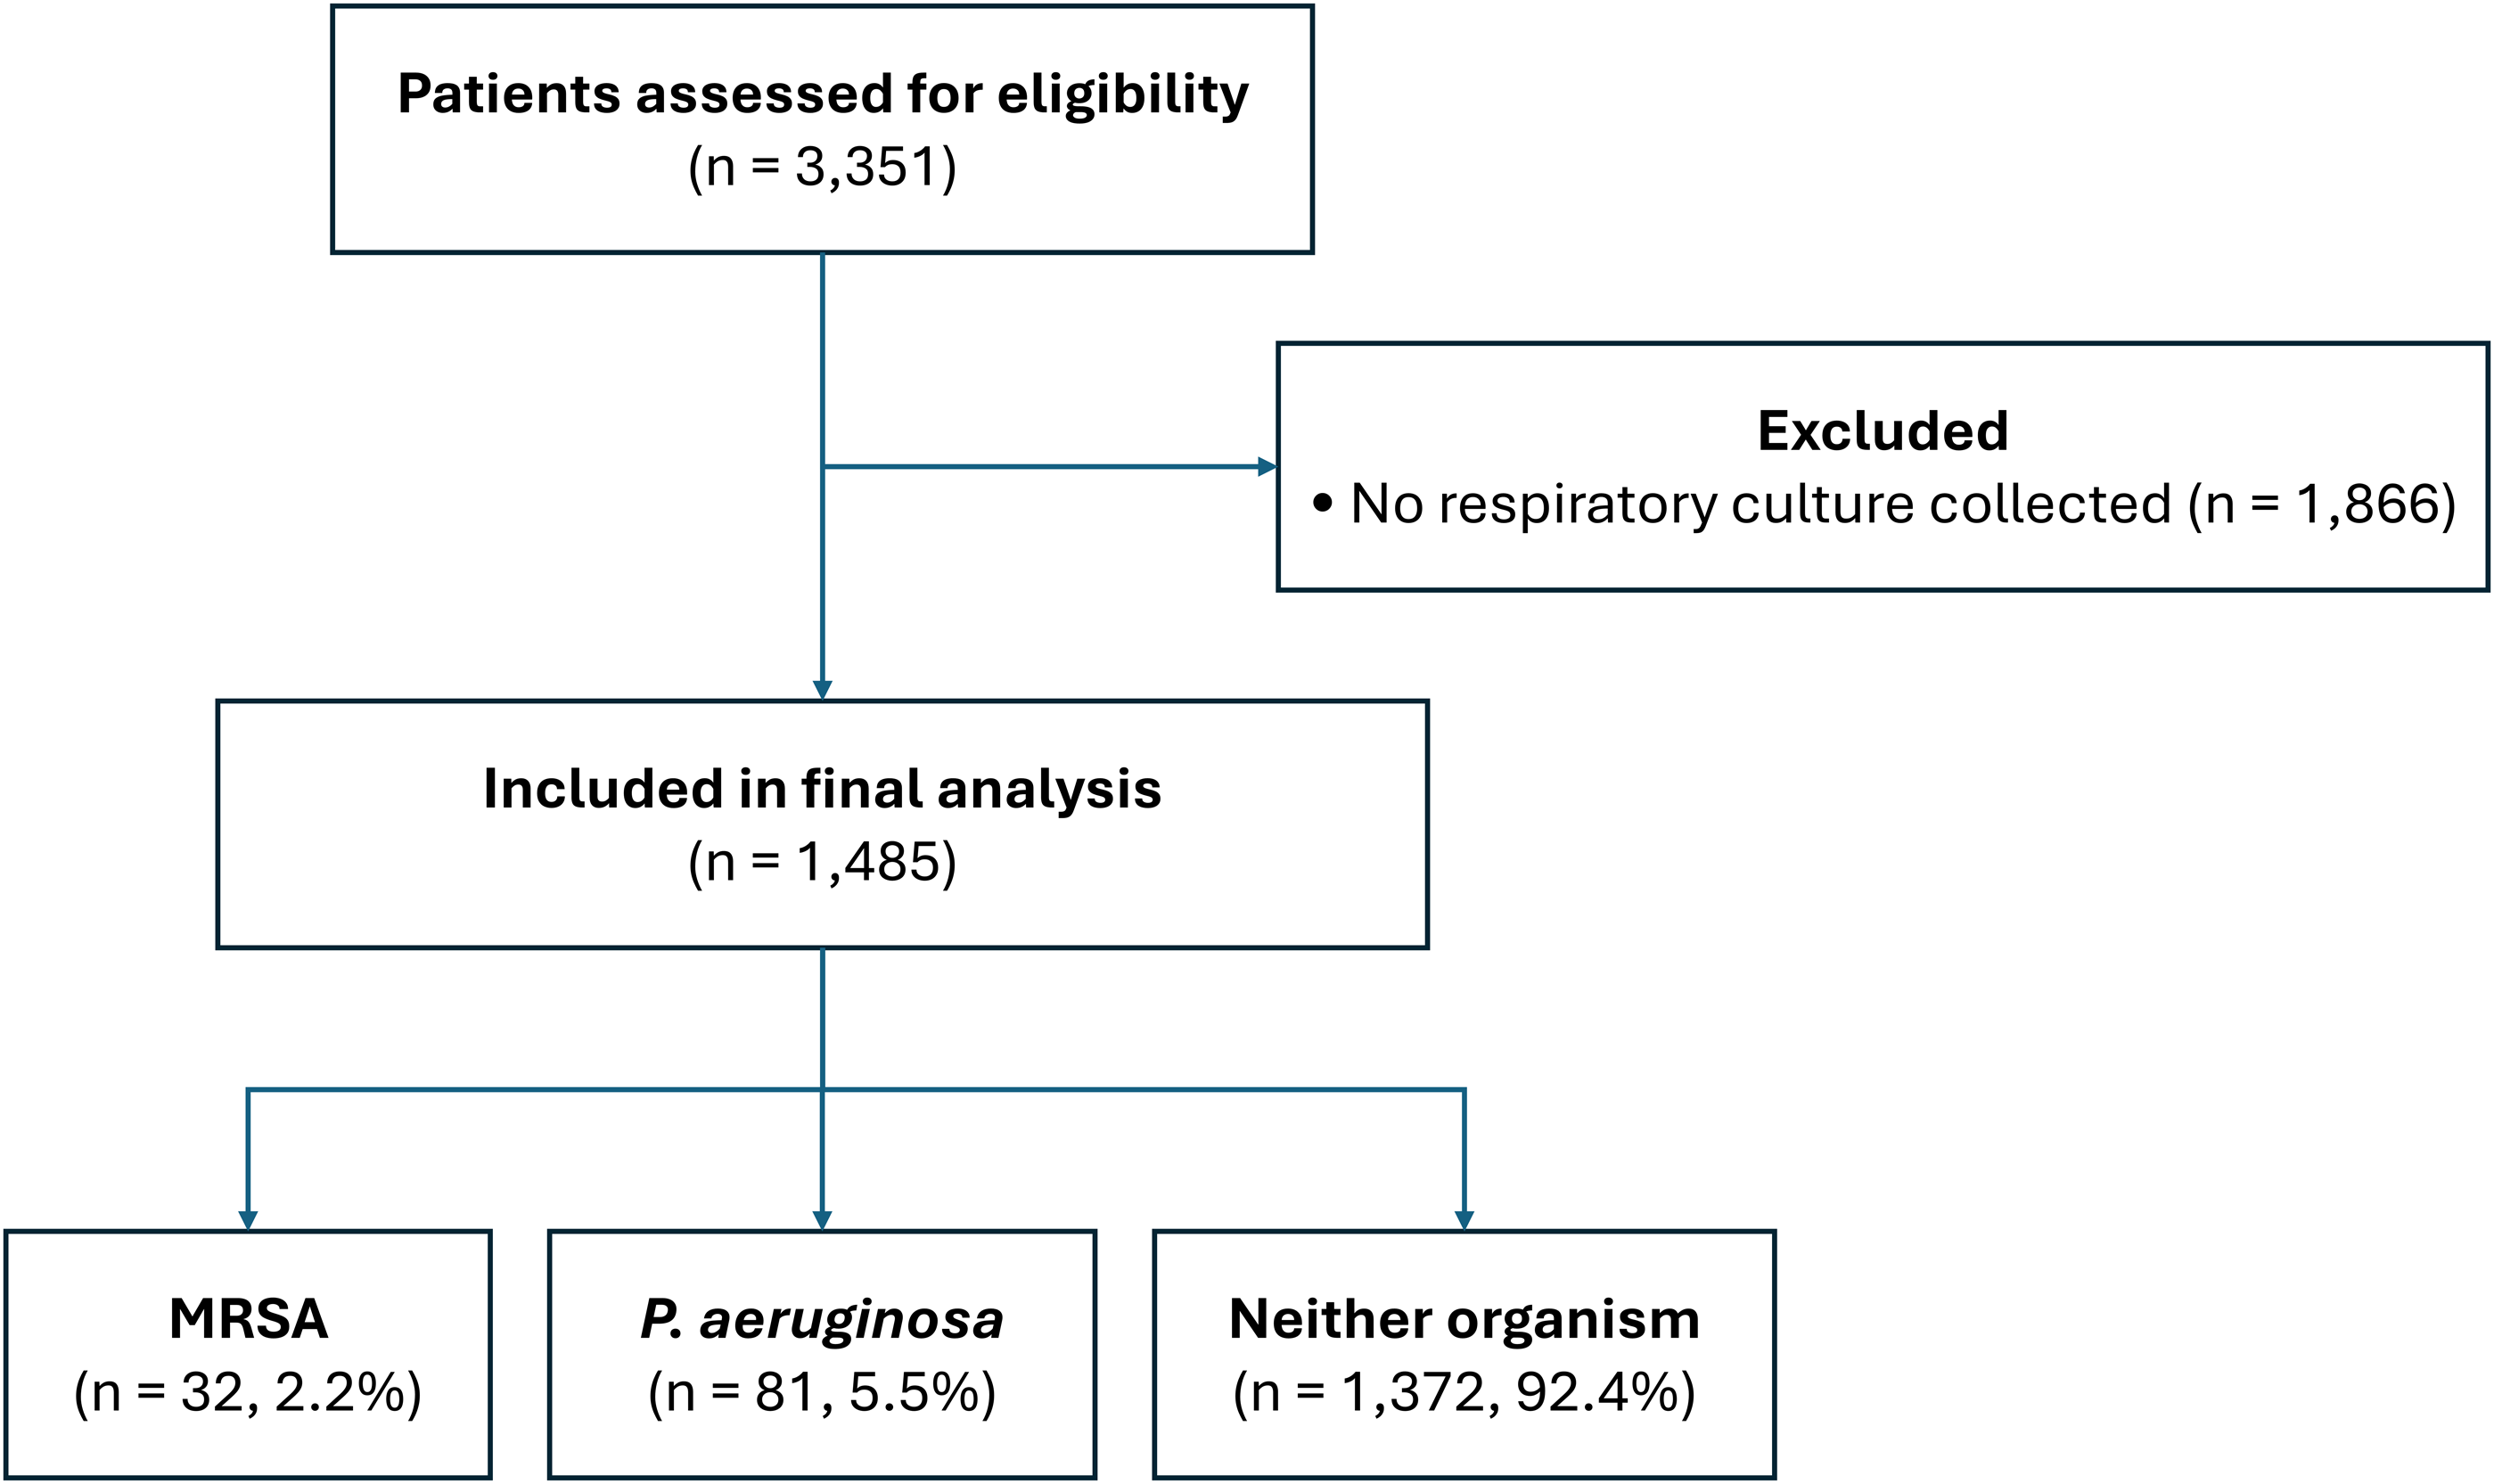
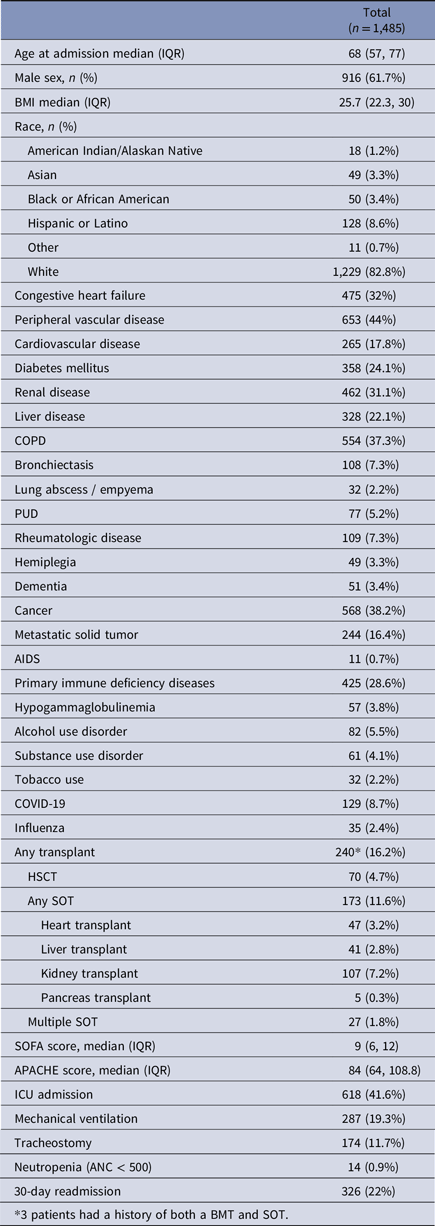
A total of 3,351 patients were screened for inclusion (admission for CAP diagnosis with receipt of antibiotics with respiratory tract infection indication within 48 h of admission). Of these, 1,866 were excluded due to no respiratory culture collected (Figure 1). This resulted in a final cohort of 1,485 patients, reflecting a severely ill CAP population, with 618 (41.6%) requiring admission to the intensive care unit (ICU), 287 (19.3%) requiring mechanical ventilation, and 215 (14.5%) dying within 30 days of admission (see Table 1 for baseline characteristics).
Flowchart for patients hospitalized with CAP at Mayo Clinic Arizona between october 1, 2018, and march 31, 2023.

Characteristics of patient population

Table 1. Long description
A table summarizing patient population characteristics. The table has 40 rows and 2 columns. The first column lists various characteristics, and the second column provides corresponding values. Row 1: Age at admission median (IQR), 68 (57, 77). Row 2: Male sex, n (%), 916 (61.7%). Row 3: BMI median (IQR), 25.7 (22.3, 30). Row 4: Race, n (%): American Indian/Alaskan Native, 18 (1.2%). Row 5: Asian, 49 (3.3%). Row 6: Black or African American, 50 (3.4%). Row 7: Hispanic or Latino, 128 (8.6%). Row 8: Other, 11 (0.7%). Row 9: White, 1,229 (82.8%). Row 10: Congestive heart failure, 475 (32%). Row 11: Peripheral vascular disease, 653 (44%). Row 12: Cardiovascular disease, 265 (17.8%). Row 13: Diabetes mellitus, 358 (24.1%). Row 14: Renal disease, 462 (31.1%). Row 15: Liver disease, 328 (22.1%). Row 16: COPD, 554 (37.3%). Row 17: Bronchiectasis, 108 (7.3%). Row 18: Lung abscess / empyema, 32 (2.2%). Row 19: PUD, 77 (5.2%). Row 20: Rheumatologic disease, 109 (7.3%). Row 21: Hemiplegia, 49 (3.3%). Row 22: Dementia, 51 (3.4%). Row 23: Cancer, 568 (38.2%). Row 24: Metastatic solid tumor, 244 (16.4%). Row 25: AIDS, 11 (0.7%). Row 26: Primary immune deficiency diseases, 425 (28.6%). Row 27: Hypogammaglobulinemia, 57 (3.8%). Row 28: Alcohol use disorder, 82 (5.5%). Row 29: Substance use disorder, 61 (4.1%). Row 30: Tobacco use, 32 (2.2%). Row 31: COVID-19, 129 (8.7%). Row 32: Influenza, 35 (2.4%). Row 33: Any transplant, 240 (16.2%). Row 34: HSCT, 70 (4.7%). Row 35: Any SOT, 173 (11.6%). Row 36: Heart transplant, 47 (3.2%). Row 37: Liver transplant, 41 (2.8%). Row 38: Kidney transplant, 107 (7.2%). Row 39: Pancreas transplant, 5 (0.3%). Row 40: Multiple SOT, 27 (1.8%).
Regarding immunosuppression, 173 (11.6%) had undergone SOT (107 kidney, 47 heart, 41 liver, and 5 pancreas), with 27 (1.8%) having undergone >1 SOT. Seventy patients (4.7%) had undergone HSCT. 568 (38.2%) had a cancer diagnosis and 244 (16.4%) had metastatic solid tumors. 425 (28.6%) had primary immunodeficiency condition, including 57 (3.8%) with hypogammaglobulinemia, and 14 (.9%) had neutropenia.
Thirty-two (2.2%) patients had MRSA and 81 patients (5.5%) had P. aeruginosa isolated from respiratory culture.
Variables evaluated in the multivariate logistic regression models are presented in Tables 2 and 3; complete univariate analyses are provided in Supplementary Appendix. Multivariate logistic regression analysis for MRSA CAP is shown in Table 2. MRSA CAP was associated with substance use disorder [aOR 8.29, 95% CI (2.55–27.0)] (P < .001), influenza [aOR 7.64, 95% CI (2.01–29.1)] (P = .003), lung abscess/empyema [aOR 4.58, 95% CI (1.15–18.2)] (P = .031), and peptic ulcer disease (PUD) [aOR 4.09, 95% CI (1.29–12.9)] (P = .017). Alcohol use disorder was associated with MRSA in unadjusted analysis but did not remain significant in the multivariate logistic regression analysis [aOR 2.85, 95% CI (.87–9.27)] (P = .082).
Risk factors for patients with MRSA pneumonia

Table 2. Long description
A table comparing risk factors for patients with MRSA pneumonia. The table has 5 rows and 6 columns. The columns are labeled: Characteristic, Unadjusted OR (95% CI), Unadjusted P-value, Adjusted for age, sex, BMI OR (95% CI), Adjusted for age, sex, BMI P-value, Adjusted for age, sex, BMI and significant risk factors OR (95% CI), Adjusted for age, sex, BMI and significant risk factors P-value. Row 1: Lung abscess / empyema, 5.05 (1.56-16.32), .007, 4.22 (1.20-14.86), .025, 4.58 (1.15-18.19), .031. Row 2: PUD, 3.08 (1.10-8.66), .033, 2.84 (0.96-8.44), .060, 4.09 (1.29-12.94), .017. Row 3: Alcohol use disorder, 3.13 (1.21-8.11), .019, 2.85 (0.87-9.27), .082. Row 4: Substance use disorder, 5.49 (2.21-13.63), <.001, 5.45 (1.91-15.60), .002, 8.29 (2.55-26.97), <.001. Row 5: Influenza, 6.31 (2.18-18.25), <.001, 5.58 (1.82-17.08), .003, 7.64 (2.01-29.09), .003.
Abbreviations: CI = confidence interval, OR = odds ratio.
Risk factors for patients with P. aeruginosa pneumonia

Table 3. Long description
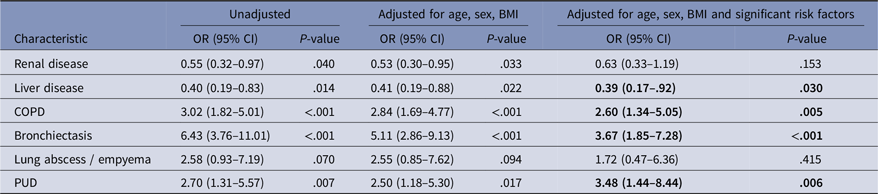
A table comparing risk factors for patients with P. aeruginosa pneumonia. The table has 6 rows and 7 columns. The columns are labeled: Characteristic, Unadjusted OR (95% CI), Unadjusted P-value, Adjusted for age, sex, BMI OR (95% CI), Adjusted for age, sex, BMI P-value, Adjusted for age, sex, BMI and significant risk factors OR (95% CI), Adjusted for age, sex, BMI and significant risk factors P-value. The rows are labeled: Renal disease, Liver disease, COPD, Bronchiectasis, Lung abscess / empyema, PUD. Row 1: Renal disease, 0.55 (0.32-0.97), 0.040, 0.53 (0.30-0.95), 0.033, 0.63 (0.33-1.19), 0.153. Row 2: Liver disease, 0.40 (0.19-0.83), 0.014, 0.41 (0.19-0.88), 0.022, 0.39 (0.17-0.92), 0.030. Row 3: COPD, 3.02 (1.82-5.01), <.001, 2.84 (1.69-4.77), <.001, 2.60 (1.34-5.05), 0.005. Row 4: Bronchiectasis, 6.43 (3.76-11.01), <.001, 5.11 (2.86-9.13), <.001, 3.67 (1.85-7.28), <.001. Row 5: Lung abscess / empyema, 2.58 (0.93-7.19), 0.070, 2.55 (0.85-7.62), 0.094, 1.72 (0.47-6.36), 0.415. Row 6: PUD, 2.70 (1.31-5.57), 0.007, 2.50 (1.18-5.30), 0.017, 3.48 (1.44-8.44), 0.006.
Abbreviations: CI = confidence interval, OR = odds ratio.
Multivariate logistic regression analysis for P. aeruginosa CAP is shown in Table 3. P. aeruginosa CAP was independently associated with bronchiectasis [aOR, 3.67; 95% CI (1.85–7.28)] (P < .001), PUD [aOR 3.48, 95% CI (1.44–8.44)] (P = .006), and COPD [aOR 2.60, 95% CI (1.34–5.05)] (P = .005). Liver disease was found to have a negative association with P. aeruginosa [aOR .39, 95% CI (.17–.92)] (P = .030).
In our secondary analyses, MRSA isolation was independently associated with longer hospital length of stay. Patients with MRSA had hospital stays that were 1.58 times longer (95% CI, 1.13–2.29, P = .010) than those without MRSA after multivariate adjustment. We did not find MRSA or P. aeruginosa to be significant risk factors for ICU admission, 30-day readmission, or 30-day mortality.
Discussion
We did not find transplantation (SOT and HSCT), malignant tumor, or primary immunodeficiencies to be independently associated with MRSA or P. aeruginosa isolation from respiratory cultures. Instead, our findings reinforce prior evidence that influenza, substance use disorder, and lung abscess/empyema are associated with MRSA, whereas bronchiectasis and COPD are associated with P. aeruginosa.Reference Arancibia, Bauer and Ewig11–Reference Wooten and Winston16 These findings are reassuring for ASPs at centers with large transplant and oncology populations where optimizing use of BSAs is often challenging.
Our study adds to a limited but growing body of evidence that immunocompromising conditions are not independently associated with MRSA or P. aeruginosa in CAP.Reference Di Pasquale, Sotgiu and Gramegna17,Reference Saravolatz, Gandhi and Vaughn18 A secondary analysis of the Global Initiative for MRSA Pneumonia (GLIMP) database found that, while P. aeruginosa CAP was more prevalent among immunocompromised patients, immunocompromise was not a risk factor after multivariate adjustment for confounders.Reference Di Pasquale, Sotgiu and Gramegna17 In a separate observational study of moderately immunocompromised patients who did not meet IDSA/ATS criteria for BSAs, no mortality difference was found between those treated with standard versus BSA.Reference Saravolatz, Gandhi and Vaughn18 Both of these studies evaluated immunosuppressive therapies, such as corticosteroids, in addition to immunocompromised conditions, such as malignant tumor and transplantation.
We observed a higher prevalence of P. aeruginosa (5.5%) compared with prior studies (1.2–2.1%), likely reflecting selection for a sicker cohort due to the requirement for respiratory cultures.Reference Saravolatz, Gandhi and Vaughn18–Reference Jones, Jones and Huttner20 This is supported by a high ICU admission rate (41.6%). In studies with high rates of respiratory cultures (>85%), P. aeruginosa has been reported to be around 4%.Reference Di Pasquale, Sotgiu and Gramegna17,Reference Cilloniz, Gabarrus and Ferrer21 Notably, the isolation of MRSA or P. aeruginosa in respiratory culture was not associated with ICU admission in a secondary analysis. Collectively, these findings suggest that immunocompromising conditions alone may be insufficient to guide empiric BSAs in CAP.
Two unexpected findings were that PUD was associated with both MRSA and P. aeruginosa, and liver disease was inversely associated with P. aeruginosa. Observational data have demonstrated associations between acid-suppressive therapies and pneumonia, as well as increased intestinal colonization with multidrug-resistant organisms (MDROs).Reference Laheij, Sturkenboom, Hassing, Dieleman, Stricker and Jansen22,Reference Willems, van Dijk, Ket and Vandenbroucke-Grauls23 However, an association of acid-suppression with MDROs, including P. aeruginosa and MRSA, within the context of CAP has not been evaluated. Given that we did not capture whether patients were on acid-suppressive therapies, these findings would need to be formally evaluated as the association likely reflects residual confounding. For liver disease, chronic fluoroquinolone exposure could theoretically influence P. aeruginosa CAP risk. However, we did not capture whether these patients were on spontaneous bacterial prophylaxis.
Our study has some important limitations. First, we relied on ICD-10 codes and the CCI to identify immunocompromising conditions. This limited our ability to evaluate all the conditions qualifying for immunocompromise in CAP as outlined by CHEST, specifically those related to pharmacotherapies.Reference Ramirez, Musher and Evans24 These pharmacotherapy-related conditions were evaluated in the studies by Di Pasquale and Saravolatz and were not found to be independently associated with MRSA or P. aeruginosa, as previously mentioned.Reference Di Pasquale, Sotgiu and Gramegna17,Reference Saravolatz, Gandhi and Vaughn18 However, with increased use of immunosuppressing agents since those reports, this merits further study. Since we did not capture antimicrobial exposures, we are unable to comment on the utilization or appropriateness of BSAs within our cohort. We also did not capture the timing of CAP hospitalization relative to date of transplantation as this may influence infection risk profiles. Our findings may not be generalizable to other institutions, as our cohort had a high ICU admission rate—likely reflecting higher acquisition of respiratory cultures, which are more commonly obtained in the ICU setting. Additionally, we did not stratify our analysis to evaluate temporal fluctuations in respiratory viruses, such as influenza or COVID-19. However, neither respiratory virus was found to have a significant association with either MRSA or P. aeruginosa pneumonia besides influenza with MRSA pneumonia [aOR 7.64]. Lastly, since we included only patients who had respiratory cultures, we may have missed patients with MRSA or Pseudomonas CAP who did not have respiratory cultures obtained.
In conclusion, our results support prior studies that did not find immunocompromising conditions to be associated with MRSA or P. aeruginosa in patients hospitalized with CAP. Our results affirm previously demonstrated risk factors for MRSA and P. aeruginosa in CAP and add additional confidence that immunocompromising conditions evaluated in this cohort were not associated with MRSA or P. aeruginosa CAP. Overall, these findings support an individualized approach to empiric CAP therapy, prioritizing established clinical risk factors over immunocompromised status alone.
Supplementary material
The supplementary material for this article can be found at https://doi.org/10.1017/ash.2026.10849
Acknowledgments
All authors have contributed meaningfully to the manuscript, vouch for the validity of the data, and have approved the final manuscript.
Financial support
This work was supported in part by funding from the Mayo Clinic Arizona Pharmacy Department.



 Open access