


Excess body weight is the abnormal or excessive accumulation of adipose tissue and poses a high risk to human health(Reference Gonzalez-Muniesa, Martinez-Gonzalez and Hu1,2) . The prevalence of excess body weight among children has more than doubled, with a dramatic increase from just 4 % in 1975 to over 18 % in 2016. This condition has become a global epidemic and a serious public health problem(Reference Ng, Fleming and Robinson3–5). Children with obesity are very likely to remain obese as adults and are at risk of developing many co-morbidities, including type 2 diabetes mellitus, CVD, dyslipidaemia and other disorders(6–Reference Skinner, Perrin and Moss8).
The mechanisms of body weight regulation are complex and involve the interaction of genetic, environmental and behavioural factors that act through several physiological mediators of food intake and energy expenditure, thus affecting fat deposition(Reference Gonzalez-Muniesa, Martinez-Gonzalez and Hu1). Within this context, genes encoding adipokines (polypeptides secreted by adipocytes) and genes involved in energy balance play a potential role in systemic energy homoeostasis(Reference Turcot, Lu and Highland9,Reference Jiang, Penney and Giovannucci10) . Adiponectin and leptin are important adipokines because of their hormonal function in energy homoeostasis, controlling food consumption and energy expenditure(Reference Gonzalez-Muniesa, Martinez-Gonzalez and Hu1,Reference Lehr, Hartwig and Lamers11–Reference Stern, Rutkowski and Scherer14) . Furthermore, adiponectin and leptin exert endocrine functions and are particularly involved in lipogenesis and lipolysis, suggesting that the two adipokines may regulate adipose tissue metabolism(Reference Stern, Rutkowski and Scherer14).
Genetic variants of adiponectin (ADIPOQ) and leptin (LEP) play a role in energy balance and appetite regulation(Reference Triantafyllou, Paschou and Mantzoros12,Reference Lee and Shao13,Reference Feng, Zheng and Feng15–Reference Jequier17) and are associated with BMI and adiposity(Reference Jequier17–Reference Arita, Kihara and Ouchi22). Circulating levels of adiponectin are under substantial genetic influence(Reference Spracklen, Karaderi and Yaghootkar23), and variants in the ADIPOQ gene may therefore be associated with the pathophysiology of obesity(Reference Kaur, Badaruddoza and Bains24). The presence of LEP gene variants also appears to be associated with higher levels of energy and total lipid intake, influencing the individual’s weight status(Reference Crovesy and Rosado25,Reference Shabana and Hasnain26) . However, to the best of our knowledge, no study has evaluated the effect of the ADIPOQ and LEP genes on the weight status of children from birth to 6 years of age. Identifying genetic variants associated with excess body weight during childhood including the early infancy period will help develop strategies to prevent or reduce the prevalence of overweight and obesity. Within this context, the aim of the present study was to investigate the association of genetic variants in the ADIPOQ (rs2241766) and LEP (rs7799039) genes with body weight trajectories in a 6-year prospective birth cohort.
Methods
Study design and population
This prospective cohort study is part of the Predictors of Maternal and Infant Excess Body Weight (PREDI) Study, which was started in 2012 in Joinville, Brazil. The city has an estimated population of 590 000 inhabitants, a Human Development Index of 0·809 and an infant mortality rate of 8·78/1000 live births(27).
An in-depth description of the PREDI Study has been published previously(Reference Kroll, Mastroeni and Veugelers28–Reference Kroll, de Franca and Mastroeni31). Briefly, all women over 18 years of age who gave birth to a full-term singleton (between 37 and 42 weeks of gestation) admitted to a public maternity hospital in Joinville (Brazil) from 14 January to 16 February 2012 were invited to participate. Women with a diagnosis of pre-eclampsia, infectious disease (AIDS, hepatitis, syphilis and toxoplasmosis) and stillbirth were excluded from the study. Children with any anomalies such as ambiguous genitalia and hydrocephaly that could interfere with their weight and height measurements and those who were adopted immediately after delivery were also excluded.
The PREDI Study was approved by the Research Ethics Committee of the University of Joinville Region (protocol no. 107/2011).
Data collection
Anthropometric measurements and clinical, biological, demographic, and socio-economic data were collected at four time points using a structured questionnaire: 2012 (baseline, at birth) at the maternity hospital; 2013–14 (first follow-up, 1–2 years old), 2016–17 (second follow-up, 4–5 years old) and 2018 (third follow-up, 6 years old) at the family home. A total of 435 mother–child pairs were enrolled in the study in 2012. After exclusions and losses, 315 pairs of women and their children continued to participate in the first follow-up of the study, 221 in the second follow-up and 187 in the third follow-up (Fig. 1).

Fig. 1. Flow chart of participants through the recruitment process. PREDI Study, Brazil (2012–2018).
Measurements
Maternal age (years), marital status (married/consensual union or other), education (years of schooling, ≥9 or <9), household income (minimum wage, ≥3 or <3) and parity at baseline (number of deliveries considering children born before the baseline, nulliparous or ≥1 child) were self-reported by the mother. Type of delivery (normal or Caesarean), birth weight (g), length (cm) and sex (male or female) were collected from the hospital records. Birth weight was classified considering the gestational age and sex according to INTERGROWTH-21st standards(Reference Villar, Cheikh Ismail and Victora32) and classified as follows: small for gestational age (<10th percentile), appropriate for gestational age (10th–90th percentile) or large for gestational age (>90th percentile)(Reference Francis, Hugh and Gardosi33).
The pre-pregnancy BMI (weight (kg)/height (m2)) was based on the mother’s self-reported pre-pregnancy weight and immediate postpartum height, which was measured to the nearest 0·1 cm with a portable stadiometer (WCS®, Compact)(Reference Gordon, Chumlea, Roche, Lohman, Roche and Martorell34). Pre-pregnancy BMI was classified based on the cut-offs recommended by the WHO(2). We defined BMI ≥ 25 kg/m2 as excess body weight. Total gestational weight gain (GWG) was obtained by subtracting self-reported pre-pregnancy weight from the weight obtained immediately before delivery. The adequacy of GWG was classified (non-excessive/excessive) according to the Institute of Medicine guidelines(Reference Rasmussen and Yaktine35). Excessive GWG was defined when the mother exceeded the recommended GWG(Reference Rasmussen and Yaktine35).
In the first follow-up, the children’s weight was measured with a paediatric digital portable scale (Beurer®, BY20) to the nearest 10 g, and length was measured with a paediatric anthropometric ruler (WCS®, Wood) to the nearest 0·1 cm(36). In the second and third follow-ups, the children’s weight was measured using a portable digital scale (G-Tech, Glass-7) with a capacity of 180 kg to the nearest 0·1 kg, and height was measured with a portable stadiometer (WCS®, Compact)(Reference Gordon, Chumlea, Roche, Lohman, Roche and Martorell34) to the nearest 0·1 cm.
The children’s weight status was based on the 2006 WHO(37) and 2007 WHO(Reference de Onis, Onyango and Borghi38) growth standards for BMI-for-age for children and adolescents aged 0–5 and 5–19 years, respectively. We defined BMI > 85th percentile as excess body weight in children. All anthropometric measurements were performed in duplicate and the mean values were used for analysis.
Genotyping
The genotyping method has been described previously(Reference Kroll, Mastroeni and Veugelers28). Approximately 10 ml of blood were collected from the newborn at the time of delivery by aspiration of the umbilical vein close to the placenta up to 10 min after clamping to prevent coagulation(Reference Sales, Silleno Junior and Kroll39). The blood samples were transferred to an FTA CloneSaver™ card (GE Healthcare). Genomic DNA was extracted from the cards by an adaptation of the method described by Kline et al. (Reference Kline, Duewer and Redman40). The ADIPOQ-rs2241766 and LEP-rs7799039 genetic variants were analysed by the PCR followed by restriction fragment length polymorphism analysis.
DNA was amplified using the following primers: forward: 5′-TCTCTCCATGGCTGACAGTG-3’ and reverse: 5′-CCTTTCTCACCCTTCTCACC-3’ for the ADIPOQ gene(Reference Low, Mohd Tohit and Chong41); forward: 5′-CTTTTGTTTTGTTTTGCGACAGGGGTGC-3’ and reverse: 5′-GCTCCCTTTGCCCGACCCCG-3’ for the LEP gene(Reference Hinuy, Hirata and Forti42). After amplification, restriction fragment length polymorphism analysis was performed using the restriction enzymes SmaI for the ADIPOQ gene variant(Reference Low, Mohd Tohit and Chong41) and Alw44I for the LEP gene variant(Reference Hinuy43).
Statistical analysis
The sample size was calculated with the OpenEpi 3.02 software as described previously(Reference Sales, Silleno Junior and Kroll39). We performed post hoc tests to compute the exact power achieved considering the effect size of the polymorphism–time interaction on child BMI, an α error of 5 % and ANOVA for repeated measures with within–between interactions. Considering these parameters, the sample size achieved a power >90 % to detect a small effect size (Cohen’s effects size f = 0·1). The calculation was performed using the G × Power software (version 3.1.9.2)(Reference Faul, Erdfelder and Buchner44).
Maternal and child characteristics are expressed as mean and sd for continuous variables, and as absolute and relative frequencies for categorical variables. Student’s t test and the χ 2 test were used to compare sociodemographic and biological characteristics between women and children who were lost to follow-up and those who completed the study (evaluated up to the third follow-up visit).
The agreement of genotype frequencies with Hardy–Weinberg equilibrium expectations was tested using the χ 2 test. Due to the small number of rare alleles, the genotypes were analysed using a dominant model (wild-type genotype: ADIPOQ-TT and LEP-GG v. genotypes with at least one risk allele: ADIPOQ-TG or GG and LEP-GA or AA).
The longitudinal association of maternal and child sociodemographic and biological characteristics with changes in children’s BMI from birth to 6 years of age was assessed using longitudinal linear mixed-effect (LME) models. The longitudinal linear regression coefficient (β), mean and 95 % CI are reported. Poisson regression analysis with robust variance was used to address the association of ADIPOQ and LEP genotypes with BMI categories, with the estimation of relative risk and 95 % CI.
We further used LME models to explore the potential association between the polymorphisms and BMI trajectories (outcome) from birth to 6 years of age. Interaction terms were included in the models to examine the potential effect of differences in age and sex on the association between ADIPOQ and LEP variants and BMI trajectories: (1) child age (continuous variable) and genetic variants (genotype categories); (2) child age (continuous variable), sex (male/female) and genetic variants (genotype categories).
In all LME models, child age (months) at the follow-ups was used to model time and was fitted as a random effect with an unstructured covariance matrix in order to accommodate the wide variability of slopes among the subjects over time. All other covariates were analysed as fixed effects only. Effect plots of the longitudinal prediction and 95 % CI were constructed to illustrate the BMI trajectories from birth to 6 years of age according to ADIPOQ-rs2241776 gene variant, as well as the interaction between the genetic variant and sex.
The variables included in the adjusted Poisson regression models and LME analyses were chosen based on the biological plausibility of the association between ADIPOQ and LEP gene variants and the child’s weight status. We also considered the small number of children carrying the risk allele, limiting the number of variables used in the models. All models were adjusted for time. The time of follow-up (baseline, first, second and third follow-up, as categorical variables) was considered for Poisson regression analysis and the child’s age in months on the day of the visit (as continuous variables and defining baseline as time zero) for LME. Linear, quadratic and cubic functions of child age were included to adjust for the non-linear association between BMI and time. The models were also adjusted for education (years of schooling), GWG (non-excessive/excessive) and sex (male/female). Effect plots of the longitudinal prediction and 95 % CI were fitted to graphically illustrate the effect of the interaction between ADIPOQ-rs2241776 gene variant and time on the BMI trajectories from birth to 6 years of age according to child sex.
The results were considered statistically significant when P < 0·05. The IBM Statistical Package for the Social Sciences (SPSS) (version 22.0, IBM Corp.) and STATA statistics software (version 12.0) were used for statistical analysis. The graphs were constructed using the R software (version 3.6.3, R Foundation for Statistical Computing, 2019).
Results
Women who were lost to follow-up were younger than those who completed the study. Except for age, none of the characteristics investigated differed significantly among the follow-ups of the study (online Supplementary material 1).
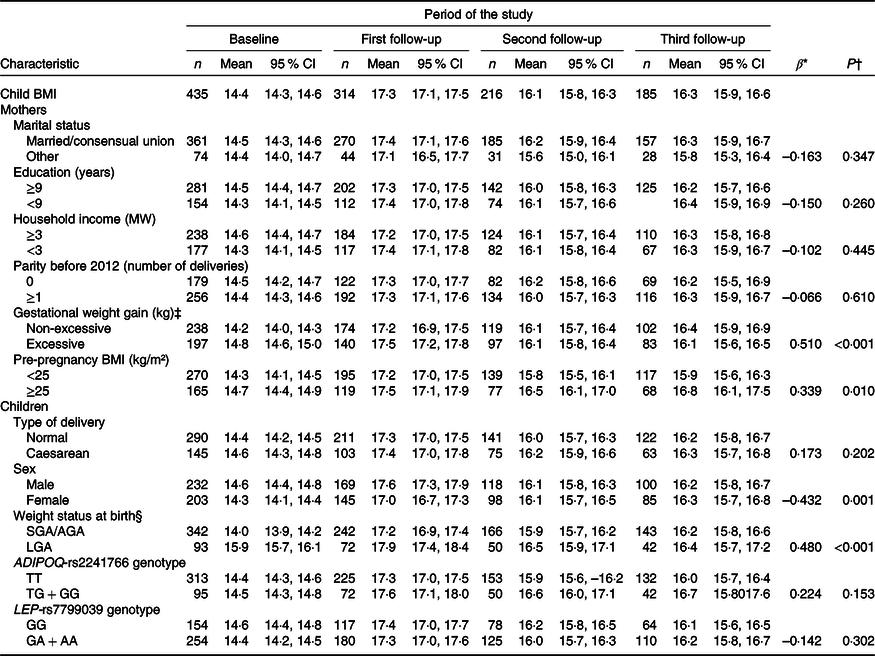
The prevalence of children with excess body weight was 39·5, 42·0, 30·6 and 25·9 % at birth, 1–2, 4–5 and 6 years of age, respectively (data not shown in the tables). The study sample consisted of mothers with a mean age of 26 years (95 % CI 25·4, 26·5) and 9·4 years of schooling (95 % CI 9·1, 9·7). In addition, 45·3 % of the mothers had excessive GWG and 37·9 % were classified as having pre-pregnancy excessive body weight. Regarding weight status at birth, 23·7 % of the boys and 18·7 % of the girls were born large for gestational age (Table 1).
Table 1. Baseline characteristics of the study participants (PREDI Study, Brazil, 2012–2018)
(Numbers and percentages; mean values and standard deviations)

MW, minimum wage, US$ 359·54 = 1 MW in February 2012; ADIPOQ-T, wild-type allele; ADIPOQ-G, risk allele; LEP-G, wild-type allele; LEP-A, risk allele.
* Twenty mothers were unable to report the household income.
† Institute of Medicine recommendations.
‡ INTERGROWTH-21st standards.
§ WHO 2006 growth standard.
|| Twenty-eight children without genetic material found in the sample.
The prevalence of LGA newborns was 21·4 %. The frequencies of children with at least one risk allele were 23·3 and 62·3 % for ADIPOQ-rs2241766 and LEP-rs7799039, respectively (Table 1). The minor allele frequencies for ADIPOQ-rs2241766 and LEP-rs7799039 were 12·0 % (G allele) and 38·0 % (A allele) at baseline. In addition, the allele frequencies of both genetic variants were in Hardy–Weinberg equilibrium (online Supplementary material 2).
Longitudinal regression analysis showed that maternal excess body weight at pre-pregnancy (β = 0·339, P = 0·010) and excessive GWG (β = 0·510, P < 0·001) were associated with higher children’s BMI from birth to 6 years of age. Girls presented lower BMI trajectories (β = –0·432, P = 0·001), while large for gestational age newborns had higher BMI trajectories (β = 0·480, P < 0·001), when compared with boys and small for gestational age/appropriate for gestational age newborns, respectively (Table 2).
Table 2. Changes in BMI (kg/m²) of children from birth to 6 years of age according to sociodemographic and biological characteristics (PREDI Study, Brazil, 2012–2018)
(Numbers; mean values and 95 % confidence intervals)
MW, minimum wage, US$ 359·54 = 1 MW in February 2012; SGA, small for gestational age; AGA, appropriate for gestational age; LGA, large for gestational age; ADIPOQ-T, wild-type allele; ADIPOQ-G, risk allele; LEP-G, wild-type allele; LEP-A, risk allele.
* β refers to the longitudinal linear regression coefficient adjusted for linear, quadratic and cubic child age.
† P value refers to the restricted maximum likelihood estimator.
‡ Institute of Medicine recommendations.
§ INTERGROWTH-21st fetal growth standards.
Children carrying the TG or GG genotype of the ADIPOQ-rs2241766 variant had a higher risk of excess body weight compared with children with the TT genotype (relative risk = 1·25, 95 % CI 1·01, 1·56, P = 0·044), even after adjustment for confounders. Girls carrying the TG or GG genotype were 1·67 times more likely to have excess body weight from birth to 6 years of age than those carrying the wild-type TT genotype (95 % CI 1·20, 2·31, P = 0·002). However, the risk genotypes of LEP-rs7799039 (GA or AA) were not associated with weight status trajectory (relative risk = 0·93, 95 % CI 0·76, 1·15, P = 0·513) (Table 3).
Table 3. Poisson regression models for BMI of children according to the ADIPOQ-rs2241766 and LEP-rs7799039 genotypes (PREDI Study, Brazil, 2012, 2018 (n 174))
(Relative risks (RR) and 95 % confidence intervals)

ADIPOQ-T, wild-type allele; ADIPOQ-G, risk allele; LEP-G, wild-type allele; LEP-A, risk allele.
* Poisson regression.
† P value refers to Wald test. Model 1 was only adjusted for follow-up period as time variable. Model 2 was further adjusted for follow-up period, education (years), gestational weight gain (non-excessive/excessive) and sex (male/female).
The LME models for children’s BMI are shown in Table 4. The interaction between child age and ADIPOQ-rs2241766 genotypes was associated with children’s BMI trajectory. The effect of age on increasing body weight was slightly steeper in children carrying the TG or GG genotype compared with those with the TT genotype (β = 0·12, 95 % CI 0·01, 0·22, P = 0·010) and remained significant after adjustments (β = 0·01, 95 % CI 0·01, 0·02, P = 0·008). Child sex was found to be an effect modifier of the association between ADIPOQ-rs2241766 and BMI during infancy. When the analysis was performed by sex, only girls with the TG or GG genotype continued to show a subtle increase in body weight trajectory over time (β = 0·02, 95 % CI 0·01, 0·04, P = 0·002) (Fig. 2). The LEP-rs7799039 gene variant was not associated with BMI trajectories in children (β = 0·01, 95 % CI −0·01, 0·01, P = 0·586) (Table 4).
Table 4. Linear mixed-effect regression models for BMI of children according to the ADIPOQ-rs2241766 and LEP-rs7799039 genotypes (PREDI Study, Brazil, 2012–2018 (n 408))
(β Coefficients and 95 % confidence intervals)

ADIPOQ-T, wild-type allele; ADIPOQ-G, risk allele; LEP-G, wild-type allele; LEP-A, risk allele.
* β refers to the linear mixed-effect regression coefficient.
† P value refers to the maximum likelihood estimator. Model 1 was only adjusted for linear, quadratic and cubic child age (months). Model 2 was further adjusted for maternal education years, gestational weight gain (non-excessive/excessive) and sex (male/female).

Fig. 2. BMI (kg/m²) trajectories in children from birth to 6 years of age according to ADIPOQ-rs2241766 genotype and sex. Number of observations = 1082; number of children = 408 (male n 216; female n 192); average observations per children = 2·7. The linear mixed-effect models were adjusted for linear, quadratic and cubic child age (months), maternal education (years), maternal gestational weight gain (non-excessive/excessive) and child sex (male/female). Data are presented as the model coefficients (β) and 95 % confidence intervals, stratified by child sex. ADIPOQ-T, wild-type allele; ADIPOQ-G, risk allele. ![]() , TT;
, TT; ![]() , TG or GG.
, TG or GG.
Discussion
The present study has two main findings. First, children carrying the ADIPOQ-rs2241766 TG or GG genotype had a higher risk of excess body weight from birth to 6 years of age, even after adjustment for key covariates. Second, the risk genotype (TG or GG) of the ADIPOQ gene variant was associated with an increase in the child’s body weight over the years only in girls. Additionally, there was no association between LEP-rs7799039 and excess body weight or weight trajectories in children. Although the evaluation of excess body weight was not the objective of the present study, it is important to highlight that it was a substantial burden in this cohort, with the observation of a high prevalence throughout the years.
The minor allele frequencies of the ADIPOQ-rs2241766 and LEP-rs7799039 genetic variants found in our study were similar to those reported in studies conducted on European and other Latin-American populations(45), suggesting similarity of these genetic predictors to other populations. Our results also agree with the findings of a meta-analysis that included 5843 adults from eighteen case–control studies(Reference Wu, Liu and Meng46). The authors found that the ADIPOQ-rs2241766 genetic variant was associated with obesity in the overall populations (GG v. TT, OR = 1·39, 95 % CI 1·11, 1·73)(Reference Wu, Liu and Meng46). On the other hand, some cross-sectional studies reported results different from those found in our longitudinal analysis(Reference Peralta Romero, Karam Araujo and Burguete Garcia20,Reference Kasap, Ates and Özer47) . In a cross-sectional study on 1469 Mexican children aged 6–12 years, the authors observed no association between the ADIPOQ-rs2241766 gene variant and overweight/obesity(Reference Peralta Romero, Karam Araujo and Burguete Garcia20). Another cross-sectional study including 453 Turkish children and adolescents aged 6–17 years also found no difference in the TT (wild type) or non-TT (TG + GG) genotype between the obese and non-obese groups(Reference Kasap, Ates and Özer47). However, the lack of longitudinal studies investigating children aged 0–6 years impaired direct comparison with our results.
Adiponectin regulates several metabolic processes, including glucose homoeostasis and fatty acid oxidation(Reference Gonzalez-Muniesa, Martinez-Gonzalez and Hu1). The decrease in serum adiponectin concentration mediated by genetic variation promotes a reduction in the phosphorylation of target proteins by AMP-activated protein kinase (AMPK), which is critical for lipid and carbohydrate metabolism(Reference Lee and Shao13,Reference Arita, Kihara and Ouchi22,Reference Kroll, Mastroeni and Veugelers48,Reference Heid, Henneman and Hicks49) . Therefore, the involvement of the metabolism of many tissues may decrease energy consumption and stimulate food intake(Reference Kroll, Mastroeni and Veugelers48). It is reasonable to suppose that the ADIPOQ-rs2241766 gene variant and child age interact to change body weight trajectories over the years. Additionally, the obesogenic environment such as inadequate food habits and physical inactivity can potentiate the genetics effects over the years(Reference Llewellyn and Fildes50). According to Belsky et al. (Reference Belsky, Moffitt and Houts51), the genetic risk first manifests as a rapid growth during early childhood. After birth, children at higher genetic risk gain weight more quickly and reach adiposity earlier and consequently a higher BMI(Reference Belsky, Moffitt and Houts51). These developmental phenotypes predict adult obesity, mediating about half the genetic effect on adult obesity risk(Reference Belsky, Moffitt and Houts51). Although the children’s growth profile often contains important information about their genetic make-up and environmental exposure, BMI trajectories are difficult to model statistically because of changes in the growth rate during the childhood period(Reference Warrington, Wu and Pennell52). As observed in our study, children tend to have a fast increase in BMI from birth to the first 2 years of age. Warrington et al. (Reference Warrington, Wu and Pennell52) suggest that this increase in BMI can be explained by the fact that they reach peak adiposity at this age(Reference Warrington, Wu and Pennell52). After this period, the BMI decreases until 6 years, probably at adiposity rebound, and then progressively increases(Reference Warrington, Wu and Pennell52). In addition, we also demonstrated that girls start the BMI trajectory with lower values than boys but have an earlier rebound(Reference Warrington, Wu and Pennell52). Indeed, age and sex exert different effects on the ADIPOQ genetic variant in excess body weight, reinforcing its genetic effect on the child’s weight status.
Literature data on the life cycle effect of the LEP-rs7799039 genetic variant are contradictory. Some studies involving different adult populations revealed an association with excess body weight(Reference Boumaiza, Omezzine and Rejeb18,Reference Hinuy, Hirata and Forti42,Reference Gormus, Timirci Kahraman and Toptas53) . In contrast, other studies on children found no association between LEP-rs7799039 and obesity(Reference Eldosouky, Abdu Allah and AbdElmoneim54–Reference Cieslak, Skorczyk and Stachowiak56), in agreement with our findings. Within this context, Cieslak et al. (Reference Cieslak, Skorczyk and Stachowiak56) screened a cohort of Polish obese and non-obese children and adolescents for polymorphisms in the 5′-flanking regions of the genes encoding adiponectin, leptin and resistin and found no consistent evidence of an association between obesity and the LEP gene variant. It is important to note that, in polygenic diseases such as obesity, the environment exerts a strong influence on the phenotype and genetic variations are only one factor in the obesogenic pathway(Reference Zhang, Yuan and Xiao57). In addition to external environmental factors, the interaction with other genetic variants that may lead to different outcomes needs to be considered, which in turn also depends on the effect of the group of genes acting together.
To our knowledge, this is the first study to prospectively investigate the association of ADIPOQ-rs2241766 and LEP-rs7799039 genetic variants with excess body weight and body weight trajectories in children from birth to 6 years of age. Considering the complexity of various cumulative effects and their direction (including environmental, genetic and other biological factors), we believe that screening for a genetic predictor such as ADIPOQ-rs2241766 may contribute to the understanding of the etiopathogenesis of obesity. Identifying genetic predictors that affect the susceptibility to changes in body weight can provide insight into the pathophysiological mechanisms underlying body weight regulation and fat distribution and may thus indicate new approaches for the treatment and prevention of obesity(Reference Gonzalez-Muniesa, Martinez-Gonzalez and Hu1).
The present study has several strengths. First, the study allowed longitudinal analysis of the data and fitting models in children from birth to 6 years of age. Furthermore, the data were collected by a trained research group and most of the researchers remained on the team at baseline and follow-ups, thus reducing possible biases. However, some limitations of the present study should be highlighted. First, there were losses over the follow-ups; however, the sample has been similar since baseline and the losses were almost random. In addition, it is important to highlight that the LME models consider individuals with at least one measure of exposure and outcome. Thus, the real sample included in the models considered 408 children with 1082 observations and an average of 2·7 repeated measures per children. We observed small effects of ADIPOQ-rs2241766 (effect size f = 0·11) and LEP-rs7799039 (effect size f = 0·06) on child BMI trajectories. We further conducted post hoc power tests to compute the power achieved in the statistical analysis. Our results indicated that, for a small effect size (Cohen’s effects size f = 0·1) in the longitudinal associations, the power achieved was higher than 80 %. Finally, the self-reported variables such as pre-pregnancy weight, household income and schooling are vulnerable to reporter bias.
Conclusion
The ADIPOQ-rs2241766 TG and GG genotypes increased the risk of excess body weight in children from birth to 6 years of age. In addition, the risk of a child having higher BMI values from birth to 6 years of age and carrying the risk genotype (TG or GG) was associated with female sex. Finally, the LEP-rs7799039 genetic variant was not associated with body weight trajectory in children. Our results may encourage further studies exploring weight trajectories in order to clarify the genetic basis of sex differences in plasma adiponectin levels.
Acknowledgements
We thank the Darcy Vargas Maternity Hospital and the Gimenes Laboratory of Joinville, Santa Catarina, Brazil, for permitting the data collection at their facilities.
This research was supported by the Fundo de Apoio à Pesquisa – FAP/UNIVILLE, Brazil (grant numbers 4555/2011, 01/2014 and 02/2016), and by the Coordenação de Aperfeiçoamento de Pessoal de Nível Superior – CAPES, Brazil (grant number 88887.149709/2017-00).
C. K. formulated the research question, collected and analysed the data, and wrote the manuscript. D. R. F. analysed the data and revised the manuscript. G. K. suggested analyses and critically revised the manuscript. P. H. C. F. revised the manuscript. M. F. M. organized and designed the study, formulated the research question, and revised the manuscript.
The authors declare that there are no conflicts of interest.
Supplementary material
For supplementary materials referred to in this article, please visit https://doi.org/10.1017/S0007114520002780


