


Various studies have been conducted exploring diet and dietary components in relation to, both from all-cause and cause-specific mortality( Reference Schwingshackl and Hoffmann 1 ). There has recently been a shift in the focus from individual nutrient and food studies to dietary pattern studies because dietary components are consumed in combination and are correlated with one another( Reference Ocke 2 ). With the dietary pattern approach overall quality of takes into account the complexity of the diet and the potentially synergistic or antagonistic effects of individual dietary components( Reference Jacobs and Steffen 3 ).
Chronic inflammation is known to be associated with a variety of chronic health conditions including arthritis, diverticulitis, CVD, diabetes( Reference Ouchi, Parker and Lugus 4 – Reference Miller and Cappuccio 6 ), and common epithelial cancers, with colorectal cancer (CRC)( Reference Chung and Chang 7 – Reference Toriola, Cheng and Neuhouser 9 ) being the most extensively studied. Dietary factors can contribute to an individual’s underlying state of chronic inflammation( Reference Lin 10 , Reference Wogan, Hecht and Felton 11 ) and there is growing evidence that specific dietary components influence inflammation( Reference de Mello, Schwab and Kolehmainen 12 – Reference Luciano, Mottus and Starr 14 ), potentially influencing risk of all-cause, cancer and cardiovascular mortality( Reference Chang, Lazo and Appel 15 – Reference Deng, Song and Manson 18 ). We previously showed in the Whitehall II cohort that a high score in Alternative Healthy Eating Index (AHEI) score was associated both with inflammatory markers and mortality risk.
The Dietary Inflammatory Index (DII) was developed to characterize an individual’s diet on a continuum from maximally anti- to pro-inflammatory( Reference Shivappa, Steck and Hurley 19 ). Thus far, the DII has been found to be associated with C-reactive protein (CRP)( Reference Shivappa, Steck and Hurley 20 , Reference Wirth, Burch and Shivappa 21 ), IL-6( Reference Shivappa, Hebert and Rietzschel 22 – Reference Wood, Shivappa and Berthon 24 ), and TNF-α ( Reference Tabung, Steck and Zhang 23 ). Until now, the DII has been applied to mortality outcomes only in four cohort studies and no overall evaluation of this evidence exists. As the creation of the AHEI in 2002 which was based on foods and nutrients predictive of chronic disease risk, substantial evidence has emerged to support a role of additional dietary factors in the development of chronic disease and a new measure of diet quality that incorporates current scientific evidence on diet and health has been proposed: the AHEI-2010( Reference Chiuve, Fung and Rimm 25 ). In this analysis, we assessed the association between the DII, the AHEI-2010 and all-cause, cardiovascular, and cancer mortality risk in a population-based prospective cohort of British men and women participating in the Whitehall II cohort. A secondary objective was to summarise the overall evidence of the association between DII and mortality from the Whitehall II study and all previous studies using meta-analysis.
Methods
Study population
Participants of the Whitehall II study were London-based office staff, aged 35–55 years, who worked in 20 civil service departments at study inception( Reference Marmot and Brunner 26 ). Baseline screening (phase 1: 1985–1988, n 10 308) consisted of a clinical examination and a self-administered questionnaire. Subsequent phases of data collection alternated between a clinical examination along with a questionnaire survey (phase 3: 1991/1993, n 8815; phase 5: 1997/1999, n 7263; phase 7: 2002/2004, n 6943; phase 9: 2007/2009) and a postal questionnaire alone (phases 2, 4, 8 and 10). After the study was described to each participant, written informed consent was obtained. The University College London Ethics Committee approved the study. Phase 3 (1991–1993) was considered the baseline for the purpose of this study, because it was the first assessment of the AHEI-2010 and DII. Analyses were carried out on the 7627 participants alive at phase 3 with information on vital status and with complete data on dietary indices and covariates at phase 3.
Dietary assessment
Dietary intake at phase 3 was assessed with the use of a semi-quantitative FFQ with 127 food items, as described previously( Reference Akbaraly, Ferrie and Berr 27 , Reference Brunner, Stallone and Juneja 28 ). The validity and the reliability of the FFQ in terms of nutrient and food consumption have been documented in detail both in our cohort and in another independent UK cohort( Reference Brunner, Stallone and Juneja 28 , Reference Bingham, Gill and Welch 29 ). The selected frequency category for each food item was converted to a daily intake. Nutrient intakes were computed by multiplication of the consumption frequency for each food by its nutrient content (for specified portions), and then the nutrient contributions from all foods were summed. Frequency of consumption for multivitamin supplements was also collected. Nutrient values were calculated with the use of a computerised system developed for the Whitehall II dietary data.
Alternative Healthy Eating Index 2010
Scoring criteria for AHEI-2010 are described in detail elsewhere( Reference Chiuve, Fung and Rimm 25 ). The AHEI-2010 is based on eleven components: six components for which the highest intakes were supposed to be ideal (vegetables, fruit, whole grains, nuts and legumes, long chain n-3 fats (DHA and EPA), and PUFA), one component for which moderate intake was supposed to be ideal (alcohol), and four components for which avoidance or lowest intake were supposed to be ideal (sugar sweetened drinks and fruit juice, red and processed meat, trans-fat, and Na). Each component is given a minimal score of 0 and a maximal score of 10, with intermediate values scored proportionally, and has the potential to contribute 0–10 points to the total score. All the component scores are summed to obtain a total AHEI-2010 score, which ranges from 0 to 110, with a higher score representing a healthier diet (see online Supplementary Material for the distribution of the baseline score).
Dietary inflammatory index
The DII is based on literature published through 2010 linking diet to inflammation. Developing the DII involved reviewing and scoring nearly 2000 scientific articles on diet and six inflammatory markers (i.e. CRP, IL-1β, IL-4, IL-6, IL-10 and TNF-α) based on cell culture and laboratory animal experiments, and cross-sectional, longitudinal and intervention trials in humans. Individual intakes of food parameters on which the DII is based have then been compared with a world standard database of dietary intake based on datasets from eleven different regions worldwide. A complete description of the DII is available elsewhere. In brief, to calculate DII scores for participants in this study, the dietary data at phase 3 were first linked to the world database that provided a robust estimate of a mean and standard deviation for each parameter( Reference Shivappa, Steck and Hurley 19 ). These then become the multipliers to express an individual’s exposure relative to the ‘standard global mean’ as a z score. This is achieved by subtracting the ‘standard global mean’ from the amount reported and dividing this value by the standard deviation. To minimise the effect of ‘right skewing’, we converted this value to a centred percentile score. The centred percentile score for each food parameter for each individual was then multiplied by the respective food parameter-specific inflammatory effect score, which was derived from the literature review, in order to obtain a food parameter-specific DII score for an individual. All of the food parameter-specific DII scores were then summed to create the overall DII score for each participant in the study( Reference Shivappa, Steck and Hurley 19 ). A description of validation of the DII, including comparing hs-CRP values to DII derived from both dietary recalls and a structured questionnaire similar to an FFQ, is available elsewhere( Reference Shivappa, Steck and Hurley 19 ). More negative values represent more anti-inflammatory diets. The DII score when calculated from all forty-five food parameters could range from a global minimum of –8·87 (maximally anti-inflammatory) to a global maximum +7·98 (maximally pro-inflammatory), though the typical observed range in most studies where DII is calculated from an average of twenty-seven food parameters is from about −5·5 to +5·5( Reference Wood, Shivappa and Berthon 24 , Reference Shivappa, Bosetti and Zucchetto 30 , Reference Shivappa, Prizment and Blair 31 ). Details regarding the construct validation of the DII have been detailed elsewhere( Reference Shivappa, Steck and Hurley 19 ). In the present study, a total of twenty-seven of forty-five food parameters were available from the FFQ and were used to calculate the DII. These include energy, carbohydrate, protein, total fat, alcohol, fibre, cholesterol, SFA, MUFA, PUFA, n-3, n-6, trans-fat, niacin, thiamine, riboflavin, vitamin B12, B6, Fe, Mg, Zn, Se, vitamin A, vitamin C, vitamin D, vitamin E, folic acid. Steps involved in the DII calculation are described in the online Supplementary Fig. A. DII scores were calculated from nutrients derived only from dietary items.
We compute the AHEI-2010 and the DII scores from each FFQ administrated in phase 3 (1991–1993), phase 5 (1997–1999) and phase 7 (2002–2004). To reduce measurement errors and to represent long-term dietary intake, we calculated the cumulative average of AHEI-2010 and DII.
Mortality assessment
The Whitehall II study is linked to the National Health Services death and electronic patient records with the use of the National Health Services identification number assigned to all British citizens. A total of 10 297 participants (99·9 %) were successfully traced and have been followed through these registries. Mortality data, which included the date and cause of death, were available through the National Health Services Central Registry until 28 February 2015. Death certificates were coded with the use of the 9th or 10th revision of the International Classification of Diseases (ICD) (http://www.who.int/classifications/ icd/en/). We analysed all-cause mortality and mortality from specific causes, such as CVD (ICD-9 codes 390.0–458.9 and ICD-10 codes I00–I99) and cancer (ICD-9 140.0–209.9 and ICD-10 C00–C97). Non-cancer/non-CVD mortality includes all remaining deaths that are classified neither as cancer nor CVD, and included deaths from diseases of the respiratory system (most common other cause of death), digestive system, or nervous system; injuries; poisoning; and external causes.
Covariates
Socio-demographic variables consisted of age, sex, ethnicity (White/South Asian/Black), marital status (married or cohabiting v. living alone) and occupational position with the use of current (or last, for retired participants) British civil service employment grade, defined on the basis of salary and grouped into three categories: high (senior administrators)/intermediate (executives, professionals and technical staff)/low (clerical and office support staff) grades.
Health behaviours included in the analysis were smoking (current/former/non-smoker), total energy intake estimated from the FFQ (in kJ/d (kcal/d)), alcohol intake patterns (none: 0 glass/d, moderate: <2 (3) glasses/d for women (men), and heavy consumption: ≥2 (3) glasses/d for women (men)) and physical activity assessed via questionnaire data and categorised into three groups (high, intermediate, low) according to frequency of participation in ‘vigorous’ (e.g. running, hard swimming, playing squash), ‘moderately energetic’ (e.g. dancing, cycling, leisurely swimming) and ‘mildly energetic’ physical activity( Reference Sabia, Dugravot and Kivimaki 32 ) . Health status was ascertained with the use of a number of measures: prevalence of CVD on the basis of clinically verified events, which included non-fatal myocardial infarction, definite angina, self-reported stroke or transient ischaemic attack; hypertension (systolic or diastolic blood pressure ≥140 or ≥90 mmHg, respectively, or use of hypertensive drugs); concentration of HDL-cholesterol (mmol/l), use of lipid-lowering drugs; type 2 diabetes (diagnosed with the use of the WHO definition); BMI (kg/m2) and self-reported longstanding illness (participants responded to a question asking if they had a longstanding illness: yes/no).
Covariates were obtained from the baseline questionnaire (phase 3) and updated every 5 years (at phase 5 and phase 7). All variables (other than sex and ethnicity) included time-varying covariates.
Statistical analysis
Characteristics of participants as a function of mortality status were first described and tested using χ tests for categorical variables and Student t test for continuous variables. Next, comparison of characteristics associated with DII and AHEI-2010 tertiles were performed using chi-square tests for categorical variables and ANOVA for continuous variables. Associations between AHEI-2010 and DII tertiles were assessed using chi-square tests.
The main analyses consisted of exploring the association between the risk of mortality and the cumulative average of AHEI-2010 and DII scores in the Whitehall II cohort. Stratified proportional Cox hazard models analyses were used to calculate hazard ratios (HR) and 95 % CI for death. In these analyses the AHEI-2010 and DII were first considered as continuous variables by using z scores. Then AHEI-2010 and DII were categorised into tertiles, with the lowest tertile serving as the reference group for both indices. We calculated a test for trend across the tertiles of the AHEI-2010 and DII score by treating the categories as an ordinal variable in a proportional hazards model. We used three multivariable models, In model 1 we adjusted age, sex and ethnicity; in model 2 we additionally adjusted for occupational grade, living alone, smoking habits, alcohol consumption (only for DII), physical activity; and model 3 was further adjusted for health status factors including BMI, antecedent of CVD, use of lipid-lowering drugs, HDL-cholesterol, hypertension, type 2 diabetes and longstanding illness. These time-varying covariates were chosen a priori as they previously had been shown to be strong risk factors for mortality in this cohort. To minimise the effect of missingness, we replaced missing data on these covariates with the last valid values. These analyses of the association between DII, AHEI-2010 and overall mortality were repeated for cause-specific mortality including cardiovascular and cancer mortality. Stratified analyses also were carried out by tertiles of energy intake. Analyses were performed using SAS® statistical software, version 9.4.
A second analysis focused on meta-analysis of DII results from Whitehall II plus all four previous studies. To date, there have been four other studies( Reference Graffouillere, Deschasaux and Mariotti 33 – Reference Shivappa, Harris and Wolk 36 ) published on the DII and mortality. We synthesised this evidence by pooling effect estimates from those studies and the current study. As the number of studies was modest( Reference Guolo and Varin 37 ) fixed-effects meta-analysis was used. For comparison, we repeated the analysis using an alternative approach, random-effects meta-analysis. We used continuous DII score as the exposure because results for that variable were available from all five studies and therefore could be compared directly. Mortality analyses were restricted to deaths from all-causes, cancer and CVD. Heterogeneity in study-specific estimates was evaluated using I2 statistics. All meta-analyses were performed using Stata®, version MP.13·1 with the ‘metan’ command (online Supplementary Table F).
Results
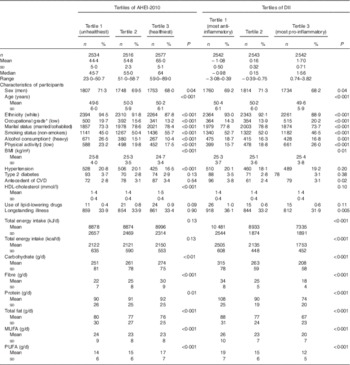
Analyses from the Whitehall II study were carried out on the 7627 participants alive at phase 3 with information on vital status and with data on dietary indices and covariates as described in the flow chart mapping the selection of participants (online Supplementary Fig. B). Characteristics of these participants as a function of mortality status are detailed in the online Supplementary Table A. Cumulative distribution of AHEI-2010 and DII score are presented in Table 1. DII had a mean value of 0·37 (sd 1·41), with a range from −3·28 (most anti-inflammatory score) to +4·54 (most pro-inflammatory score). AHEI had a mean value of 48·7 (sd 10·0), with a range from 15·5 (least healthy diet) to 85·5 (healthiest diet). Participants in the highest tertile of AHEI-2010 (reflecting a healthier diet) compared with those in the lowest tertile (reflecting an unhealthier diet) were less likely to be men, white with a low socioeconomic position and more likely to be older, to be married, and to have healthy behaviours (smoking habits, alcohol consumption and physical activity). Their average mean of total energy intake was also higher. Regarding health factors, the group of participants in the highest tertile of AHEI-2010 were less likely to have hypertension, they showed higher means of HDL-cholesterol and lower means of BMI. Regarding nutrients, participants in the highest tertile of AHEI-2010 had higher carbohydrate, fibre, protein and PUFA and lower total fat and MUFA consumption. Similar pattern of socio-demographic, health behaviour, health status factors and nutrients associated with DII tertiles were observed.
Table 1 Description of Cumulative average of Alternative Healthy Eating Index 2010 (AHEI-2010) and Dietary Inflammatory Index (DII) score categorised in tertile according to participants characteristics (Mean values and standard deviations; medians and ranges; numbers and percentages)
* Occupational position with the use of current (or last for retired participants) British civil service employment grade, was defined on the basis of salary and grouped into three categories: high (senior administrators)/intermediate (executives, professionals and technical staff)/low (clerical and office support staff) grades.
† Alcohol intake categories were defined as none: 0 glass/d; moderate: <2 (3) glasses/d for women (men); and heavy consumption: ≥2 (3) glasses/d for women (men).
‡ Physical activity was categorised into three groups (high, intermediate, low) according to frequency of participation in ‘vigorous’ (e.g. running, hard swimming, playing squash), ‘moderately energetic’ (e.g. dancing, cycling, leisurely swimming) and ‘mildly energetic’ physical activity.
The correlation coefficient between AHEI-2010 and DII was −0·41. In Table 2 we show that 54·4 % of participants in tertile 1 of DII; that is, with the most anti-inflammatory diets, are in tertile 3 of AHEI-10 (corresponding to the healthiest diet) and 51·9 % of participants in tertile 3 of DII, that is, with the most pro-inflammatory diets, are in tertile 1 of AHEI (corresponding to the unhealthiest diet). However, there is some discordance, 18·1 % of participants in the most anti-inflammatory group (tertile 1) of DII are in the unhealthiest diet group for AHEI-2010
Table 2 Relationship between Alternative Healthy Eating Index 2010 (AHEI-2010) and Dietary Inflammatory Index (DII) (Numbers and percentages)

In total, 1001 total deaths were identified during the 22 years of follow-up; 450 cancer deaths, 254 cardiovascular deaths. As illustrated in Fig. 1 and 2, both AHEI-2010 and DII were associated with all-cause mortality. Whatever the model, for each sd increment of AHEI-2010 (9·8 points) a 20 % reduced risk of mortality was observed, and for DII, one increment of 1 sd (1·3 points) was associated with an increased by 20 % of mortality HR. Results of the analyses in which AHEI-2010 and DII scores were categorised in tertiles are concordant with these findings (results are presented in online Supplementary Table C). In sex-, age- and ethnicity-adjusted model, participants in the 3rd and 2nd tertiles of AHEI-2010 showed, respectively, 30 and 40 % reduced risk of all-cause mortality risk over the 22 years of follow-up. Further adjustment for health behaviours (occupational grade, living alone, smoking habits, physical activity and total energy intake) in model 2 and health status factors (BMI, antecedent of CVD, use of lipid-lowering drugs, HDL-cholesterol, hypertension, type 2 diabetes and longstanding illness) in model 3) did not substantially attenuate the association. The online Supplementary Table C shows that cumulative average of AHEI score tertiles remained significantly associated with mortality risk after full adjustment (model 3) (HRTertile 3 v. Tertile 1=0·73; 95 % CI 0·69, 0·87; HRTertile 2 v. Tertile 1=0·79; 95 % CI 0·66, 0·93; P trend<0·001). Regarding DII, participants in tertile 3 (most pro-inflammatory group) had 47 % higher risk of all-cause mortality compared with participants in tertile 1 (most anti-inflammatory group) (HRTertile 3 v. Tertile 1=1·47; 95 % CI 1·19, 1·82; P trend<0·001). Regarding the important differences in total energy intake, average means across DII tertiles, we carried out an additional analysis to describe the DII – all-cause mortality association across total energy intake tertiles. Results (online Supplementary Table B) showed that the DII was significantly associated with all-cause mortality only among participants in the lowest tertile of total energy intake (HRTertile 3 v. Tertile 1=1·72; 95 % CI 1·08, 2·72; P trend=0·02).

Fig. 1 Associations between cumulative average of Alternative Healthy Eating Index 2010 (AHEI-2010) and mortality risk over 22 years of follow-up for the 7627 Whitehall II participants. Values are hazard ratios (HR) and 95 % CI. Cox proportional hazards models estimated the HR of mortality for 1 sd of AHEI-2010. In these multivariate models (M) the covariates were time-varying variables. Model 1: model adjusted for age, sex and ethnicity. Model 2: model 1 further adjusted for occupational grade, marital status, smoking habits, physical activity and total energy intake. Model 3: model 2 further adjusted for BMI, antecedent of CVD, use of lipid-lowering drugs, HDL-cholesterol, hypertension, type 2 diabetes and longstanding illness.

Fig. 2 Associations between cumulative average of Dietary Inflammatory Index (DII) and mortality risk over 22 years of follow-up for the 7627 Whitehall II participants. Values are hazard ratios (HR) and 95 % CI. Cox proportional hazards models (M) estimated the HR of mortality for 1 sd of DII. In these multivariate models the covariates were time-varying variables. Model 1: model adjusted for age, sex and ethnicity. Model 2: model 1 further adjusted for occupational grade, marital status, smoking habits, alcohol consumption physical activity and total energy intake. Model 3: model 2 further adjusted for BMI, antecedent of CVD, use of lipid-lowering drugs, HDL-cholesterol, hypertension, type 2 diabetes and longstanding illness.
Over the 22 years of follow-up, 264 death caused by CVD occurred. Results of the association between cumulative average of AHEI-2010 and DII scores and risk of cardiovascular mortality are detailed in Fig. 1 and 2 and in the online Supplementary Table D. Higher AHEI-2010 score was consistently associated with lower risk of cardiovascular mortality whatever the level of adjustment considered (in full adjusted model, HR=0·80; 95 % CI 0·69, 0·93). Similar results were observed when tertiles of AHEI-2010 and DII were considered (AHEI-2010, HRTertile 3 v. Tertile 1=0·68; 95 % CI 0·48, 0·95; P trend=0·03); and (DII, HRTertile 3 v. Tertile 1=1·46; 95 % CI 1·00, 2·13; P trend 0·05).
Regarding cancer mortality, 450 death occurred over the follow-up. Fig. 1 shows that AHEI-2010 was significantly associated with lower risk of cancer mortality (HR=0·87; 95 % CI 0·78, 0·98). The online Supplementary Table E confirms that in sex-, age- and ethnicity-adjusted models, participants in higher tertiles of AHEI-2010 showed a lower risk of cancer mortality compared with those in the bottom tertile. However further adjustment for health behaviour and health status factors substantially attenuate the association. Participants with high DII score showed a significant higher risk of cancer mortality and this association remained statistically significant whatever way the DII was analysed and no matter the level of adjustment (Fig. 2 and online Supplementary Table E).
To our knowledge four other previous studies investigated the DII–mortality risk (all cause, and caused by CVD or by cancer). A full description of these studies is provided in Table 3. DII for the Iowa Women’s Health Study in the USA was calculated from FFQ that was adapted from the 126-item instrument developed by Willett et al., in total there were twenty-seven food parameters that were used for DII calculation and this study had information on supplement use( Reference Shivappa, Blair and Prizment 35 ). DII scores for the Swedish Mammography Cohort were calculated using a ninety-six-item FFQ from twenty-seven food parameters without supplements( Reference Shivappa, Harris and Wolk 36 ). In the National Health and Nutrition Examination Survey III study in the USA, DII was calculated using 24 h recall without supplements from twenty-seven food parameters( Reference Shivappa, Steck and Hussey 34 ). In the Supplementation en Vitamines et Mineraux Antioxydants (SUVIMAX) study conducted in France, DII was calculated using multiple 24 h records from thirty-seven food parameters( Reference Graffouillere, Deschasaux and Mariotti 33 ). We combine these results with those from the Whitehall II study. We then conducted a meta-analysis on data from the total of 91 520 participants across the five studies. Fig. 3–5 show positive associations between DII score and all-cause, cardiovascular and cancer mortality, respectively. The pooled HR from fixed and random effect models were 1·04 (95 % CI 1·03, 1·05) and 1·05 (95 % CI 1·03, 1·07) for all-cause mortality (28 891 deaths), 1·05 (95 % CI 1·03, 1·07) and 1·05 (95 % CI 1·03, 1·08) for cardiovascular mortality (10 424 deaths); and 1·05 (95 % CI 1·03, 1·07) and 1·06 (95 % CI 1·02, 1·09) for cancer mortality (8269 deaths). Thus, no differences were observed in summary estimates between the two methods of meta-analysis.

Fig. 3 Meta-analysis of studies of the association between Dietary Inflammatory Index and all-cause mortality. The boxes represent the hazards ratio and the horizontal lines represent 95 % CI. ![]() , Pooled effect obtained from combining the hazard ratio of each study. SUVIMAX, Supplementation en Vitamines et Mineraux Antioxydants; NHANES, National Health and Nutrition Examination Survey.
, Pooled effect obtained from combining the hazard ratio of each study. SUVIMAX, Supplementation en Vitamines et Mineraux Antioxydants; NHANES, National Health and Nutrition Examination Survey.

Fig. 4 Meta-analysis of studies of the association between Dietary Inflammatory Index and cancer mortality. The boxes represent the hazards ratio and the horizontal lines represent 95 % CI. ![]() , Pooled effect obtained from combining the hazards ratios of each study. SUVIMAX, Supplementation en Vitamines et Mineraux Antioxydants; NHANES, National Health and Nutrition Examination Survey.
, Pooled effect obtained from combining the hazards ratios of each study. SUVIMAX, Supplementation en Vitamines et Mineraux Antioxydants; NHANES, National Health and Nutrition Examination Survey.

Fig. 5 Meta-analysis of studies of the association between Dietary Inflammatory Index and CVD mortality. The boxes represent the hazards ratio and the horizontal lines represent 95 % CI. ![]() , Pooled effect obtained from combining the hazards ratios of each study. NHANES, National Health and Nutrition Examination Survey.
, Pooled effect obtained from combining the hazards ratios of each study. NHANES, National Health and Nutrition Examination Survey.
Table 3 Characteristics of included studies (Mean values and standard deviations)

DII, Dietary Inflammatory Index; NHANES, National Health and Nutrition Examination Survey; HRT, hormone replacement therapy; SUVIMAX, Supplementation en Vitamines et Mineraux Antioxydants.
Discussion
In this prospective cohort study of 7627 British men and women, adherence to healthy diet assessed by the AHEI-2010 was associated with lower risk of all-cause, cardiovascular mortality and in a lesser extent to cancer mortality while participants with higher DII– reflecting a consumption of a pro-inflammatory diet- showed higher risk of all-cause, cardiovascular and cancer mortality. Meta-analyses of the DII –mortality risk reported in this study along with those from previous cohort studies, consisting of a total of 91 520 participants, confirmed a higher risk of overall, cardiovascular and cancer mortality in individuals with a high DII score.
We observed concordance between the two dietary indices, DII and AHEI-2010. More than 50 % of the participants in the healthiest group of AHEI-2010 were in the most anti-inflammatory group and similar results were observed for the least healthy and most pro-inflammatory groups of AHEI-2010 and DII, respectively. This is along expected lines because components, such as vegetables and fruits, which contribute to healthier AHEI-2010 scores, also contribute to anti-inflammatory DII scores. Both adherence to a diet high in AHEI-2010 score and a diet low in DII scores constitutes a healthy diet. We did observe some discordance between the two indices. The importance of dietary features common to all: higher intakes of whole grains, vegetables, fruit and plant-based components which contribute a range of phytochemicals with potential to impact disease risk through different mechanisms working at different stages of cancer initiation and development. Differences between different indices and outcomes may reflect how other items such as fruit juice, green leafy vegetables and low-fat dairy products were considered differently by the different indices. The DII is based on the idea that many disease-determining mechanisms operate in a pro-inflammatory environment( Reference Shivappa, Prizment and Blair 31 ), whereas the AHEI-2010 is based on foods and nutrients predictive of chronic disease risk( Reference Chiuve, Fung and Rimm 25 ). The most anti-inflammatory diets are likely to include foods that feature prominently in other ‘high-quality diets’.
AHEI-2010 was found to predict all-cause, cardiovascular and cancer mortality. These results fall in line with a recent meta-analysis conducted by Onvani et al.( Reference Onvani, Haghighatdoost and Surkan 38 ) investigating how diet quality indices as assessed by Healthy Eating, AHEI relate to all-cause and specific causes of mortality (cardiovascular mortality, cancer mortality). Conversely previous studies examining the DII-mortality association produced mixed findings. In the Swedish Mammography study, DII was positively associated with all-cause and digestive cancer mortality, but not with overall cancer mortality( Reference Shivappa, Harris and Wolk 36 ). In the Iowa Women’s Health Study, increasing DII was associated with greater risk of all-cause, CVD, digestive tract cancer, CHD and chronic obstructive pulmonary disease mortalities( Reference Wood, Shivappa and Berthon 24 ). Among digestive tract cancers, CRC is known to be strongly related to inflammation( Reference Erlinger, Platz and Rifai 39 – Reference Nikiteas, Tzanakis and Gazouli 42 ) and represents the majority of digestive tract cancers( Reference Shivappa, Steck and Hurley 20 , Reference Herszenyi and Tulassay 43 ). The DII has been shown to be associated with various digestive tract cancers including CRC( Reference Shivappa, Prizment and Blair 31 , Reference Shivappa, Bosetti and Zucchetto 44 – Reference Tabung, Steck and Ma 48 ) and with CVD( Reference O’Neil, Shivappa and Jacka 49 – Reference Garcia-Arellano, Ramallal and Ruiz-Canela 51 ). In a couple of other studies, the DII was shown to be associated with increased prostate cancer mortality( Reference Graffouillere, Deschasaux and Mariotti 33 , Reference Zucchetto, Gini and Shivappa 52 ). Our meta-analysis including all data available confirm an association between DII, all-cause mortality, CVD mortality and overall cancer mortality. Participants with higher DII scores showed lower mean of total energy intake compared with participants with high DII score. Conversely participants in the highest tertile of AHEI-2010 were more likely to have higher total energy intake. One possibility is that the overall higher intake of food (contributing to higher overall energy intake) would encompass many anti-inflammatory dietary components amongst Whitehall II participants who consume higher amounts of food in general.
Although the mechanisms of how a healthy diet reduces mortality are not known, a plausible pathway is that a pro-inflammatory diet increasing systemic inflammation also increases insulin resistance( Reference Esmaillzadeh, Kimiagar and Mehrabi 53 , Reference Festa, D’Agostino and Howard 54 ). Higher consumption of food items such as meat and butter and lower consumption of food items like vegetables and fruits has been shown to increase systemic inflammation by increasing levels of high-sensitivity CRP, E-selectin and soluble vascular cell adhesion molecule-1( Reference Esmaillzadeh, Kimiagar and Mehrabi 53 ), which are then responsible for increasing insulin resistance( Reference Festa, D’Agostino and Howard 54 ). Insulin resistance caused by increasing circulating levels of insulin, TAG, and NEFA( Reference Bruce, Wolever and Giacca 55 , Reference Bruce, Giacca and Medline 56 ) is associated with an increased risk of chronic diseases, such as CVD, which can be fatal. On the other hand, the cardio-protective role of higher scores on the AHEI-2010 could be explained by other biological mediators such as arrhythmia, thrombosis, and insulin resistance( Reference Neelakantan, Naidoo and Koh 57 ).
Our study has several strengths. First, it is population-based and employs a prospective design. It also, benefits from complete ascertainment of deaths through the National Health Services Central Registry until 31 August 2014, and detailed information on diet. This study also had a long follow-up for the outcomes studied. Although the DII has been used to predict mortality in a European; that is, Swedish cohort( Reference Shivappa, Harris and Wolk 36 ), this is the first time the DII has been used in a cohort study in Britain whose population and dietary habits are more diverse than in Sweden( Reference Murakami and Livingstone 58 , Reference Lundberg-Hallén and Öhrvik 59 ). The main limitation of this study was that information on diet was self-reported, which can lead to a potential misclassification of the exposure. Classification errors in our prospective study, however, were non-differential with respect to the occurrence of death and most likely led to an attenuation of the results. Dietary data were available only at one-time point. Participants’ dietary habit might have changed during the follow-up period. However, previous studies have reported that dietary pattern classification is moderately stable over long periods of time during adulthood( Reference Jain, Howe and Harrison 60 – Reference Thompson, Metzner and Lamphiear 65 ). Another important limitation of the study includes non-availability of information on the remaining eighteen food parameters for DII calculation. For Britain, with a diverse population which includes several Asian populations, availability of information on food parameters such as spices might be expected to evince different results with a more diverse food list.
In conclusion, diet indices – the AHEI-2010 and DII – that possibly reflect pro/anti-inflammatory properties of diet are associated with long-term all-cause, cardiovascular and cancer mortality in the UK Whitehall II study. Future steps might include investigating how these dietary indices are related to chronic inflammation and associated biomarkers.
Acknowledgements
The authors thank all of the participating civil service departments and their welfare, personnel and establishment officers; the British Occupational Health and Safety Agency; the British Council of Civil Service Unions; all participating civil servants in the Whitehall II study; and all members of the Whitehall II study team. The Whitehall II Study team comprises research scientists, statisticians, study coordinators, nurses, data managers, administrative assistants and data entry staff, who make the study possible.
Study was supported by grants from the UK Medical Research Council (MRC, K013351); the British Heart Foundation; the British Health and Safety Executive; the British Department of Health; the National Heart, Lung, and Blood Institute (R01HL036310); the National Institute on Aging, NIH (R01AG013196 and R01AG034454); and the Agency for Health Care Policy and Research (grant HS06516). Drs N. S. and J. R. H. were supported by grant no. R44DK103377 from the US National Institute of Diabetes and Digestive and Kidney Diseases. Professor M. K. was supported by the MRC and NordForsk.
M. K. designed and conducted the study; N. S. calculated the DII scores and wrote the first draft of the manuscript; T. A. performed analyses and worked on the methods and results sections of the manuscript. N. S., J. R. H., M. K. and T. A. provided suggestions and revised the manuscript. All the authors approved the final version of the manuscript.
Dr J. R. H. owns controlling interest in Connecting Health Innovations LLC (CHI), a company planning to license the right to his invention of the DII from the University of South Carolina in order to develop computer and smart phone applications for patient counselling and dietary intervention in clinical settings. Dr N. S. is an employee of CHI. The subject matter of this paper will not have any direct bearing on that work, nor has that activity exerted any influence on this project.
The authors declare that there are no conflicts of interest.
Supplementary material
For supplementary material/s referred to in this article, please visit https://doi.org/10.1017/S0007114517001908


