


The term cardiometabolic risk (CMR) refers to clinical abnormalities that predict chronic disease, such as CVD and/or type 2 diabetes. The term was proposed by the American Diabetes and Heart Associations and has been adopted by scientists and clinicians to describe a set of clinical signs that include hyperinsulinaemia, abdominal obesity, atherogenic dyslipidaemia (reduced HDL-cholesterol and hypertriglyceridaemia) and elevated blood pressure (BP)( Reference Moschonis, Tsoutsoulopoulou and Efstathopoulou 1 , Reference Eckel, Kahn and Robertson 2 ).
Nowadays, these clinical findings are more frequently diagnosed in youth as a consequence of the worldwide increase in the prevalence of individuals who are overweight or obese( 3 – Reference Cabandugama, Gardner and Sowers 6 ) and as result of unsuccessful strategies to prevent this tendency. Their association with metabolic and vascular abnormalities, the impact on costs to health systems and the low quality of life associated with chronic diseases are concerns among medical societies( 7 – Reference Lobstein, Jackson-Leach and Moodie 9 ). Early exposure to these alterations may contribute to the premature development of atherosclerosis, hypertension and diabetes mellitus in adolescence or during adulthood( Reference Agirbasli, Tanrikulu and Berenson 10 – Reference Hobbs, Pearson and Foster 12 ).
Considering that adolescents are mainly attracted to unhealthy lifestyles (e.g. sedentary habits, time spent using electronics, meal skipping and a low preference for food with good nutritional value) and are subject to hormonal changes associated with sexual maturation, adolescence can be considered as a vulnerable period of life in terms of CMR( Reference Agirbasli, Tanrikulu and Berenson 10 , Reference Camhi and Katzmarzyk 13 ).
Considering the risk factors associated with lifestyle that adolescents are exposed to, dietary quality is a major contributor and has been considered an important modifiable risk factor for the prevention of cardiometabolic alterations( Reference Funtikova, Navarro and Bawaked 14 ). High-quality diets characterised by high intake of fruit, vegetables, legumes, dairy products, whole grains and nuts, which are more evident in prudent/healthy dietary patterns, are associated with protective effects against cardiometabolic diseases among adults( Reference Rodríguez-Monforte, Flores-Mateo and Sánchez 15 – Reference Clar, Al-Khudairy and Loveman 17 ). Among adolescents, such evidence is scarce because few studies have tested the association between dietary patterns and CMR factors and because of the lack of consensus of standardised cut-off points to classify the outcomes in this group, making it difficult to compare studies conducted worldwide( Reference Silva, Lyra and Lima 18 , Reference Rocha, Milagres and Longo 19 ). Therefore, in this investigation, the impact of healthy/unhealthy dietary patterns was evaluated on the mean values of cardiometabolic markers in adolescents. The findings support the lack of consensus in this field through the consolidation of studies that have investigated this relationship. Furthermore, they will contribute to developing intervention programmes and to defining preventive strategies to decrease the progression of CVD in this stage of life.
Thus, the objective of this systematic review and meta-analysis was to systematise and synthesise the results of observational studies with the aim of demonstrating the association between dietary patterns and CMR factors among adolescents.
Methods
Search strategy
From April to June 2017, two researchers independently searched MEDLINE via PubMed, EMBASE, SCIENCE DIRECT, LILACS, WEB OF SCIENCE and SCOPUS. The search criteria were not limited by study publication date, and researchers used the following combination of Medical Subject Heading (MeSH) terms, exploding all trees: ‘Dietary Pattern’ OR ‘Food Pattern’ AND ‘Blood Pressure’ OR ‘Diastolic’ OR ‘Systolic’ AND ‘Cholesterol’ AND ‘Blood sugar’ OR ‘Blood glucose’ OR ‘Fasting Glucose’ AND ‘Triglycerides’ OR ‘Triacylglycerol’ AND ‘Waist circumference’ AND ‘Adolescent’ OR ‘Teen*’.
The search strategy retrieved 4847 articles, and the researchers concluded which studies would be finally selected for data synthesis according to the inclusion and exclusion criteria presented in Table 1. Any disagreement between the researchers during the study selection period was resolved through discussion with a third researcher. The reference lists of the identified papers and thematic reviews were searched, and eleven additional studies were identified. The abstracts from the data sources were pooled and imported into the Endnote Reference Manager in its online version. Fig. 1 summarises the study selection process.
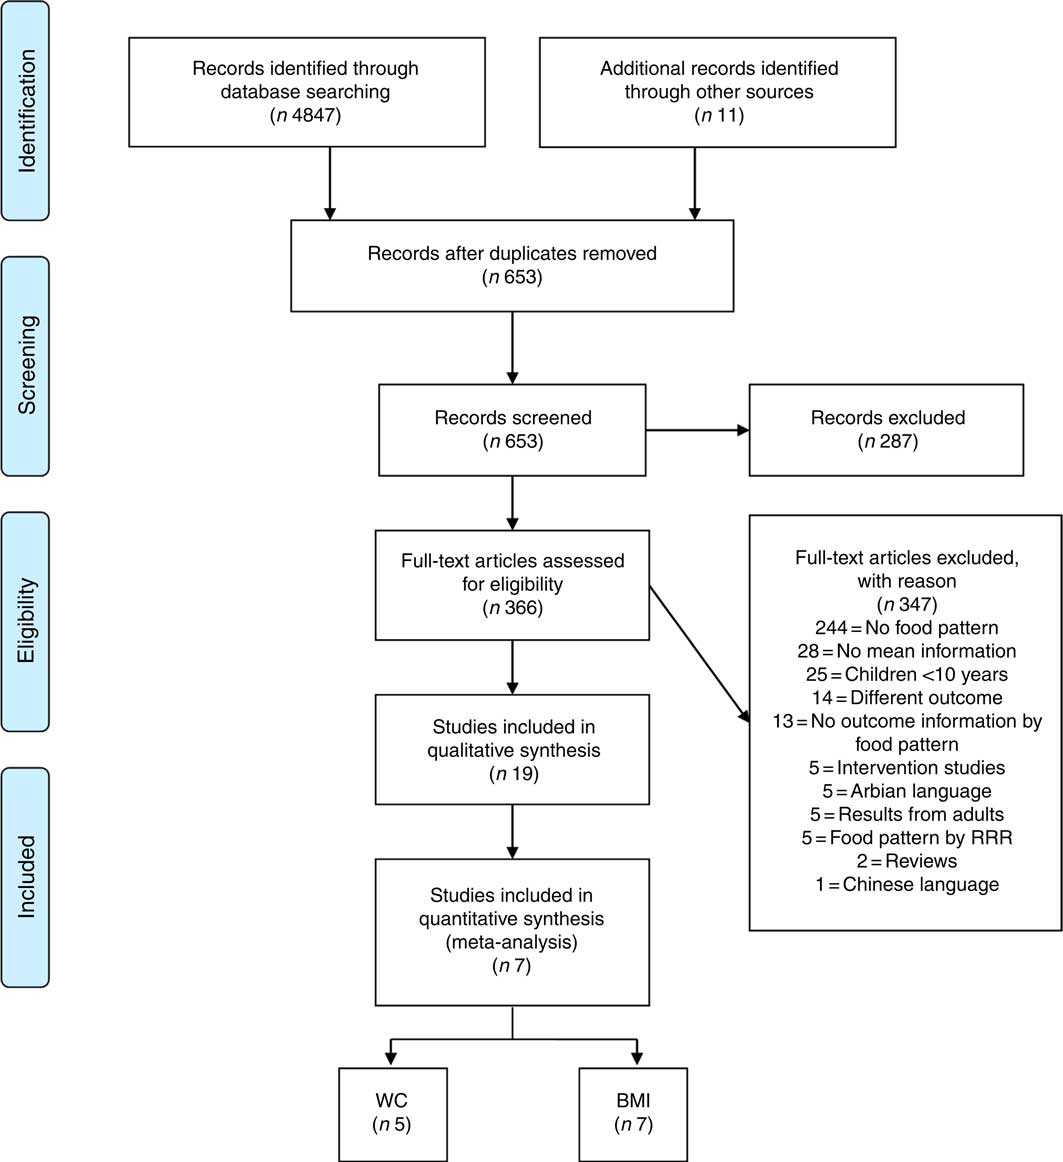
Fig. 1 Flow diagram of the study selection process. RRR, reduced rank regression; WC, waist circumference.
Table 1 Inclusion and exclusion criteria for the selection of observational studies
Data extraction and quality assessment
For each original article included in the final list, the reviewers downloaded and read the entire publication and extracted the following data into a standardised Excel sheet to evaluate quality and to synthesise the evidence: author, year of publication, study’s country, sample size, sex, age range, type of study, outcome measurement method, diet assessment method, statistical method used to obtain the food pattern, labels of the identified healthy and unhealthy patterns and the food components, and means and standard deviations of the outcomes of interest.
The results of outcomes presented for the metabolic syndrome, dyslipidaemia, hypertension and insulin resistance were not included considering the variety and low standardisation of cut-off points and references adopted by the scientific community. The classification of healthy and unhealthy patterns was followed according to the authors’ descriptions. When two or more healthy or unhealthy patterns were presented, the researcher considered a healthy pattern to mostly include protective foods, such as fruits, legumes, vegetables, lean meats, whole cereals, oils, seeds, tea, natural juice, dairy products and others. An unhealthy pattern mostly consisted of risky foods, such as fast foods, snacks, sugared drinks, candies, trans-fat and saturated fat sources, fried foods, sugar intake and others. All discrepancies were identified and resolved through discussion, and a third author was included when necessary. Missing data were requested by sending an email to the correspondence author with successful feedback. When outcomes were reported using different measurement units, the units were converted to the most commonly used units in the literature.
The assessment of risk of bias was conducted by two independent reviewers to determine the quality of the included studies. We used a validated reference that was published by Viswanathan & Berkman( Reference Viswanathan and Berkman 20 ) to evaluate the risk of bias and precision of observational studies. The Research Triangle Institute (RTI) Item Bank on Risk of Bias and Precision of Observational Studies includes a range of different study designs, and the authors have provided instructions regarding what items to use depending on the studies under assessment. Considering the author recommendation and the type of studies included in this article, we adopted twelve items to evaluate cross-sectional studies (inclusion/exclusion criteria, recruitment strategy, selection of the comparison group, blinding of outcome assessor and validation of measures) and fifteen items for cohort studies (three additional questions about study length and the impact of losses during follow-up). It was decided that a cross-sectional study with four or more of the key items being rated negative or unclear could not be rated as low risk of bias. Similarly, cohort studies with five or more negative or unclear items were considered potentially biased studies.
Statistical analysis
The association between dietary patterns and outcome variables and the respective CI (95 % CI) were quantified by synthesising the data that were extracted using meta-analysis techniques. Random effects models were considered to compare the results between exposure to smaller amounts of food v. larger amounts of food that comprised healthy and unhealthy eating patterns because high heterogeneity was observed among selected studies. To obtain the mean differences among the outcomes, the way in which these outcomes were measured was considered. The standardised mean difference (SMD) and weighted mean difference (WMD) were used to evaluate outcomes that were measured following distinct techniques and those obtained by similar methods, respectively( Reference Higgins and Green 21 ).
The heterogeneity among the subgroups was quantified and tested with the I 2 test. To explore the sources of heterogeneity, we evaluated whether the study results differed according to the sample size and mean age of the study population. Considering the reduced number of included studies, the potential publication bias using visual inspection of the funnel chart was not evaluated. Meta-regression analysis was performed on variables that could influence heterogeneity, such as BMI, mean age and sample size of the studies. Energy intake in quintiles/quartiles/tertiles was not used as part of the meta-regression because it was not informed by most of the studies included in the meta-analysis. Furthermore, we undertook the sensibility analysis to investigate the sources of heterogeneity in the meta-analysis. All statistical tests were two-sided (P<0·05), and calculations were conducted using the software STATA (StataCorp. 2013, Stata Statistical Software: Release 13; StataCorp LP).
Results
Study selection
The search strategy retrieved 4847 articles from the accessed databases. Of these articles, 4194 articles were excluded after duplication screening, and 287 articles were excluded on the basis of title and abstract content. Full-text reading of 366 articles resulted in the exclusion of 347 articles, resulting in nineteen articles for qualitative analysis and seven articles for quantitative analysis. The final number of quantitative studies for each outcome is presented in Fig. 1, considering that a single study may present one or more outcome results of interest for this research.
The selected studies were conducted in Australia( Reference Ambrosini, Huang and Mori 22 , Reference McNaughton, Ball and Mishra 23 ), America( Reference Ochoa-Avilés, Verstraeten and Lachat 24 – Reference Zamora-Gasga, Montalvo-González and Loarca-Piña 28 ), Asia( Reference Alizadeh, Didarloo and Esmaillzadeh 29 – Reference Weng, Hao and Qian 36 ), Europe( Reference Del Mar Bibiloni, Maffeis and Llompart 37 – Reference Przysławski, Stelmach and Grygiel-Górniak 39 ) and Africa( Reference Aounallah-Skhiri, Traissac and El Ati 40 ). Most were cross-sectional studies, and only two were cohort studies. For diet assessment, eleven studies used a FFQ method (number of items ranged from thirty-eight to 168), and a dietetic pattern was obtained in fourteen studies by using factorial analysis. The characteristics of the retrieved studies and the food content of healthy and unhealthy dietary patterns are described in Tables 2 and 3. In addition, twelve studies were classified as low risk of bias (Table 4).
Table 2 Cross-sectional and cohort studies of dietary patterns and cardiometabolic risk markers among adolescents (Mean values and standard deviations of BMI, waist circumference (WC) and blood pressure (BP))

SBP, systolic blood pressure; DBP, diastolic blood pressure; RTI, Research Triangle Institute; Q, quartiles; T, tertiles; DR, dietary record.
Table 3 Cross-sectional studies of dietary patterns and cardiometabolic risk markers among adolescents (Mean values and standard deviations of glucose, TAG, LDL and HDL)
RTI, Research Triangle Institute; T, tertiles; Q, quartiles; DR, dietary record.
Table 4 Research Triangle Institute (RTI) quality assessment of observational studies
Dietary patterns and lipid profile
The association between dietary pattern and serum lipids (total cholesterol, LDL-cholesterol, HDL-cholesterol and TAG) was identified in five studies. In an Australian study, Ambrosini et al.( Reference Ambrosini, Huang and Mori 22 ) evaluated the association between dietary patterns and the metabolic syndrome in 14-year-old adolescents. They found that higher ‘Western’ pattern scores obtained by factorial analysis were associated with an increasing trend in total cholesterol (P for trend Z 0·03) among girls and that boys showed greater mean HDL-cholesterol concentrations associated with higher ‘Healthy’ pattern scores (P for trend Z 0·02). Ochoa-Avilés et al.( Reference Ochoa-Avilés, Verstraeten and Lachat 24 ) identified that ‘wheat-dense animal-fat pattern’ mainly based on refined wheat products, red meat, animal fat, dairy products and plantain intake with low maize and whole-grain consumption was associated with increased total cholesterol (P=0·02) and LDL-cholesterol (P=0·04) among rural adolescents in Mexico.
In contrast to the positive association of ‘Western’ dietary pattern with metabolic risk factors, Joung et al.( Reference Joung, Hong and Song 32 ) observed in their data on 3168 Korean adolescents aged 13–18 years old that the ‘Rice & kimchi’ pattern, which is similar to a traditional Korean dietary pattern featuring high consumption of white rice, kimchi, beans, vegetables and fish, was related to increased risk of elevated serum TAG (OR 0·45; 95 % CI 0·267, 0·781) and reduced HDL-cholesterol levels (OR 0·684; 95 % CI 0·511, 0·916) compared with a modified traditional pattern and a westernised dietary pattern, respectively. In contrast, another Korean study of children and adolescents conducted by Lee et al.( Reference Lee, Hwang and Cho 33 ) identified that LDL-cholesterol levels were significantly lower in those with a ‘Traditional diet’ pattern than in those with a ‘Mixed diet’ pattern (P<0·05), but this significant difference disappeared after adjusting for age and sex. No differences in other blood lipid profiles or the atherogenic index among the groups were observed.
In a large-sample cross-sectional study with 5267 Chinese children and adolescents, Shang et al.( Reference Shang, Li and Liu 34 ) observed that total cholesterol was significantly higher in those with a ‘Healthy’ dietary pattern than in those with a ‘Western’ dietary pattern (4·13 (sd 0·76) v. 4·00 (sd 0·70) mmol/l, P=0·0065). However, participants with a ‘Western’ dietary pattern had significantly higher LDL-cholesterol levels (2·15 (sd 0·57) v. 2·07 (sd 0·64) mmol/l, P=0·0023) and lower HDL-cholesterol levels (1·43 (sd 0·28) v. 1·49 (sd 0·30) mmol/l, P<0·001) compared with those with a ‘Healthy’ dietary pattern. Participants with a ‘Western’ dietary pattern also showed significantly higher TAG levels than their counterparts with a ‘Healthy’ dietary pattern (0·93 (sd 0·45) v. 0·91 (sd 0·48) mmol/l, P<0·001).
Dietary patterns and serum glucose
Four cross-sectional studies included in this systematic review tested the influence of dietary patterns on blood glucose level. Shang et al.( Reference Shang, Li and Liu 34 ) observed a higher level of fasting glucose among participants with a ‘Western’ dietary pattern compared with those with a ‘Healthy’ dietary pattern (4·536 (sd 0·55) v. 4·466 (sd 0·49) mmol/l, P=0·0082). Similarly, Ambrosini et al.( Reference Ambrosini, Huang and Mori 22 ) found that with increasing ‘Healthy’ dietary pattern scores, mean serum glucose decreased among boys (P for trend Z 0·01) and girls (P for trend Z 0·04). In a study by Ochoa-Avilés et al.( Reference Ochoa-Avilés, Verstraeten and Lachat 24 ), the ‘Rice-rich non-animal fat pattern’, which reflects a high intake of white rice, vegetable oil and tubers, together with a lower contributions of animal fat, dairy products, pre-packaged food and other cereals in the diet, was correlated with a moderate increase in glucose blood levels among urban Ecuadorian adolescents (P<0·01). However, Romero-Polvo et al.( Reference Romero-Polvo, Denova-Gutierrez and Rivera-Paredez 25 ) found no relationship between mean glucose and highest and low quintiles of dietary patterns in Mexican adolescents aged 10–16 years old.
Dietary patterns and blood pressure
Measures of BP and its association with dietary patterns were tested by six cross-sectional studies. Hojhabrimanesh et al.( Reference Hojhabrimanesh, Akhlaghi and Rahmani 31 ), in an analysis of a sample of 557 Iranian adolescents, found that the multivariable adjusted means of the systolic BP (SBP) and mean arterial pressure of subjects in the highest tertile of the ‘Western’ pattern score were significantly higher than those in the lowest tertile (for SBP: mean difference 6·9 mmHg, P=0·001; and for mean BP: mean difference 4·2 mmHg, P=0·003). After stratification for sex and age, the mean values of SBP, diastolic BP (DBP) and mean BP of 12–15-year-old male subjects in the highest tertile of the ‘Western’ pattern score were significantly higher than those in the lowest tertile (SBP: mean difference 14·5 mmHg, P=0·001; for DBP: mean difference 6·5 mmHg, P=0·015; and for mean BP: mean difference 9·2 mmHg, P<0·001). A statistically insignificant difference was observed in terms of the multivariable adjusted means of the mean BP of 12–15-year-old girls (mean difference 4·7 mmHg, P=0·064).
In the study by McNaughton et al.( Reference McNaughton, Ball and Mishra 23 ) of adolescents aged more than 16 years, the ‘Fruit, salad, cereals and fish’ pattern was significantly associated with DBP (P=0·025), with participants with higher scores having lower BP (adjusted for age, sex and physical activity). There were no significant associations between any of the dietary patterns and SBP after adjustment for confounders. Significantly higher SBP and DBP were observed by Shang et al.( Reference Shang, Li and Liu 34 ) in Chinese children and adolescents with a ‘Western’ dietary pattern than among children with a ‘Healthy’ dietary pattern (SBP: 111·76 (sd 11·8) v. 105·561 (sd 0·5) mmHg, P=0·04 and DBP: 74·46 (sd 7·0) v. 69·46 (sd 7·2) mmHg, P=0·0435). Opposite results were observed by Aounallah-Skhiri et al.( Reference Aounallah-Skhiri, Traissac and El Ati 40 ) In their Tunisian study, girls exhibited decreased SBP with increasing tertiles of the ‘Modern’ dietary pattern score. In this same group, there was a decrease in the prevalence of high BP with modernisation of the diet (2nd v. 1st tertile adjusted prevalence OR (POR) 0·6; 95 % CI 0·3, 1·0, 3rd v. 1st tertile POR 0·4; 95 % CI 0·2, 0·8); this association remained significant but was reduced when adjusted for age, total energy intake or physical activity measures. Among boys, no straightforward associations were observed between BP and the modern diet score or for the ‘Meat–fish’ diet score after adjusting for energy intake, BMI and waist circumference (WC), and the difference between tertiles on DBP disappeared. A lower prevalence of hypertension in the highest tertile of the ‘Modern’ dietary pattern was also observed for both genders. In the studies of Lee et al.( Reference Lee, Hwang and Cho 33 ) and Ambrosini et al.( Reference Ambrosini, Huang and Mori 22 ), BP measures did not show significant differences among the clusters or dietary patterns.
Dietary pattern and BMI and waist circumference
In all, sixteen studies retained in this systematic review evaluated the effect of dietary pattern on anthropometric measures such as BMI and WC. Among the total studies, four studies observed no significant differences in BMI, WC and overweight prevalence and obesity prevalence among tertiles of those with a westernised dietary pattern compared with healthier dietary patterns and clusters( Reference McNaughton, Ball and Mishra 23 , Reference Song, Joung and Engelhardt 35 , Reference Del Mar Bibiloni, Maffeis and Llompart 37 , Reference Przysławski, Stelmach and Grygiel-Górniak 39 ).
Evidence of the relation between diet and anthropometric measures was observed in a study conducted in Iran by Alizadeh et al.( Reference Alizadeh, Didarloo and Esmaillzadeh 29 ). Subjects of the top tertile of the ‘Iranian Central Obesity Making Dietary Pattern’ (composed by cruciferous vegetables, green leafy vegetables, soft drinks, tomatoes, other vegetables and vegetable oils) group had higher WC than subjects in the lowest tertile (P=0·03). Adjusting for age increased the positive associations of this dietary pattern with WC (P=0·009) and weight (P=0·04). Compared with subjects of the lowest tertile, those in the upper tertile of the ‘Lacto Vegetarian Dietary Pattern’ (characterised by legumes, potato, other vegetables, dough, high-fat dairy products and margarine) group had significantly lower weight, WC and BMI either before or after controlling for age (P<0·01). In an Australian study( Reference Ambrosini, Huang and Mori 22 ), girls in the higher quartiles of the ‘Western’ dietary pattern showed increases in mean WC (P for trend Z 0·03) and BMI (P for trend Z 0·02). For boys, no relationships were found in mean WC and BMI with dietary pattern. Aounallah-Skhiri et al.( Reference Aounallah-Skhiri, Traissac and El Ati 40 ) observed associations between increased ‘Modern’ dietary pattern scores and higher means of BMI and WC in males. These associations were minimally confounded by age, total energy intake or physical activity measures. However, males in the 3rd tertile of healthier ‘Meat–fish’ dietary pattern scores also presented higher mean BMI and WC, either adjusted for confounders. No obvious relationship was observed for this pattern in females. In females, the only association observed with anthropometry was with abdominal fat accumulation, with those in the 3rd v. 1st tertile of the ‘Modern’ score featuring a slightly higher mean WC in the unadjusted analysis, but the strength of the association was further reduced in adjusted analysis.
Similar results were evidenced by Gutiérrez-Pliego et al.( Reference Gutiérrez-Pliego, Del Socorro Camarillo-Romero and Montenegro-Morales 27 ). Participants in the highest tertiles of the ‘Westernised’ pattern and the ‘High in protein/fat’ pattern showed higher BMI compared with those in the highest tertile of the ‘Prudent’ pattern. Pearson’s correlation analysis between BMI and the different dietary pattern scores showed a positive correlation with the ‘Westernised’ pattern (r 0·316; P<0·01) and the ‘High in protein/fat’ pattern (r 307 P<0·01). In contrast, a negative correlation was found for the prudent dietary pattern (r −576 P<0·01). Hojhabrimanesh et al.( Reference Hojhabrimanesh, Akhlaghi and Rahmani 31 ) also observed a significantly higher mean WC among individuals in the highest tertile of the Western pattern.
In evaluating the association of obesity and dietary patterns, Shang et al.( Reference Shang, Li and Liu 34 ) found that children and adolescents with the ‘Western’ dietary pattern (high positive loadings on beef/lamb/other red meat, wheat, starch tubers and light-coloured vegetables) had a significantly higher odds of obesity (OR 2·04; 95 % CI 1·38, 3·02) compared with those who followed the ‘Healthy’ dietary pattern (high positive loadings on milk and yogurt, eggs, fruit and vegetables, and high negative loadings on sugar and beef, lamb and other red meat). After adjustment, the association between the ‘Western’ dietary pattern and obesity was attenuated but still significant (OR 1·79; 95 % CI 1·20, 2·67). Compared with children who followed the ‘Healthy’ dietary pattern, the fully adjusted OR was 1·80 (95 % CI 1·15, 2·81) for children with the Western dietary pattern after adjusting for confounding factors. Significantly higher odds of abdominal obesity were observed among children and adolescents with the ‘Transitive’ dietary pattern (high positive loadings on organ meat, pork, seafood, processed meat, edible fungi and algae and light vegetables) and with the ‘Western’ dietary pattern compared with the ‘Healthy’ dietary pattern after adjustment (OR 1·35; 95 % CI 1·14, 1·60 for the ‘Transitive’ dietary pattern and 1·64; 95 % CI 1·14, 2·35 for the ‘Western’ dietary pattern).
Weng et al.( Reference Weng, Hao and Qian 36 ) observed that a higher consumption of the ‘Snack’ dietary pattern (composed mainly of preserved fruit, a sweet course, frozen confection, yogurt, chocolate, candy and carbonated drinks) was associated with age- and sex-adjusted lower BMI and waist:height ratio (WHtR). An increased frequency of consuming the ‘Animal’ dietary pattern (red meat, organ meat, processed meat, fried meat and other Chinese meat dishes) was generally associated with age- and sex-adjusted lower BMI and WHtR.
A cohort of American girls( Reference Ritchie, Spector and Stevens 26 ) stratified by race reported at the end of the study that black girls following the ‘Sweets and cheese’ pattern tended to have the largest values of adiposity measures (P=0·095 for percent body fat for the ‘Sweets and cheese’ v. ‘Snack-type foods’ patterns) and that black girls following the ‘Meal-type’ pattern tended to have the lowest values (P=0·074 for WC for the ‘Meal-type’ v. the ‘Customary’ pattern) after adjusting for potential confounders. Among white girls, those following the ‘Healthy’ pattern exhibited significantly smaller mean values for WC at the final follow-up and smaller changes in WC (study year 10 to year 1) compared with the ‘Sweets and snack-type foods’ pattern (P=0·037). Girls following the ‘Healthy’ pattern also tended to have lower body fat (P=0·063 for percent body fat for the ‘Healthy’ v. ‘Fast food’ patterns) after adjusting for potential confounders.
In a study by Zamora-Gasga et al.( Reference Zamora-Gasga, Montalvo-González and Loarca-Piña 28 ), principal component (PC) scores were used in multiple regression and cluster analysis. The PC corresponding to vegetables, fish and seafood consumption was positively associated with weight (standardised β-coefficient=0·124, P<0·01) and BMI (standardised β-coefficient=0·117, P<0·01). The PC characterised by high consumption of legumes and snacks and low intake of beverages was negatively associated with weight (standardised β-coefficient=−0·077, P=0·04) and with BMI (standardised β-coefficient=−0·073, P=0·04). PC corresponding to high consumption of beverages and snacks and low intake of egg was negatively associated with BMI (standardised β-coefficient=−0·064 P=0·01).
Different results were evidenced by Bahreynian et al.( Reference Bahreynian, Paknahad and Maracy 30 ) in which girls in the highest quartile and the second quartile of the ‘Healthy’ pattern were more likely to have higher BMI (OR 2·23; 95 % CI 1·003, 4·96). Girls in the second quartile of the ‘Western’ dietary pattern had significantly lower BMI than those in the fourth quartile (OR=0·46; 95 % CI 0·21, 1·01). There was no significant relationship between the ‘Western’ pattern with BMI among boys; however, a significant association was observed between the first and fourth quartiles of the ‘Healthy’ pattern (OR=0·36; 95 % CI 0·15, 0·84), but the trend was not statistically significant (P for trend=0·561). Lee et al.( Reference Lee, Hwang and Cho 33 ) also identified contradictory results: in their study, the ‘Traditional diet’ group had the highest obesity rate of 16·4 %. However, when the association was analysed within each age group, significant differences had not appeared, but the ‘Traditional diet’ tended to have higher obesity rates than the other two patterns. Romero-Polvo et al.( Reference Romero-Polvo, Denova-Gutierrez and Rivera-Paredez 25 ) found that participants presented statistically significant reduced means in BMI, body fat proportion and WC in the highest quintile of the ‘Western’ pattern and the ‘Prudent’ pattern.
From the nineteen studies retrieved in the systematic review that considered unhealthy food patterns and CMR factors among adolescents, only seven studies( Reference Ambrosini, Huang and Mori 22 , Reference Romero-Polvo, Denova-Gutierrez and Rivera-Paredez 25 , Reference Gutiérrez-Pliego, Del Socorro Camarillo-Romero and Montenegro-Morales 27 , Reference Alizadeh, Didarloo and Esmaillzadeh 29 , Reference Hojhabrimanesh, Akhlaghi and Rahmani 31 , Reference Del Mar Bibiloni, Maffeis and Llompart 37 , Reference Aounallah-Skhiri, Traissac and El Ati 40 ) presented outcome information stratified by quintiles/quartiles/terciles. Among these, only anthropometric measures of BMI and WC were included in a sufficient number of studies for the meta-analysis. The meta-analysis could not be performed for the other CMR factors, considering the lack of information in reported means or the very few number of studies.
A meta-analysis of unhealthy dietary patterns and cardiometabolic risk factors
Associations of eating high amounts of unhealthy foods with BMI and WC are shown in Fig. 2. The mean BMI was 0·57 kg/m2 higher (95 % CI 0·51, 0·63; P heterogeneity<0·001; I 2=96·5 %) among those who had a greater intake of unhealthy foods. The association of unhealthy food patterns and WC was higher for the subgroup analysis when only studies that exclusively included adolescents aged 14 years or older (SMD:1·13; 95 % CI 0·98, 1·28; P heterogeneity<0·001; I 2=99·5 %) were analysed and compared with samples containing children and adolescents together (SMD: 0·12; 95 % CI −0·01, 0·25; P heterogeneity<0·001; I 2=89·7 %). A small increase in mean BMI was observed in the subgroup analysis of studies including only adolescents aged 14 years or older (WMD: 0·58; 95 % CI 0·52, 0·64; P heterogeneity<0·001; I 2=98·1 %).
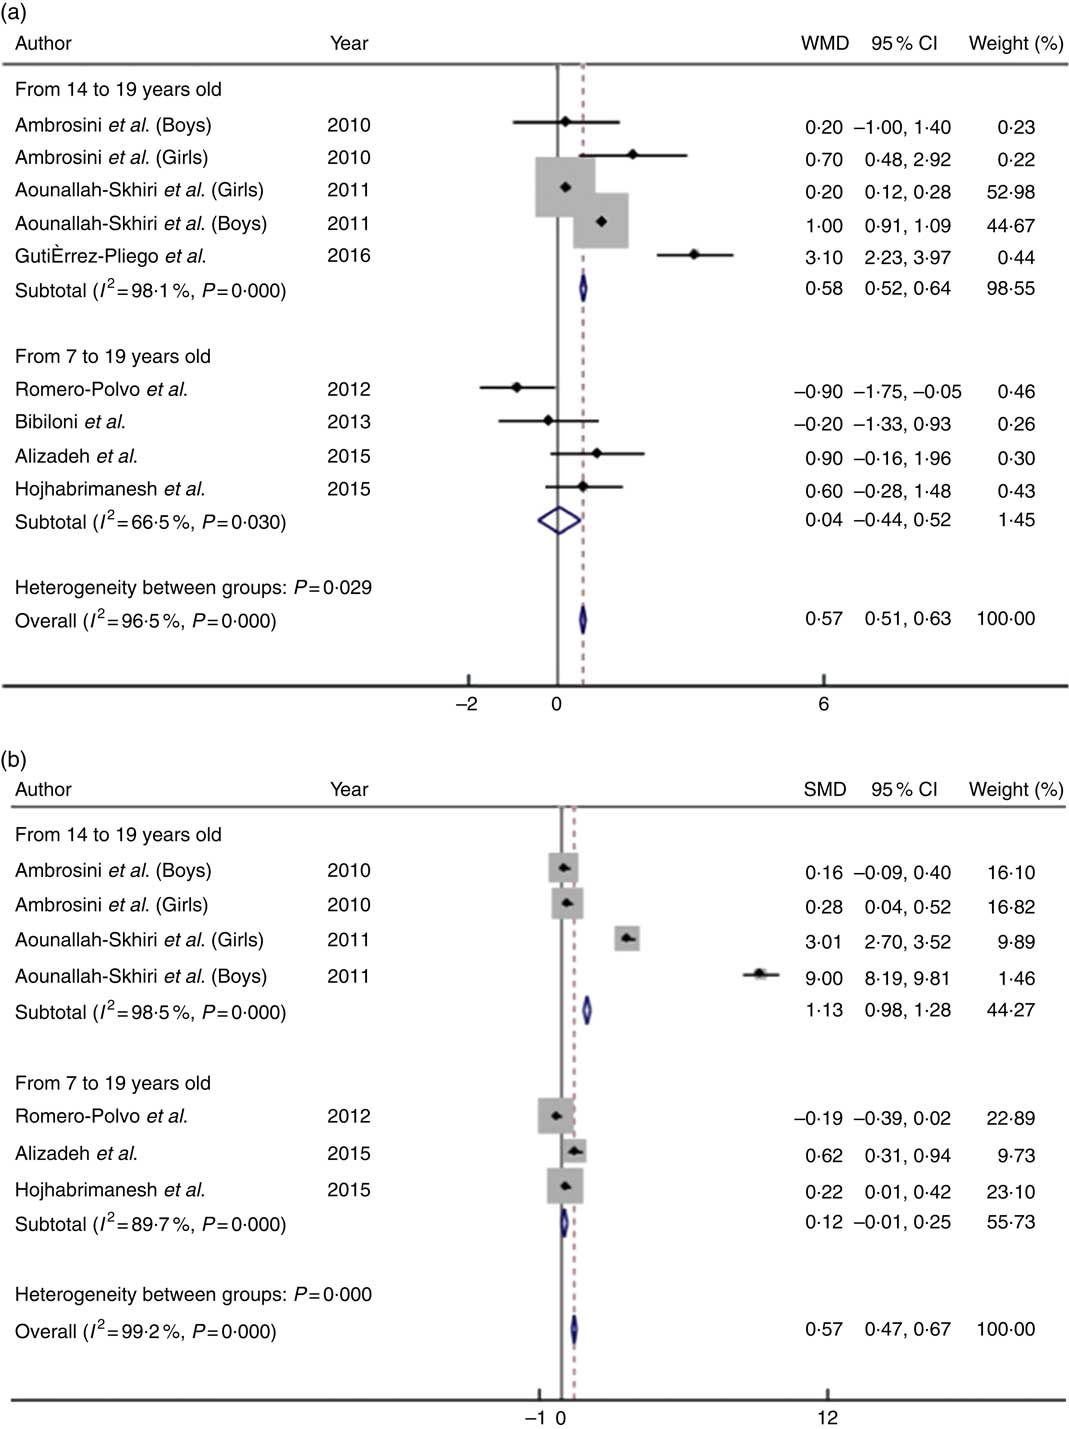
Fig. 2 Mean difference in BMI (a) and waist circumference (b) of high intake v. low intake of unhealthy food patterns among adolescents. WMD, weighted mean difference; SMD, standardised mean difference.
A meta-analysis of healthy dietary patterns and cardiometabolic risk factors
The consumption of large quantities of healthy foods was inversely associated with BMI and WC (Fig. 3). Compared with adolescents who consumed higher quantities of healthy foods, adolescents who had a low intake of these foods had a 0·41 kg/m2 lower mean BMI (95 % CI −0·46, −0·36; P heterogeneity<0·001; I 2=99·2 %) and a 0·43-cm lower mean WC (95 % CI −0·52, −0·33; P heterogeneity<0·001; I 2=99·3 %). Similar to the results observed for unhealthy food patterns, the subgroup analysis of samples composed only of teenagers aged 14 years or older favoured an increase in mean WC (WMD:−0·87; 95 % CI −1·01, −0·73; P heterogeneity<0·001; I 2=99·5 %) and maintenance of the mean BMI (SMD:−0·41; 95 % CI −0·46, −0·36; P heterogeneity<0·001; I 2=99·2 %) compared with studies including both children and adolescents.
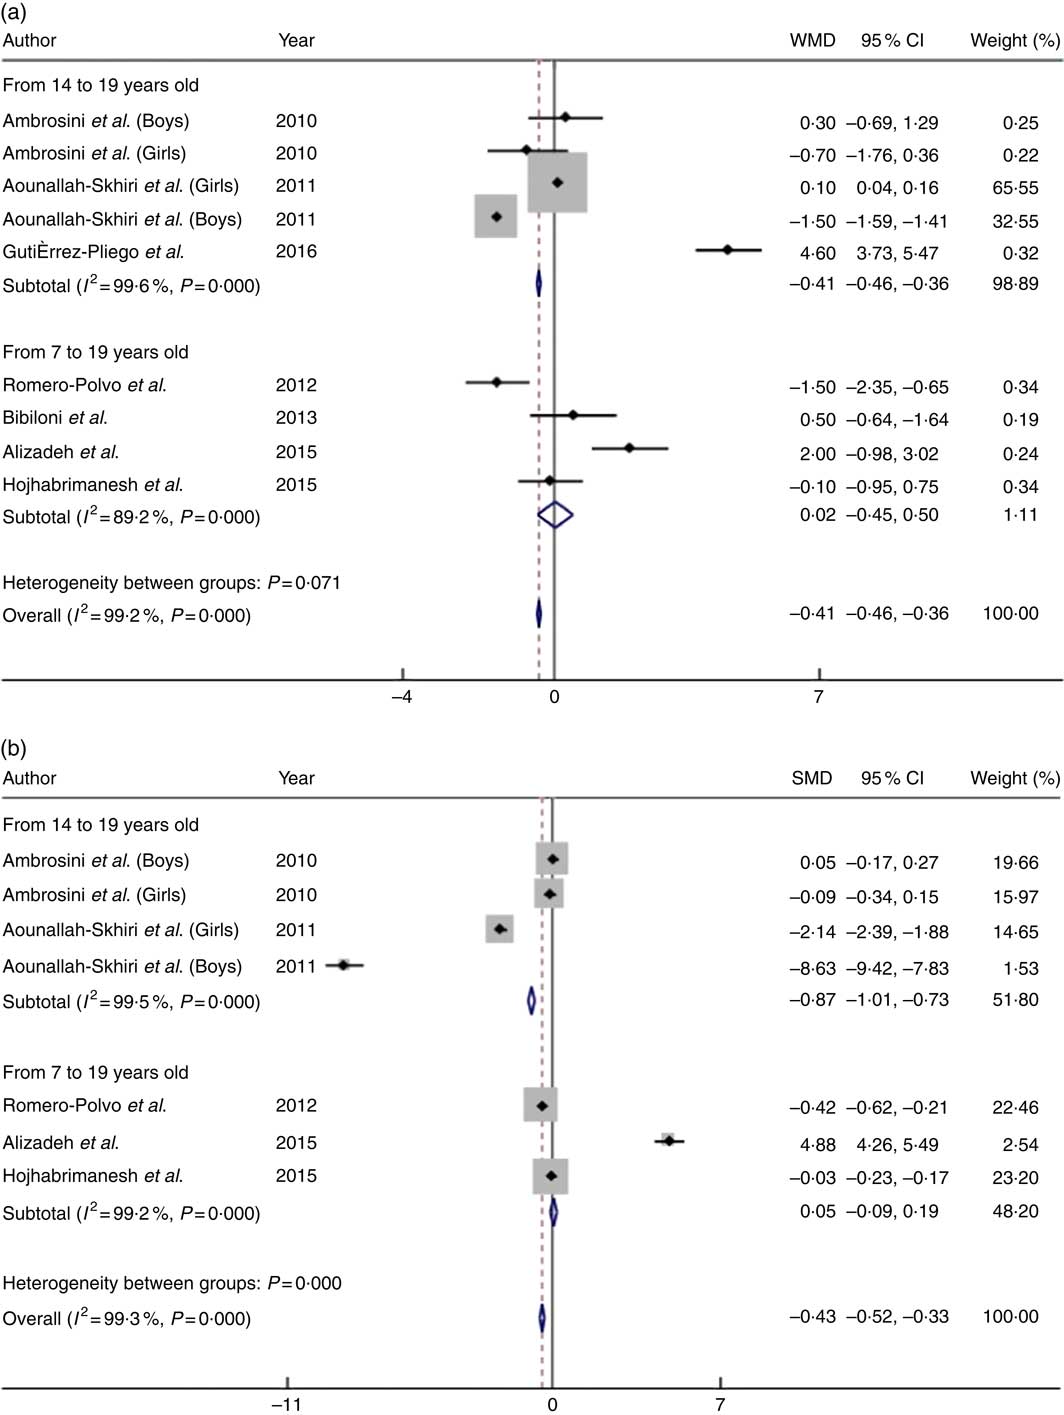
Fig. 3 Mean difference in BMI (a) and waist circumference (b) of low intake v. high intake of healthy food patterns among adolescents. WMD, weighted mean difference; SMD, standardised mean difference.
Considering the reduced number of observations for each anthropometric measure, individual meta-regression models were constructed. Each model analysed the influence of the BMI (only for WC), the mean age and the sample size of the studies on the heterogeneity identified in the meta-analyses undertaken in this study. However, none of these variables explained the heterogeneity (results not shown). In addition, we undertook the sensibility analysis, excluding the studies with discrepant results, but the I 2 statistic was kept higher than 90 % and the P value was yet significant (P<0001), indicating that the high heterogeneity identified in this meta-analysis is probably an intrinsic characteristic of the studies evaluating food pattern. Because only seven studies were included in this meta-analysis, Egger’s test for publication bias could not be performed.
Discussion
Studies evaluating the association between dietary patterns and CMR factors were included in this systematic review and meta-analysis. The results revealed some evidence that unhealthy dietary patterns, assessed as higher quintiles/quartiles/tertiles or higher scores of factorial/cluster/PC analyses, were associated with higher mean values of WC, BMI, BP, lipid profile and blood glucose. The results of the association between healthy dietary patterns and the same risk factors were not statistically significant, as identified for unhealthy dietary patterns, and some healthy dietary patterns even showed the same associations with CMR factors as unhealthy dietary patterns. For example, the results of the meta-analysis suggested an association between consuming large amounts of unhealthy diets and higher mean values of WC and BMI; this association increased in the subgroup analyses that included only adolescents. Elevated intake of healthier foods was associated with the highest mean WC and mean BMI, which conflicts with the protective effect that healthy dietary patterns are expected to have against CMR factors.
The studies included in this systematic review were mostly cross-sectional, applying a variety of different methodologies, dietary assessment methods (FFQ or 24-h dietary recall), statistical analyses to obtain dietary patterns and techniques or methods to measure outcomes and characterised by a range of limitations owing to adjusting for confounding variables. These characteristics emphasise the importance of cautiously interpreting the results of this study and reinforce the need to improve the quality of observational studies that involve the evaluation of food patterns in adolescents. In addition, the elevated heterogeneity observed in the results of the meta-analysis was considerable owing to the reduced number of studies presenting data for quintiles/quartiles/terciles. In addition, the methodological and analytical variation inherent to the food pattern complex variable can also contribute to the high heterogeneity. Then, considering that the exploration of heterogeneity using meta-regression, subgroup and sensitivity analysis was unlikely to explain the variation between the studies, caution should be applied when interpreting the summary effect measure calculated for this study.
Taking into consideration the study population, it is important to highlight that cardiometabolic markers are influenced by adolescence characteristics, such as hormonal changes during puberty and sexual maturation status, which may influence the association between diet and CMR factors( Reference Eissa, Mihalopoulos and Holubkov 41 , Reference Reinehr 42 ). Pubertal status promotes the occurrence of insulin resistance and influences lipid levels, body fat and lean mass distributions, which raise questions about using definitions for the metabolic syndrome and standardised cut-off points for health risk factors in children and adolescents that do not consider pubertal status( Reference Reinehr 42 , Reference Moon, Park and Ahn 43 ). The lack of a consensus for cut-off points to diagnose dyslipidaemia, hypertension, hyperglycaemia and overweight status results in the adoption of country-specific references for clinical studies. Therefore, the results of studies performed in different continents or countries may not be valid for comparison.
Interpretations and comparability of dietary patterns are challenging considering that adherence to a pattern can be influenced by a complex set of factors that include the socio-economic status, family characteristics, environment, seasonality, culture and religious and traditional customs( Reference Pollard, Landrigan and Ellies 44 – Reference Fernández-Alvira, Börnhorst and Bammann 48 ). These characteristics are likely to produce different results, with patterns with diverse food content, making comparisons and interpretation of data across studies difficult. The evaluation and label assigned to each dietary pattern is defined by authors, considering their knowledge and expertise, which also may limit the comparability of studies.
Obtaining food consumption data also presents several forms of bias depending on the method that is used. Traditionally, information on food intake is obtained through 24-h recall or FFQ written. Such methods require extensive interview time, the information is influenced by interviewee’s memory and cognition and the process may generate disinterest among participants, which is particularly critical for studies aimed at investigating the food consumption of children and adolescents( Reference Six, Schap and Zhu 49 , Reference Probst, Nguyen and Tran 50 ). Therefore, dietetic risk analyses should be carefully planned by expert researchers and consider controlling for many variables to reduce confounding influence. In addition, estimating the relation between diet and disease can be enlarged when considering the food content and complex interactions among diet components; the intake of single nutrients never occurs in isolation, although the effects of nutrients are generally measured experimentally and not always confirmed in a human population( Reference Stradling, Hamid and Taheri 51 , Reference Bakolis, Burney and Hooper 52 ). Dietary pattern analyses provide diet information considering the entire scope of food content, diet composition and complex nutrient interactions and may explain the food–disease relationship better than investigating single nutrients or isolated foods( Reference Castro, Baltar and Selem 53 , Reference Cunha, Almeida and Pereira 54 ).
The healthier food patterns observed in this study were mostly composed of legumes, vegetables, fruit, fish, low-fat dairy products, nuts, olive oil and others (Tables 2 and 3). These foods are frequently observed to be part of the Mediterranean diet, which has been shown to improve health and prevent health problems by its nutritional components of antioxidants, micronutrients, fibre, whole grains and monounsaturated and essential fatty acids( Reference Badimon, Chagas and Chiva-Blanch 55 , Reference Shen, Wilmot and Ghasemzadeh 56 ). The Mediterranean diet has also been successfully used as a non-medical treatment for obesity and other comorbidities and has had positive effects among intervention trials. Consequently, health societies widely recommend the Mediterranean diet to achieve healthier clinical parameters in the population( Reference Sacks, Lichtenstein and Wu 57 – Reference Piepoli, Hoes and Agewall 60 ). This treatment, which is characteristic of healthy diets, may explain our findings in adolescents who had a higher intake of healthy foods and presented with higher mean BMI and WC, considering that some of them may be following dietetic recommendations directed by professionals to improve their health status. This is an important source of bias that has been observed in cross-sectional studies (survival bias)( Reference Rothman, Greenland and Lash 61 ).
However, even given the territorial and cultural diversity of the included studies, we observed a similarity in food content in adolescents’ unhealthy dietary patterns, including that the foods chosen by adolescents may be influenced by a globalised pattern, which may expose them to common dietetic risk factors and favours association among unhealthy diets and CMR factors( Reference Lobstein, Jackson-Leach and Moodie 9 , Reference Funtikova, Navarro and Bawaked 14 , Reference Oberlander, Disdier and Etilé 62 ). Foods that comprised unhealthy food patterns that were present in the selected studies were mainly represented by red and processed meat, confectionery and bakery items, full-fat dairy products, refined grains, desserts and candies. Unhealthy food patterns also included a reduced intake of vegetables and fruits (Tables 2 and 3). The combination of foods that have a high energetic density and a low nutritional quality is commonly observed in Western food habits and influences the label of some food patterns that describe a high CMR( Reference Anand, Hawkes and de Souza 63 , Reference Sherzai, Heim and Boothby 64 ). These food characteristics are frequently associated with undesirable health outcomes because of their elevated content of saturated and trans fatty acids, salt, high glycaemic index and low content of fibre and micronutrients( Reference Angelieri, Barros and Siqueira-Catania 65 , Reference Li, Hruby and Bernstein 66 ).
In addition, the high energetic content observed in Western foods contributes to weight gain and central obesity, with strong evidence in adults and moderate evidence in children and adolescents( Reference Nagao, Asai and Sugihara 67 – Reference Howe, Black and Wong 71 ).
BMI and WC present a clear relationship with other CMR factors( Reference Ma, Wang and Liu 72 – Reference Dong, Wang and Arnold 75 ), revealing that unhealthy eating habits may directly influence BP, insulin resistance and atherogenic lipid profile via nutrient metabolic repercussions and, secondarily, by contributing to an increase in weight and body circumference, which was observed in this study.
Nonetheless, this review is characterised by various limitations. Publication bias may be present, considering that unexpected or implausible associations between diet and CMR factors may not be published. Considering food intake analysis, random error is common and is attributed to the nature of the information obtained to test associations or to obtain dietary patterns. The methodologically distinct strategies and the cross-sectional characteristics of many studies make it impossible to determine the causality of relationships of interest and, therefore, may affect the interpretation of the results.
In the review process, all methodology steps were taken into account to prevent biases. The research, data extraction and evaluation of bias were performed independently by the researchers. To obtain the maximum number of published papers in the field, six important data sources were used to search for relevant articles using MeSh terms exploding all trees. The reference lists of the retained articles and reviews were also evaluated to include additional studies.
This study found that adhering to an unhealthy dietary pattern appears to be associated with the worst values of CMR factors among adolescents. However, evidence of a protective effect of healthier dietary patterns in this group remains unclear. The meta-analysis results need to be cautiously interpreted considering the elevated heterogeneity; however, the high methodological quality applied in this study reinforces the validity of results. Considering the physiological changes associated with this phase of life, the lack of consensus among cut-off points for clinical parameters and the impact of food habits on health outcomes during early and adult life, further high-quality methodological research is warranted to estimate the potential impact of diet on CMR factors in adolescents. The publication of high-quality evidence in this field can strengthen clinical strategies to improve the health status of younger generations and to prevent undesirable outcomes during adulthood.
Acknowledgements
The authors thank the editor and anonymous reviewers for their constructive and valuable comments, which helped the authors improve the manuscript. We also thank the Fundação Oswaldo Cruz (Fiocruz) for providing EMBASE access.
This research received no specific grant from any funding agency, commercial or not-for-profit sectors.
C. d. M. C. and P. R. F. C. formulated the research question. J. C. D. P., P. R. F. C. and C. d. M. C. designed the study, conducted the study and analysed the data. V. A. d. O. Q. and L. P. M. d. O. evaluated the risk of bias. C. d. M. C. and A. M. O. A. discussed the results and wrote the paper. All of the authors contributed to the revision of the manuscript and read and approved the final version.
None of the authors has any conflicts of interest to declare.


