


The thymus is a primary lymphoid organ in which the differentiation of T lymphocytes occurs(Reference Nagib, Gameiro and Stivanin-Silva1). It may also be considered as an organ of the endocrine system and, therefore, an endocrine gland that secretes hormones and other soluble factors controlling the production and maturation of T lymphocytes(Reference Savino2), and regulating the activity and interactions of T cells in peripheral tissues(Reference Roux, Dumont-Girard and Starobinski3). It exerts a clear influence on the development and maturation of the lymphatic system and in the mucosal and systemic immune response(Reference Lynch, Goldberg and Chidgey4).
It is known that malnutrition causes a significant impairment of the immune system. The severity of the malnutrition depends on the degree of nutrient imbalance and the interaction between nutrients and the age of the host(Reference Donath and Shoelson5). Protein–energy malnutrition (PEM) causes atrophy of lymphoid tissues, the thymus being one of the most affected organs.
Probiotics are defined as live micro-organisms which, when administered in adequate amounts, confer a health benefit to the host(6).
The beneficial effect of a probiotic fermented milk (PFM) using a non-severe PEM mouse model was previously reported(Reference Maldona do Galdeano, Novotny Nunez and de Moreno de LeBlanc7). The administration of the PFM during the re-nutrition period recovered the intestinal barrier, histological alterations and mucosal and systemic immune functions in the mice. It also demonstrated the beneficial effect of the PFM in the protection against Salmonella enterica serovar Typhimurium infection in this same non-severe malnutrition model(Reference Maldona do Galdeano, Novotny Nunez and de Moreno de LeBlanc7).
The aim of the present study was to evaluate the influence of a PFM, as a complement of a re-nutrition diet in a non-severe PEM model, on the recovery of the thymus, analysing the histological and functional alterations caused by malnutrition, as a way to determine if the improvement of the immune system observed previously was related to the thymus recovery(Reference Maldona do Galdeano, Novotny Nunez and de Moreno de LeBlanc7). The effect of the PFM was compared with whole milk or with the bacterial-free supernatant (BFS) obtained from the PFM. BFS was analysed to evaluate the possible effect of biologically active components released during milk fermentation, such as peptides and carbohydrates, or other soluble components present in the fermented milk.
Experimental methods
Malnutrition of animals by food restriction and re-nutrition protocols
Specific pathogen-free BALB/c mice (for bacteria such as cilia-associated respiratory bacillus Citrobacter rodentium, Salmonella spp., Clostridium piliforme and protozoa such as Giardia muris) were obtained from the closed, random-bred colony maintained at Centro de Referencia para Lactobacilos (San Miguel de Tucumán, Argentina).
After weaning (21 d), thirty-five mice (males and females) weighing 10 (sd 2) g, were randomly divided into two control groups (ten mice per group, five males and five females) and three test groups (five mice per group, three males and two females). Well-nourished control (WC) animals received (3–5 g/animal per d) conventional balanced diet (23 % proteins, 6 % raw fibre, 10 % total minerals, 1·3 % Ca, 0·8 % P, 12 % moisture and vitamins). Malnourished control (MC) mice were fed during the 5 d with a conventional diet, without restriction. After that, the malnourishment period started and the animals received restricted food (25 % less than WC). According to the protocol described by Gauffin Cano et al. (Reference Gauffin Cano, Van Nieuwenhove and Chaila8), these animals were not renourished and continued with restrained ingestion during the entire experiment. Mice of these two control groups received water ad libitum.
The mice of the three test groups received the restricted diet similar to the MC group, and when the animals lost 25 % of body weight compared with the WC, the restrained ingestion was continued, but was supplemented with three different dietary supplements: milk, where the MC mice were renourished with whole milk (rehydrated at 10 % (w/v)); PFM, where the animals were renourished with a commercial fermented milk containing yoghurt starter cultures (Lactobacilllus delbrueckii subsp. bulgaricus 108 colony- forming units (CFU)/ml and Streptococcus thermophilus 108 CFU/ml) and the probiotic bacterium Lactobacillus casei DN-114-001 (108 CFU/ml); or BFS, where the mice received the diet supplemented with a BFS obtained by centrifugation of PFM at 10 000 g for 20 min. The supernatant obtained was plated on de Mann–Rogosa–Sharp agar for the bacterial count, which was found to be lower than 102 CFU/ml. This CFU number is cleaned by peristalsis. Mice of the three test groups received restricted food containing the specific dietary supplement during the 5 d and water was supplied ad libitum.
A total of five mice were housed in a cage in the control groups and three or two mice per cage in the test groups, maintaining females and males in separate cage. The metallic cages were kept in a climate-controlled room (20 ± 2°C of temperature and 40–70 % relative humidity), with a 12 h light–12 h dark cycle. The cages were cleaned every 2 d. A total of five mice from each control group were killed by cervical dislocation after food restriction (25 % less than WC, basal sample, day 30 of the experiment, 7 weeks of age) and five mice each of the control and the test groups were killed at 5 d post re-nutrition (day 35 of the experiment, 8 weeks of age). The immune system of the mice is mature at the time of the killing (7–8 weeks of age). The thymus was recovered for histological and immunological studies. Fig. 1 describes the experimental design.

Fig. 1 Design of the different experimental groups under study. Protocol for malnutrition and re-nutrition with the different dietary supplements. Mice were killed at day 30 (basal sample, 7 weeks of age) and at 5 d after re-nutrition (day 35, 8 weeks of age). Each square represents each day of the experiment (starting at weaning, 21 d of age). WC, well-nourished control; PFM, probiotic fermented milk; BFS, bacterial-free supernatant.
The animal protocol CRL-BIOT-LI-2009/1A was approved by the Institutional Committee of Laboratory Animals Care and Use of Centro de Referencia para Lactobacilos, and all experiments comply with the present laws of Argentina, according to Consejo Nacional de Investigaciones Científicas y Técnicas (CONICET) requirements (Resolution D, no. 1047/05) for laboratory animal research.
Histological samples
The thymus was removed, fixed with 10 % formaldehyde in PBS solution (pH 7). After fixation, the tissues were dehydrated and embedded in paraffin using the methods described by Sainte-Marie(Reference Sainte-Marie9). Serial paraffin sections (4 μm thick) were made and used for immunofluorescence and haematoxylin–eosin staining.
Apoptosis determination in thymus on histological cuts
Apoptosis was evaluated for the presence of DNA breaks using the Apoptosis Detection System kit (Promega). The fluorescein-12-dUTP-nick-end-labelled DNA was visualised using fluorescence microscopy. Cells were defined as apoptotic if the entire nuclear area of the cell was stained fluorescent. Apoptosis was expressed as the number of apoptotic cells in ten fields observed at 400 × magnification.
Determination of macrophage and dendritic cells in thymus tissues
Macrophages and dendritic cells (DC) were determined using indirect immunoflourescence in the thymus tissues, as was previously described(Reference de Moreno de LeBlanc, Dogi and Galdeano10). The BM8 monoclonal antibody (affinity purified anti-mouse F4/80 antigen – Pan Macrophage Marker, eBioscience) was used to identify mature macrophages and the 33D1 monoclonal antibody to identify DC that are able to present foreign antigens (affinity purified anti-mouse DC marker, e-Bioscience). The results were expressed as the number of positive fluorescent cells per ten fields of vision (1000 × ).
Immunohistochemical detection of cytokine-producing cells
Cytokine-producing cells were detected by indirect immunofluorescence assays following the technique previously described(Reference Perdigon, Maldonado Galdeano and Valdez11). Rabbit anti-mouse TNF-α, interferon (IFN)-γ, IL-10, IL-6, IL-2 or IL-4 (Peprotech, Inc.) polyclonal antibodies were used. A dilution of fluorescein isothiocyanate-labelled anti-rabbit IgG (Jackson Immuno Research Laboratories, Inc.) was used as secondary antibody. The results were expressed as the number of positive fluorescent cells per ten fields of vision (1000 × ).
Determination of CD4+ and CD8+ T lymphocytes by flow cytometry
The thymus was aseptically removed, washed with saline solution (0·15 m-NaCl) and placed into sterile tubes containing 5 ml of Hank's balanced saline solution. The samples were immediately homogenised under sterile conditions using a nylon mesh. The samples were centrifuged and resuspended in 2 ml of Hank's balanced saline solution. Cell concentration was adjusted to 3 × 10⁶ cells/ml using a Neubauer chamber. The cells were incubated with fluorescein isothiocyanate anti-CD8 and phycoerythrin anti-CD4 monoclonal antibodies (both from BD Bioscience Pharmingen) at 4°C for 30 min. The number of CD4+ and CD8+ cells was determined using a BD FACSCaliburTM Flow Cytometer equipped with 488 and 635 nm laser excitation sources.
Statistical analysis
Statistical analysis were performed using MINITAB 14 software (Minitab, Inc.) by general linear model ANOVA, followed by a Tukey's post hoc test, and P< 0·05 was considered significant. Unless otherwise indicated, all values (n 15) were the means of three independent trials (n 5 per trial, and non-significant differences were observed between individual replicates) with their standard deviations. For each immunohistochemical determination and for each mouse, the results were obtained from two individual blind counts (by two different investigators).
Results
Effect of milk, probiotic fermented milk or its bacterial-free supernatant on the histology of the thymus
The histology of the thymus was affected in the MC group in more than 75 % of the animals, where a loss of corticomedullary differentiation with lobule decreases were observed compared with the WC group (Fig. 2(A) and (B)). These changes were reversible after PFM administration during the re-nutrition period (Fig. 2(C)). Mice given milk or BFS also showed a similar effect, but the improvement was lower than in the animals that received PFM (Fig. 2(D) and (E)). No differences were found between male and female animals.

Fig. 2 Histological study comparing the different experimental groups. Histological slices from the thymus of mice were analysed after staining with haematoxylin–eosin. All the samples were obtained after 5 d of re-nutrition, with a magnification of 100 × . Each microphotograph corresponds to one mouse that represents the majority (more than 75 %) of the images obtained from the individual animals of each group. Significant differences between males and females for the same age were not observed. (A) The well-nourished control (WC) group, (B) the malnourished control group: the thymus showed a loss of corticomedullary differentiation with lobule decreases compared with the WC group. The three re-nutrition dietary supplements: (C) milk, (D) probiotic fermented milk (PFM) and (E) bacterial-free supernatant, improved the histological alterations caused by malnutrition, with the mice that received PFM being the group that shows histological characteristics similar to the WC animals.
Effect of the different re-nutrition supplements on thymic cellular apoptosis
The analysis of apoptosis showed a significant increase in the MC group (78 (sd 6)) compared with the WC group (62 (sd 6)). For mice that received milk (43 (sd 6)), PFM (32 (sd 7)) or BFS (43 (sd 6)) the number of apoptotic cells decreased, reaching values even lower than the WC group (Fig. 3).
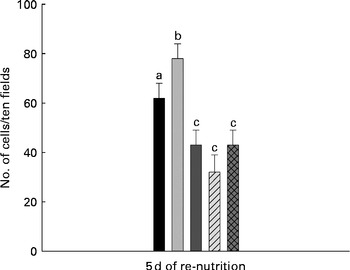
Fig. 3 Apoptosis assays in thymus comparing the different test groups. Cellular apoptosis was evaluated in the slices from thymus for the presence of DNA breaks using the Apoptosis Detection System kit (Promega). Apoptosis was expressed as the number of apoptotic cells in ten fields observed at 400 × magnification. Values are means for n 15 mice from each group, with standard deviations represented by vertical bars. a,b,cMean values with unlike letters were significantly different (P< 0·05). ■, Well-nourished control; ![]() , malnourished control; ■, milk;
, malnourished control; ■, milk; ![]() , probiotic fermented milk;
, probiotic fermented milk; ![]() , bacterial-free supernatant.
, bacterial-free supernatant.
Influence of different supplements added to diet on marker expression in macrophages and dendritic cells
The number of macrophages and DC in thymus was not affected by malnutrition. Mice re-nourished with milk or PFM maintained the number of these cells similar to the MC group and close to the WC group. In the BFS group, the number of macrophages increased significantly and the number of DC decreased significantly compared with the MC and WC groups (Fig. 4(A) and (B)).

Fig. 4 Macrophages and dendritic cells (DC) in thymus. (A) Macrophages and (B) DC were determined for the markers F4/80 and 33D1, respectively, by indirect immunofluorescence on the thymus tissue slides of mice from different experimental groups (well-nourished control (■), malnourished control (![]() ) and re-nourished with milk (■), probiotic fermented milk (
) and re-nourished with milk (■), probiotic fermented milk (![]() ) or bacterial-free supernatant (
) or bacterial-free supernatant (![]() )). Results were expressed as number of positive cells recognised for the respective primary antibody, counted in ten fields of vision at 1000 × of magnification. Values are means for n 15 mice from each group, with standard deviations represented by vertical bars. a,b,cMean values with unlike letters were significantly different for each cell population (P< 0·05).
)). Results were expressed as number of positive cells recognised for the respective primary antibody, counted in ten fields of vision at 1000 × of magnification. Values are means for n 15 mice from each group, with standard deviations represented by vertical bars. a,b,cMean values with unlike letters were significantly different for each cell population (P< 0·05).
Evaluation of CD4+ and CD8+ (single- and double-positive) T lymphocytes
The analysis of T-cell populations in thymus showed a significant decrease of single-positive thymocytes (CD4+CD8−) in the mice from the MC group (11 (sd 1) %) compared with the mice from the WC group (17 (sd 2) %). In mice that received PFM (17 (sd 2) %), milk (14 (sd 0) %) or BFS (15 (sd 0)) as re-nutrition diet, these values increased significantly compared with the MC group. The effect was remarkable for PFM, where the values were similar to the WC group. The percentage of immature double-positive thymocytes (CD4+CD8+) increased significantly in mice from the MC group (81 (sd 1) %) compared with the WC control group (76 (sd 2) %) and the test groups, milk (77 (sd 1) %), PFM (74 (sd 2) %) and BFS (78 (sd 2) %) (Fig. 5(A) and (B)). No significant differences were observed in the percentage of single-positive (CD8+CD4−) cells among all the groups.

Fig. 5 CD4+ and CD8+ (single- and double-positive) T lymphocytes in thymus. The number of CD4+ and CD8+ cells was determined by flow cytometry. (A) Values are means for n 15 obtained from mice of each group, with standard deviations represented by vertical bars. a,bMean values with unlike letters were significantly different for each cell population (P< 0·05). ■, Well-nourished control (WC); ![]() , malnourished control (MC); ■, mice re-nourished with milk (M);
, malnourished control (MC); ■, mice re-nourished with milk (M); ![]() , probiotic fermented milk (PFM);
, probiotic fermented milk (PFM); ![]() , bacterial-free supernatant (BFS). Representative dot plots of the different groups are shown in (B) WC, (C) MC, (D) M, (E) PFM and (F) BFS. FL-1 is for fluorescein isothiocyanate (FITC) and FL2 is for phycoerythrin (PE). FIFC anti-CD8 and PE anti-CD4 antibodies were used.
, bacterial-free supernatant (BFS). Representative dot plots of the different groups are shown in (B) WC, (C) MC, (D) M, (E) PFM and (F) BFS. FL-1 is for fluorescein isothiocyanate (FITC) and FL2 is for phycoerythrin (PE). FIFC anti-CD8 and PE anti-CD4 antibodies were used.
Determination of cytokine expression in thymus tissues
The number of IL-2-producing cells decreased in the MC group (14 (sd 5)) compared with the WC group (28 (sd 7)). IL-2+ cells increased significantly only in the thymus of mice re-nourished with PFM (26 (sd 5)) compared with the MC, with these values being near to those obtained in the WC group. No significant differences were found between the mice that received milk (21 (sd 6)) or BFS (21 (sd 8)); however, the production of this cytokine was increased in these groups compared with the MC group.
IFN-γ+ cells increased in the MC group compared with the WC group. This cytokine also increased significantly in mice that received PFM (49 (sd 6)) compared with the WC group (34 (sd 7)), but it did not show significant differences between the MC group (46 (sd 13)) and the group of mice given milk (47 (sd 9)) as a re-nutrition diet, while BFS administration (22 (sd 8)) showed lower levels than the other groups under study.
TNF-α+ cells increased significantly in the MC group (45 (sd 4)) compared with the WC group (34 (sd 6)). No significant differences were observed among the test groups, milk (36 (sd 8)), PFM (35 (sd 7)) and BFS (28 (sd 4)), where the values obtained were similar to the WC group.
The analysis of IL-6+ cells showed a diminution in the MC group (21 (sd 6)) in comparison to the WC group (33 (sd 5)). In mice given milk (33 (sd 7)) or PFM (33 (sd 6)), these cells increased significantly compared with the MC group, reaching values similar to the WC group. For the BFS group (19 (sd 5)), the values were similar to the MC group.
IL-4+ cells in the thymus of the animals that received BFS decreased significantly (15 (sd 6)) compared with the WC group (34 (sd 5)). No significant differences were found among the rest of the groups (MC group: 26 (sd 7), milk: 28 (sd 5) and PFM: 24 (sd 2)). These cells were diminished when compared with the WC group.
IL-10+ cells only increased significantly in mice that received PFM (41 (sd 3)), compared with the WC group (21 (sd 6)) and the MC group (31 (sd 4)). The re-nutrition diets supplemented with milk (21 (sd 6)) did not decrease the number of IL-10+ cells significantly in comparison to the MC group. The values of IL-10+ cells in the BFS group (12 (sd 5)) were lower than the MC group.
The values of IL-12+ cells were similar to the WC group in all the test groups (Table 1).
Table 1 Cytokine-producing cells in the lamina propria of the small intestine* (Mean values and standard deviations for n 15 mice from each group)

IFN, interferon; WC, well-nourished control; MC, malnourished control; M, mice re-nourished with milk; PFM, probiotic fermented milk; BFS, bacterial-free supernatant; ND, not determined.
a,b,cMean values within a column with unlike superscript letters were significantly different (P< 0·05).
* Cytokine-producing cells were detected in the thymus of mice from different experimental groups (WC, MC and M, PFM or BFS) by indirect immunofluorescence assays. Results were expressed as the number of positive cells counted in ten fields of vision at 1000 × magnification.
Discussion
The thymus is one of the most affected organs during an undernourished process. In malnourished mice, the thymus undergoes histological atrophy and changes in the lymphoid compartment(Reference Nagib, Gameiro and Stivanin-Silva1–Reference Lynch, Goldberg and Chidgey4). It was observed that in severe malnourished mice the thymic intralobular extracellular matrix containing fibronectin, laminin and type IV collagen increased. The enhancement of these extracellular matrix was correlated with the degree of thymocyte depletion(Reference Lyra, Madi and Maeda12). In our non-severe PEM model using BALB/c mice, the administration of PFM or its BFS as a re-nutrition supplementation improved thymic histology faster than milk administration, with this effect being more remarkable for PFM (Fig. 2), and no differences were observed between males and females. This histological improvement induced by the different treatment was accompanied by a diminution in cellular apoptosis (programmed death cells). In this sense, it has been suggested that nutritional imbalances can induce apoptosis in a variety of cell types(Reference Ortiz, Cortes and Cortes13). We observed that malnourished mice increased the number of apoptotic cells in the thymus; this result agrees with the findings of other authors, where malnutrition was associated with a significant increase of spontaneously apoptotic cells in the thymus(Reference Ortiz, Cortes and Cortes13, Reference Savino and Dardenne14). The thymus samples obtained after the re-nutrition period showed that the three dietary supplements decreased cellular apoptosis in this organ, reaching values similar or slightly lower than the WC group (Fig. 3). These results demonstrated that the physiological equilibrium between cellular mitosis and apoptosis was improved, and that the three dietary supplements assayed would stimulate the activation of the cells instead of cell death.
The improvement observed in the histology of the thymus and the diminution in cellular apoptosis led us to analyse other immune cell populations, such as the antigen-presenting cells, i.e. macrophages and DC. These cells participate in the process of selection and maturation of T lymphocytes that are unable to recognise self-antigens, before they are released from the thymus to peripheral secondary immune tissues (the spleen and the lymph). The analysis of these two antigen-presenting cell populations (Fig. 4(A) and (B)) showed that in the non-severe PEM model used in the present study, no significant differences were observed in the MC group compared with the WC group. The numbers of these cells were also not affected by re-nutrition with the PFM or milk; however, BFS administration induced an increase in the number of macrophages accompanied with a significant decrease in the number of DC in the thymus, compared with the malnourished and well-nourished mice. We believe that the number of mature macrophages increases in detriment of DC to favour the positive selection of T cells to be released from the thymus to the periphery, because the macrophages are more effective than DC in this function. However, this lack of regulation by the BFS would not be desirable, because it is far from the physiological condition (the WC group). The effect obtained with the PFM and milk groups was more regulated and near to the physiological conditions.
T lymphocyte subsets were also analysed to evaluate if the re-nutrition diets can influence this population that is severely affected by malnutrition. In this sense, there are publications showing that increased apoptosis affects CD4+CD8+ double-positive lymphocytes in severe malnutrition(Reference Savino and Dardenne14, Reference Savino, Dardenne and Velloso15). However, other studies did not show significant differences in this double-positive cell population comparing the thymus of well-nourished and malnourished rats(Reference Ortiz, Cortes and Cortes13). The present results showed that non-severe PEM decreased the percentage of CD4+CD8− single-positive thymocytes, with increases in the percentage of immature double-positive thymocytes (CD4+CD8+). In WC, this population is able to mature into single-positive (CD4+CD8− or CD4−CD8+) T cells and to be released from the thymus into peripheral tissues. This increase in double-positive thymocytes was not observed in the test groups that received PFM or BFS, where the re-nutrition diet was able to recover the percentage of CD4+CD8− single-positive T cells. No significant differences in the immature double-positive thymocytes were observed in the mice that received any supplement diets, with the values being similar to those obtained from the WC group. These observations agree with the improvement in the histology of the thymus and with the diminution of cellular apoptosis results from the mice that received re-nutrition diets. The PFM group showed the best effect on the T-cell population of the thymus and reached the number of CD4+CD8− single-positive thymocytes similar to those observed in the WC group.
Considering that the subsets of lymphocytes did not show significant differences between the groups that received the re-nutrition diets and the WC group, the cytokine-producing cells were analysed to know about the functionality of the T cells in this malnourished model and after supplementation with different re-nutrition diets. Thymic cytokines are involved, along with other effects, in the migration, development of thymocytes and in the regulation of the CD4+ and CD8+ T-cell populations(Reference Savino and Dardenne14).
IL-2 is a cytokine that decreases with different nutritional deficiencies in the lymphoid organs and in the serum(Reference Cunningham-Rundles, Moon, McNeeley, Walker, Watkins and Duggan16). It is an example of an autocrine factor in the thymus, for which the producers and targets are thymocytes(Reference Yarilin and Belyakov17). In the present study, the cells that produce this cytokine decreased significantly in the mice from the MC group, and this observation could be related to the decreases observed for the mature CD4+ single-positive T lymphocytes. After re-nutrition with any of the diets assayed, IL-2+ cells reached the values observed in the thymus of well-nourished mice, which agree with the improvement of the thymocyte subsets after re-nutrition.
Another cytokine that can be affected by malnutrition is IFN-γ, which is produced mainly by T lymphocytes and activates thymic epithelial cells(Reference Yarilin and Belyakov17). In our model, differing from the results obtained for other authors, we did not observe significant differences after malnutrition in the MC group or in the group that received milk compared with the WC group. The BFS group showed a significant diminution in this cytokine. However, re-nutrition with PFM increased the number of IFN-γ-positive cells significantly in the thymus compared with the well-nourished mice. This cytokine could be produced by T cells, macrophages and also by natural killer T cells and the increase observed could be attributed to increases in the functionality or in the number of these cell populations. The increases observed for IFN-γ showed that PFM administration could activate thymic epithelial cells and it could influence the proliferation and activation of thymocytes.
Other cytokines related to macrophage functionality, such as TNF-α and IL-12, did not have the same profile. The numbers of IL-12 producer cells were similar in the thymus after malnourished or re-nourished periods, which would be in agreement with the results obtained for macrophages. However, the TNF-α-positive cells increased significantly in the MC group and decreased after re-nutrition without differences between the diets. These increases in TNF-α could be related to the increases in the thymic apoptotic cells observed in the mice from the MC group, as was reported in other models(Reference Cho, Adamson and Greenhalgh18).
IL-6 was the other cytokine analysed, which is produced primarily by thymic epithelial cells and can also be produced by CD4+ T lymphocytes and macrophages. In the present study, IL-6-positive cells decreased significantly in malnourished mice, which was in accordance with the decrease in the mature T-cell subset. IL-6 producer cells increased in the mice after re-nutrition with milk or PFM, but not with BFS, reaching the values observed in well-nourished mice in the first two groups. This observation could be related to the restoring of the thymocyte proliferation and maturation observed after consumption of the re-nutrition diet(Reference Tseng, Wu and Yang19).
The analysis of IL-4 showed that this cytokine decreased after malnutrition, with the number of IL-4-positive cells being significantly diminished in the groups that received PFM or BFS compared with both the WC and the MC groups. IL-4 can be produced by thymocytes and also by natural killer T cells. It is known that IL-4 inhibits the growth and differentiation of fetal mouse thymus in organ culture(Reference Plum, De Smedt and Billiau20). The lack of increase in this cytokine after PFM administration agrees with the increase in IFN-γ production in the thymus of these mice, where, as was discussed earlier, IFN-γ is involved in the activation of the thymic epithelial cells to release other cytokines and to regulate IL-4 production, which can participate in the activation and proliferation of thymocytes(Reference Yarilin and Belyakov17).
Finally, IL-10 was studied and the results showed that the mice given PFM during the re-nutrition period showed significantly increased number of positive cells for this cytokine. These increases can contribute to the decrease in cellular apoptosis observed after re-nutrition. IL-10 can act as an anti-apoptotic factor, increasing Bcl-2 expression (related to mitosis), reducing caspase-3-dependent thymocyte apoptosis and improving survival(Reference Oberholzer, Oberholzer and Bahjat21).
It is important to note that, in the analysis of the cytokines, the best improvement in thymus function was observed with the administration of PFM during the re-nutrition period. Mice given the BFS presented a slight improvement in the thymus, similar to the milk re-nutrition. This fact demonstrated the importance of the whole fermented product to have the best effect in the histology and function of the thymus in this non-severe PEM model.
This is a first report in an animal model of malnutrition using BALB/c mice, demonstrating the effect of probiotic administration on the thymus after a period of malnutrition. The improvement in thymic function would be also responsible for the increase in the mucosal and systemic immune responses observed in previous studies using the same non-severe malnutrition model(Reference Maldona do Galdeano, Novotny Nunez and de Moreno de LeBlanc7).
Studies to find out more about the probiotic effect on different cell populations, such as natural killer T cells, and on the components from thymic intralobular extracellular matrix, such as fibronectin, involved in the maturation or in the cellular differentiation in the thymus of malnourished mice are currently underway.
Acknowledgements
The present study was funded by a grant from DANONE – Argentina and CONICET. R. W. works in the Research and Development Division of DANONE-Argentina S. A. in Buenos Aires, and participated in the discussion and in the revision of the manuscript. DANONE Argentina S. A. commercialises the fermented product investigated in the present study. The rest of the authors declare that they have no competing interests. I. N. N., C. M. G. and A. d. M. d. L. carried out the microbiological work, the animal studies and the immunological determinations. G. P., E. C. and R. W. conceived the study. C. M. G., A. d. M. d. L. and G. P. designed the experiments. I. N. N., C. M. G. and A. d. M. d. L. performed the statistical analyses and prepared the figures. I. N. N., C. M. G., A. d. M. d. L. and G. P. wrote the draft of the manuscript. E. C. and R. W. revised it for significant intellectual content. All authors read and approved the final version of the manuscript. The present study had been financially supported by a DANONE-Argentina-CONICET grant, CIUNT 26/D 442 (Universidad Nacional de Tucumán) and CONICET PIP 0652, Argentina.


