


Excess body weight and obesity, which are mostly due to unhealthy diets, are considered as global health threats resulting in premature deaths(1, Reference Beltrán-Sánchez, Harhay and Harhay2). Among the unhealthy diets that include high-energy foods enriched with sugar and salt, high-fat diet (HFD) consumption is closely associated with metabolic diseases and gastrointestinal dysfunctions(Reference Beltrán-Sánchez, Harhay and Harhay2, Reference Little, Horowitz and Feinle-Bisset3). Animal studies have proved that feeding with HFD for a prolonged period, or even for short periods, increased the length of intestinal villi, stimulated mucus, pancreatic lipase and cholecystokinin secretions, facilitated gastric emptying and impaired mucosal barrier function(Reference Covasa and Ritter4–Reference Sukhotnik, Mor-Vaknin and Drongowski9). Due to obesogenic HFD that alters epithelial barrier function, the production of NEFA, reactive oxygen species and pro-inflammatory cytokines is increased(Reference Matsuzawa-Nagata, Takamura and Ando10, Reference Miao, Chen and Hao11), and gut microbial populations are altered(Reference Conlon and Bird12–Reference Turnbaugh, Ley and Mahowald16). Feeding with HFD in mice has resulted in dysbiosis, presenting with a decreased population of Gram-negative Bacteroidetes and an expanded number of Proteobacteria and Firmicutes(Reference Hildebrandt, Hoffmann and Sherrill-Mix17). Since gut microbiota is necessary to defend the host against inflammation and maintain its metabolic homeostasis(Reference Chow, Lee and Shen18–Reference Wells, Brummer and Derrien20), gut microbial dysbiosis induced by HFD disturbs the intestinal barrier structure and paracellular permeability(Reference Cani, Rodrigo and Knauf21–Reference Tilg and Moschen24) and increases the susceptibility to inflammatory and metabolic disorders(Reference Martinez, Leone and Chang25, Reference Simrén26). Moreover, HFD-induced impairment in the chronobiological pattern of gut microbiota also affects the host metabolism and modulates hepatic circadian clock gene expression(Reference Leone, Gibbons and Martinez27).
Antibiotics, which are prescribed regularly to treat a wide spectrum of infectious diseases, are also known to affect the composition of commensal gut microbiota(Reference Jernberg, Löfmark and Edlund28). Similar to that occurs with HFD consumption, the gut microbiota imbalance due to antibiotic use was also correlated with the existence of several local or systemic inflammatory diseases, which include metabolic and gastrointestinal diseases(Reference Blumberg and Powrie29–Reference Ridaura, Faith and Rey31). In high-cholesterol-fed rats, antibiotic treatment was shown to further enhance hepatic injury(Reference Hu, Wang and Liang32), which was attributed to elevated lipopolysaccharide absorption and increased generation of pro-inflammatory cytokines and chemokines in the liver. Antibiotic-induced perturbations in gut microbiota of mice were reported to alleviate HFD-induced metabolic endotoxaemia and to improve insulin signalling and glucose tolerance(Reference Cani, Rodrigo and Knauf21, Reference Carvalho, Guadagnini and Tsukumo33, Reference Membrez, Blancher and Jaquet34). Thus, the data on the effects of antibiotics on HFD-induced hepatic and intestinal inflammation are still debatable and appear to depend on the duration of HFD-feeding and/or antibiotic treatment.
As the major regulator of circadian rhythm and an antioxidant hormone, melatonin adjusts the energy balance by reducing adipose tissue and improves diseases related to abnormal fat metabolism(Reference Navarro-Alarcón, Ruiz-Ojeda and Blanca-Herrera35). Long-term treatment with melatonin reduced body weight and intra-abdominal adiposity and prevented metabolic abnormalities induced by high-energy diet or ageing(Reference Nduhirabandi, Du Toit and Blackhurst36, Reference Wolden-Hanson, Mitton and McCants37). Similarly, a prolonged treatment with melatonin diminished oxidative stress and hepatic inflammation and improved hepatic functions in patients or rats with non-alcoholic fatty liver disease(Reference Celinski, Konturek and Slomka38–Reference Hussein, Ahmed and Hassan40), possibly by its radical scavenging and antioxidant activities(Reference Esteban-Zubero, Alatorre-Jimenez and López-Pingarrón41, Reference Hermoso, Shimada and Gilglioni42). Recently, it was shown that melatonin treatment in HFD-fed mice reduced body weight, protected against hepatic steatosis, improved insulin resistance and reversed dysbiosis by decreasing the ratio of Firmicutes to Bacteroidetes(Reference Xu, Wang and Hong43).
There is extensive evidence suggesting that obesity and prolonged consumption of fat-rich diet are associated with gut inflammation and adverse metabolic consequences(Reference Lam, Mitchell and Holmes44). However, the impact of a short-term high-fat consumption, which is commonly advised by many low-carbohydrate diet programmes for quick weight loss, on colonic microbiota, hepatic and intestinal inflammation in correlation with its metabolic effects was not thoroughly studied before. Based on the above background, the aim of the present study was to elucidate the effect of a 2-week HFD feeding on hepatic and intestinal oxidative status, enteric microbiota and intestinal motility. Second, the effects of antibiotics and/or melatonin treatments on diet-induced changes in gut function and inflammation were further investigated.
Materials and methods
Animals
Male Sprague–Dawley rats (10–12 weeks old; 250–300 g) were supplied by the Marmara University Animal Center (DEHAMER) and then housed in a room with standardised light–dark (12 h–12 h) cycles, controlled temperature (22 ± 2°C) and humidity (65–70 %). The experiments were performed in compliance with the Turkish law on the use of animals in experiments, and the principles and guidelines developed by the New York Academy of Sciences were followed. All experimental protocols were approved by the Marmara University Animal Care and Use Committee (77.2015. mar).
Experimental design
Based on oxidative injury of the intestines (malondialdehyde (MDA) level) regarding diet types and/or antibiotic usage, the G Power program was used for the sample size calculation. Rats (n 64) were randomly divided into two groups and were fed with either a standard diet (SD, 18 % of energy from fat) or a HFD (45 % of energy from lard fat) for 2 weeks. Rats in the SD group were pair-fed as HFD to prevent any difference in energy intake between groups. Within these 2 weeks, SD and HFD groups were randomly divided into four subgroups each consisting of eight rats, in which melatonin or antibiotics (ABX) or melatonin plus ABX were provided in the animals’ drinking water or they received normal tap water ad libitum. Fresh drinking water containing melatonin (4 mg/kg per d; Sigma) was prepared three times a week, and the bottles were covered by Al foil to protect from light. An ABX mix (neomycin, ampicillin, metronidazole; 1 g/l each) was chosen based on their activity and their effects on intestinal microbiota(Reference Carvalho, Guadagnini and Tsukumo33). Neomycin (Vilsan Veterinary Pharmaceuticals) is known to have an excellent bactericidal activity against Gram-negative bacteria, and a partial activity against Gram-positive bacteria, while ampicillin can penetrate Gram-positive and some Gram-negative bacteria. Metronidazole (Fresenius Kabi İlaç) is used against anaerobic organisms and protozoa (Actavis İlaçları). On the 14th day of the feeding and treatment period, each rat was placed in a single housing cage for 3 h. The faecal pellet output for each rat was determined from the stool volume (mg) and the number of faecal pellets recorded within 3 h(Reference Isman, Yegen and Alican45). All rats were then subjected to a 12-h fasting for the measurement of intestinal transit time on the 15th day, but they had free access to water. Following decapitation, trunk blood was collected; epididymal and perirenal adipose tissues, liver and small intestines were removed and weighed. Serum, liver and ileum samples were stored for biochemical (at −80°C) and histopathological (in formalin or glutaraldehyde) assessments.
Measurement of intestinal motility
On the 15th day of the experiment, intestinal motility was measured by instilling 1 ml of a mixture (at 37°C) of activated charcoal (20 %) and Arabic gum (10 %; Sigma Chemical Co.) in saline into the stomach of the animals via a polyethylene gavage tubing (PE-240; Fisher Scientific). Following a 30-min transit period, the animals were decapitated. The intestines were clamped at the pylorus and caecum, freed gently from their mesentery and laid longitudinally without stretching to prevent the movement of intraluminal contents. Then, intestinal transit index (%) was calculated from the distance reached by the black luminal content and the total length of the small intestine from pylorus to caecum(Reference Ünlüer, Alican and Yeğen46).
Measurement of metabolic parameters in the serum
Serum levels of alanine transaminase, aspartate aminotransferase, total and direct bilirubin, total cholesterol, TAG and glucose were determined by colorimetric assay using a Clinical System 700 analyser (Beckman Instruments).
Extraction of total DNA from caecal contents
When the intestines were removed for the measurement of intestinal motility, faecal samples were collected from caeca under sterile conditions and stored at –80°C until examination. For bacterial DNA isolation, faecal specimens (200 mg) were homogenised by high-speed vortexing in 1-ml buffer, and QIAamp DNA Stool Mini kit (Qiagen) was used according to the given instructions in the kit manual for isolation of DNA from stool for pathogen detection. DNA concentration was measured by a spectrophotometer (Nanodrop ND-1000; Fisher Thermo) at 260-nm wavelength and extracts were kept at –20°C(Reference Queipo-Ortuño, Seoane and Murri47).
Quantitative PCR analysis
Quantitative real-time PCR (qPCR) was used for the detection of different bacterial groups in faecal microbiota by appropriate primers for Bacteroidales, Clostridiales and Enterobacteriales (Table 1). For the qPCR reaction, GM SYBR qPCR kit (Genemark) was utilised with Rotor-Gene Q thermal cycler (Qiagen. In a 20-µl total volume of PCR mixture, 1 µl of faecal extract was mixed with 200 nM of each primer. After the initial denaturation at 95°C for 10 min, cycling conditions consisted of forty-five repeats of the following steps: at 95°C for 10 s, at 55°C for 20 s and at 72°C for 15 s. Rotor-Gene Q software (Qiagen) was used to analyse qPCR products. Briefly, final absolute amounts of target bacterial phyla were estimated by relating the cycle threshold values to the standard curves obtained from representative bacterial species for each group (Bacteroides fragilis ATCC25285 for Bacteroidales, Clostridium difficile NCTC 11223 for Clostridiales and Escherichia coli ATCC25922 for Enterobacteriales)(Reference Hartman, Lough and Barupal48).
Table 1. Primers used in quantitative PCR for the detection of Bacteroidales, Clostridiales and Enterobacteriales in faecal microbiota

Measurement of hepatic and intestinal myeloperoxidase activity
Myeloperoxidase (MPO) activity is commonly used to estimate neutrophil infiltration in an inflamed tissue, because it correlates well with the histochemically counted neutrophil content(Reference Bradley, Priebat and Christensen49). For this purpose, liver and ileum samples were homogenised in 0·5 % hexadecyltrimethylammonium bromide (50-mM potassium phosphate buffer at pH 6), centrifuged for 10 min at 12 000 rpm and 4°C. The pellet was then homogenised in 50-mM K2HPO4 containing hexadecyltrimethylammonium bromide (0·5 %) and EDTA (10 mM; Sigma Chemical Co.). MPO activity was determined by spectrophotometry at 460 nm through the measurement of H2O2-dependent oxidation of O-dianisidine.2HCl. The amount of MPO activity was expressed as U/g tissue.
Measurement of hepatic and intestinal malondialdehyde and GSH levels
Liver and ileum samples were homogenised (Ultra Turrax, IKA) in 10 volumes of ice-cold 10 % trichloroacetic acid and centrifuged for 15 min at 3000 g and 4°C. After the removal of the supernatant, an additional centrifugation was made at 10 000 g for 8 min. Formation of thiobarbituric acid-reactive substances was measured to determine the MDA levels (U/g tissue) as by-products of lipid peroxidation(Reference Casini, Ferrali and Pompella50). GSH levels (nmol/g tissue) were determined using a modified Ellman procedure(Reference Aykaç, Uysal and Yalçin51).
Measurement of hepatic and intestinal luminol- and lucigenin-enhanced chemiluminescence levels
Chemiluminescence (CL) assay is frequently used as a non-invasive method for the direct measurement of reactive oxygen metabolites (ROM). Among the probes used as enhancers, lucigenin probe specifically detects superoxide radical, while luminol is used commonly for the detection of OH, H2O2 and HOCl radicals(Reference Kolgazi, Cantali-Ozturk and Deniz52). Luminescence of the liver and ileum samples was recorded at room temperature using Mini Lumat LB 9509 luminometer (EG&G Berthold) by adding luminol or lucigenin (0·2 mM each). For the measurement of NO, luminol-sodium salt (3·6 μM) was used as the probe and added to the reaction tube containing K2CO3 (0·4 mM) and H2O2 (4 mM). Counts were made at room temperature at 1-min intervals for totally 5 min. For the determination of peroxynitrite, a NO scavenger (carboxy-PTIO) was added to the test tube and incubated for 15 min in dark and the measurements were repeated. By linear approximation, CL levels were calculated and expressed as AUC of relative light unit per mg hepatic or ileal tissue(Reference Haklar, Ulukaya-Durakbaś and Yüksel53).
Histopathological analysis
Ileum and liver tissues, obtained from all experimental groups, were fixed in 10 % neutral-buffered formalin and underwent routine histological assessments for light microscopic analyses. Briefly, tissues were dehydrated in ascending alcohol series (70, 90, 96, 100 %), cleared with xylene and embedded in paraffin. Paraffin tissue blocks were cut in a thickness of 5 µm by a rotary microtome (RM2125RT; Leica), then the sections were stained with the haematoxylin and eosin technique for histopathological evaluations. The tissue sections were analysed and photographed through a light microscope (BX51; Olympus), which is attached to a digital camera (DP72; Olympus). The measurement of villi heights was performed on the micrograph obtained from all the ileal tissue sections, and at least 10 villi from each animal were measured by using Image J (NIH) software.
In order to analyse the specimens in electron microscopy, ileum and liver samples were fixed in 2·5 % glutaraldehyde (in 0·1-m phosphate-buffered solution) for 4–6 h. After post-fixation with 0·1 % osmium tetraoxide, tissues were dehydrated in ascending alcohol series (70, 90, 96, 100 %), then incubated in propylene oxide and embedded in Epon812. Epon tissue blocks were cut at 1-µm thickness by ultramicrotome (Leica Ultracut R) and placed on glass slides. Semi-thin sections were stained with toluidine blue to determine the region of interest in each section under light microscopy. The specific areas of Epon blocks were trimmed and sectioned to obtain ultrathin sections (90–100 nm). Copper grids, contained the tissue specimens, were contrasted with 1 % uranyl acetate and lead citrate in a routine manner. Stained grids were examined and photographed by the transmission electron microscope (JEM-1200; JEOL) and the attached digital camera (SIS Morada). Histopathological analyses were done by two experienced histologists (Ş. Ç. and O. T. C. K. ), who were blinded to the experimental groups.
Statistical analysis
The experiment consisted of two types of diets, namely, standard and high fat, and four types of treatments, namely, control, melatonin, antibiotics, melatonin and antibiotics. Our main interest was to test how the oxidative injury of the intestines (MDA level) was affected with respect to diet types and/or antibiotic usage. In calculating statistical power, the G Power program was used for the sample size calculation(Reference Faul, Erdfelder and Buchner54). The calculated Pillai’s trace effect size was 0·522 for diet types. For a sample size of sixty-four rats and an effect size of 0·522, the difference would be detected with a power of 80 % and a two-sided significance level of 0·05 using a multivariate ANOVA test.
Analyses of the functional, biochemical and histopathological data were carried out by two-way ANOVA followed by post hoc Tukey multiple comparisons test or Dunnett multiple comparisons test. Normality of each variable was tested by Shapiro Wilk’s test, histograms, boxplots, QQ plots and PP plots. Bacteroidales, Clostridiales and Enterobacteriales were taken within the same sample from each rat. Their distributions were close to normal after logarithmic transformation. It was also of interest to test how the microbiota changed with respect to diet types and treatments. Moderate correlations between each transformed dependent variable (logBacteroidales, logClostridiales and logEnterobacteriales) were found using the Pearson correlation. The two-way multivariate ANOVA was employed for comparisons. Mauchly’s test was employed to check the assumption of sphericity. Box’s M test of equality of covariance matrices was employed for checking homogeneity of variance–covariance matrices. Mahalanobis distances were computed to check for outliers. Significant differences were followed with pairwise comparisons with Bonferroni adjustment.
The statistical analyses were performed using the GraphPad Prism 6.0 (GraphPad Software, Inc.), SPSS 17.0 and R 3.4.4 software programs. Differences were considered significant at P<0·05.
Results
Body weights that were recorded every other day within the 2-week period were not different among the experimental groups (data not shown). Weights of the perirenal and gonadal fat tissues in SD-fed rats were similar, but a tendency to decline was observed in groups that were given ABX alone or in combination with melatonin (Fig. 1 and Table 2). In the rats fed with HFD for 2 weeks, perirenal fat tissue was significantly elevated (P<0·01). Intake of ABX mixture in HFD-fed rats reduced the perirenal fat weights (P<0·001), but not epididymal weight. Melatonin had no effect on the weight of epididymal fat, while HFD-induced accumulation of perirenal fat was significantly reduced by melatonin (P<0·01).
Fig. 1. Perirenal fat weights, serum levels of glucose and TAG in standard diet (SD) or high-fat diet (HFD) groups that were treated with antibiotics (ABX; ![]() ), melatonin (
), melatonin (![]() ), melatonin + ABX (
), melatonin + ABX (![]() ), as compared with those that were given only tap water (
), as compared with those that were given only tap water (![]() ). Values are means, with standard errors represented by vertical bars. **P<0·01, ***P<0·001 v. SD-fed and tap water-given group, †P<0·05, †††P<0·001 v. HFD-fed and tap water-given group. For each group, n 8. ‡ To convert glucose in mg/dl to mmol/l, multiply by 0·0555. To convert TAG in mg/dl to mmol/l, multiply by 0·0113.
). Values are means, with standard errors represented by vertical bars. **P<0·01, ***P<0·001 v. SD-fed and tap water-given group, †P<0·05, †††P<0·001 v. HFD-fed and tap water-given group. For each group, n 8. ‡ To convert glucose in mg/dl to mmol/l, multiply by 0·0555. To convert TAG in mg/dl to mmol/l, multiply by 0·0113.
Table 2. Effects of antibiotics and melatonin on epididymal fat weight and some metabolic parameters in the standard or high-fat diet groups
(Mean values with their standard errors)

* P<0·05, compared with standard diet + tap water-given group.
† P<0·05, compared with high fat diet + tap water-given group.
‡ To convert bilirubin in mg/dl to μmol/l, multiply by 17·1.
A 2-week ABX regimen in SD-fed rats and HFD consumption for 2 weeks significantly elevated blood glucose levels (P<0·001; Fig. 1). In contrast, intake of ABX combination either with melatonin or alone depressed the blood glucose level in the HFD-fed groups (P<0·001). Similar to glucose levels, use of ABX increased TAG levels in the normal diet groups, but this change did not reach statistical significance (Fig. 1). Although the elevation in serum TAG levels of HFD-fed group was not statistically significant, addition of ABX to HFD ingestion increased the TAG by 3- to 4-fold (P<0·001). Melatonin when given alone in the SD or HFD groups did not affect glucose or TAG levels as compared to those of the respective tap water-given control rats. Total cholesterol and total bilirubin levels were not different among the SD- or HFD-fed groups with different treatments (Table 2). On the other hand, direct bilirubin levels were elevated in the HFD groups (P<0·05), while administration of ABX further elevated total bilirubin level in the HFD-fed rats (P<0·05).
In rats on a SD, treatment with ABX or melatonin or their combination slowed down the intestinal transit significantly (P<0·05–0·01; Fig. 2). As compared to SD-fed rats, consumption of HFD also inhibited intestinal motility (P<0·05), and this inhibition was further enhanced with melatonin intake (P<0·001). On the other hand, HFD-induced decline in the intestinal transit index was abolished by ABX treatment, when given either alone or in combination with melatonin (P<0·05). Similar to intestinal transit, faecal output was also diminished by ABX, melatonin or HFD; but statistical significance was reached only when the combination of ABX and melatonin was given to SD-fed rats, or when HFD consumption was accompanied by melatonin intake (P<0·05).
Fig. 2. Small intestinal transit index, faecal output, ileal myeloperoxidase (MPO) activity and glutathione (GSH) levels and villus heights in standard diet (SD) or high-fat diet (HFD) groups that were treated with antibiotics (ABX; ![]() ), melatonin (
), melatonin (![]() ), melatonin + ABX (
), melatonin + ABX (![]() ), as compared with those that were given only tap water (
), as compared with those that were given only tap water (![]() ). Values are means, with standard errors represented by vertical bars. *P<0·05, **P<0·01, ***P<0·001 v. SD-fed and tap water-given group, †P<0·05, †††P<0·001 v. HFD-fed and tap water-given group. For each group, n 8.
). Values are means, with standard errors represented by vertical bars. *P<0·05, **P<0·01, ***P<0·001 v. SD-fed and tap water-given group, †P<0·05, †††P<0·001 v. HFD-fed and tap water-given group. For each group, n 8.
As a marker of neutrophil infiltration, MPO level in the small intestine was not altered by the change in diet, but treatment with ABX plus melatonin reduced neutrophil recruitment in both the SD- or HFD-fed rats (P<0·05; Fig. 2). Similarly, the levels of GSH as the endogenous antioxidant content were decreased in both diet groups when ABX were given with or without melatonin (P<0·001). The heights of ileal villi were not different among the SD-fed groups, and feeding with HFD had no effect on villi height (Fig. 2). However, as compared to SD-fed control group, ABX mixture supplemented with or without melatonin reduced the ileal villus height in the HFD-fed rats (P<0·05)
MDA level, which indicates oxidative tissue injury when it is elevated, was depressed by the treatment with ABX in the ileal tissues of both the SD- and HFD-fed rats (Fig. 3; P<0·001). Melatonin, as an antioxidant agent, also depressed MDA level in the ileal tissues of only HFD-fed rats (P<0·05). Although HFD feeding did not alter ileal MDA level, CL levels of NO and luminol were elevated in the ileal tissues of HFD-fed rats (P<0·001), indicating increased ROM generation. On the other hand, addition of ABX to HFD intake suppressed both the NO and luminol CL levels (P<0·05–0·001), while melatonin abolished HFD-induced elevation in luminol CL (P<0·001). Despite a similar increase in lucigenin level by HFD and its suppression by melatonin or ABX were observed, no statistical significance was reached.
Fig. 3. Oxidative tissue injury markers: ileal malondialdehyde (MDA), luminol, lucigenin and nitric oxide (NO) levels of standard diet (SD) or high-fat diet (HFD)-fed groups that were treated with antibiotics (ABX; ![]() ), melatonin (
), melatonin (![]() ), melatonin + ABX (
), melatonin + ABX (![]() ), as compared with those that were given only tap water (
), as compared with those that were given only tap water (![]() ). Values are means, with standard errors represented by vertical bars. *P<0·05, ***P<0·001 v. SD-fed and tap water-given group, †P<0·05, ††P<0·01, †††P<0·001 v. HFD-fed and tap water-given group. For each group, n 8. rlu, Relative light units.
). Values are means, with standard errors represented by vertical bars. *P<0·05, ***P<0·001 v. SD-fed and tap water-given group, †P<0·05, ††P<0·01, †††P<0·001 v. HFD-fed and tap water-given group. For each group, n 8. rlu, Relative light units.
In SD-fed rats, average liver weights corrected for their body weights were elevated upon the administration of ABX, while HFD consumption per se also elevated liver weights (P<0·01–0·001; Fig. 4). In contrast, administration of ABX to HFD-fed rats abolished HFD-induced increase in liver weight (P<0·01–0·001). ABX administration to both SD- or HFD-fed rats elevated alanine transaminase levels (P<0·001); while hepatic MPO activity was increased by ABX only in HFD-fed rats (P<0·01–0·001), but not in SD-fed rats. Compared with control rats, antioxidant GSH content in hepatic tissues of SD-fed rats was increased by ABX (P<0·001). HFD feeding also resulted in an elevated GSH level in the liver, whereas elevated hepatic GSH in HFD-fed rats was depleted when melatonin was co-administered with ABX (P<0·001), but not by only ABX or melatonin.
Fig. 4. Liver weights, serum alanine transaminase (ALT) levels, hepatic myeloperoxidase (MPO) activity and glutathione (GSH) levels of standard diet (SD) or high-fat diet (HFD) groups that were treated with antibiotics (ABX; ![]() ), melatonin (
), melatonin (![]() ), melatonin + ABX (
), melatonin + ABX (![]() ), as compared with those that were given only tap water (
), as compared with those that were given only tap water (![]() ). Values are means, with standard errors represented by vertical bars. **P<0·01, ***P<0·001 v. SD-fed and tap water-given group, †P<0·05, ††P<0·01, †††P<0·001 v. HFD-fed and tap water-given group. For each group, n 8.
). Values are means, with standard errors represented by vertical bars. **P<0·01, ***P<0·001 v. SD-fed and tap water-given group, †P<0·05, ††P<0·01, †††P<0·001 v. HFD-fed and tap water-given group. For each group, n 8.
Neither high-fat consumption nor the treatments with ABX or melatonin had a significant impact on hepatic MDA and NO levels (Fig. 5). However, luminol- and lucigenin-enhanced CL levels, indicating the generation of ROM, were elevated in the hepatic tissues of HFD-fed rats (P<0·05–0·001). Melatonin did not change HFD-induced increase in CL levels. In HFD-fed rats, ABX per se depressed luminol-CL (P<0·05) and abolished elevations in luminol- and lucigenin CL levels when co-administered with melatonin (P<0·001).
Fig. 5. Oxidative tissue injury markers: hepatic malondialdehyde (MDA), luminol, lucigenin and nitric oxide (NO) levels of standard diet (SD) or high-fat diet (HFD)-fed groups that were treated with antibiotics (ABX; ![]() ), melatonin (
), melatonin (![]() ), melatonin + ABX (
), melatonin + ABX (![]() ), as compared with those that were given only tap water (
), as compared with those that were given only tap water (![]() ). Values are means, with standard errors represented by vertical bars. *P<0·05, **P<0·01, ***P<0·001 v. SD-fed and tap water-given group, †P<0·05, †††P<0·001 v. HFD-fed and tap water-given group. For each group, n 8. rlu, Relative light units.
). Values are means, with standard errors represented by vertical bars. *P<0·05, **P<0·01, ***P<0·001 v. SD-fed and tap water-given group, †P<0·05, †††P<0·001 v. HFD-fed and tap water-given group. For each group, n 8. rlu, Relative light units.
In SD-fed rats, as compared to the tap water-given control group, the caecal colony counts were significantly higher in the melatonin-administered groups (P<0·001; Fig. 6(a)). Similarly, bacterial overgrowth was detected in the caeca of rats fed with HFD (P<0·05). When HFD intake was accompanied by either ABX or melatonin or both, the overall bacterial overgrowth was suppressed (P<0·05–0·01). Gut microbiota sequencing analysis from faecal samples revealed that feeding with HFD, as compared to feeding with SD, resulted in higher amounts of all the three bacterial phyla (Bacteroidales, Clostridiales and Enterobacteriales) (P<0·01–0·001; Fig. 6(b)). In the SD-fed rats, treatment with a cocktail of ABX for 2 weeks increased the abundance of Enterobacteriales, which includes pathogenic Gram-negative bacteria that have a higher potential for antibiotics resistance, and this was followed by increased amounts of Bacteriodales, consisting mostly anaerobic bacteria, and no apparent change in the prevalence of Clostridiales was observed. In the HFD-fed group, the proportions of the three bacterial phyla were similar, all of which were elevated as compared to those of untreated SD-fed rats. Melatonin, when given either to SD- or HFD-fed rats, caused increases in all the three studied bacterial groups, demonstrating that the diet type has no impact on the distribution of bacteria that have shown overgrowth by melatonin administration. In contrast to the disproportionate increase in the gut bacteria of SD-fed rats that has occurred by the ABX mixture, the amount of Clostridiales was also increased when melatonin was added to ABX.
Fig. 6. Counts of colony-forming units (CFU) (a) and analysis of different bacterial groups (Bacteroidales, Clostridiales and Enterobacteriales) by quantitative PCR (b) from faecal samples in standard diet (SD; ![]() ) or high-fat diet (HFD;
) or high-fat diet (HFD; ![]() ) groups that were treated with antibiotics (ABX;
) groups that were treated with antibiotics (ABX; ![]() ), melatonin (MEL;
), melatonin (MEL; ![]() ), MEL + ABX (
), MEL + ABX (![]() ), as compared with those that were given only tap water (
), as compared with those that were given only tap water (![]() ). Values are means, with standard errors represented by vertical bars. *P<0·05, ***P<0·001 v. SD-fed and tap water-given group, †P<0·05, ††P<0·01 v. HFD-fed and tap water-given group. For each group, n 8.
). Values are means, with standard errors represented by vertical bars. *P<0·05, ***P<0·001 v. SD-fed and tap water-given group, †P<0·05, ††P<0·01 v. HFD-fed and tap water-given group. For each group, n 8.
In both the SD-fed groups that have received tap water or melatonin, microscopic analysis of ileal sections revealed regular morphology with epithelium, glandular structures and a regular microvillus structure (Fig. 7), while a regular liver morphology consisting hepatocytes with normal cytoplasm and mitochondria, and normal sinusoids was observed (Fig. 8). When ABX was given in SD-fed rats, hypertrophy of goblet cells and intestinal glands with leucocyte accumulation was aberrant in the lamina propria, and these were verified by transmission electron microscope as disorganisation in the epithelial cell cytoplasm with lipid vesicles. Severe cytoplasmic degeneration of hepatocytes was present in the liver sections of ABX-administered SD-fed rats, while dense lipid droplet accumulations along with mitochondrial degeneration appeared in the hepatic tissues. Addition of melatonin to ABX reduced the hypertrophy of intestinal cells and cytoplasmic vacuolisation of hepatocytes, while transmission electron microscope revealed reduced epithelial disorganisation and hepatocyte vacuolisation.
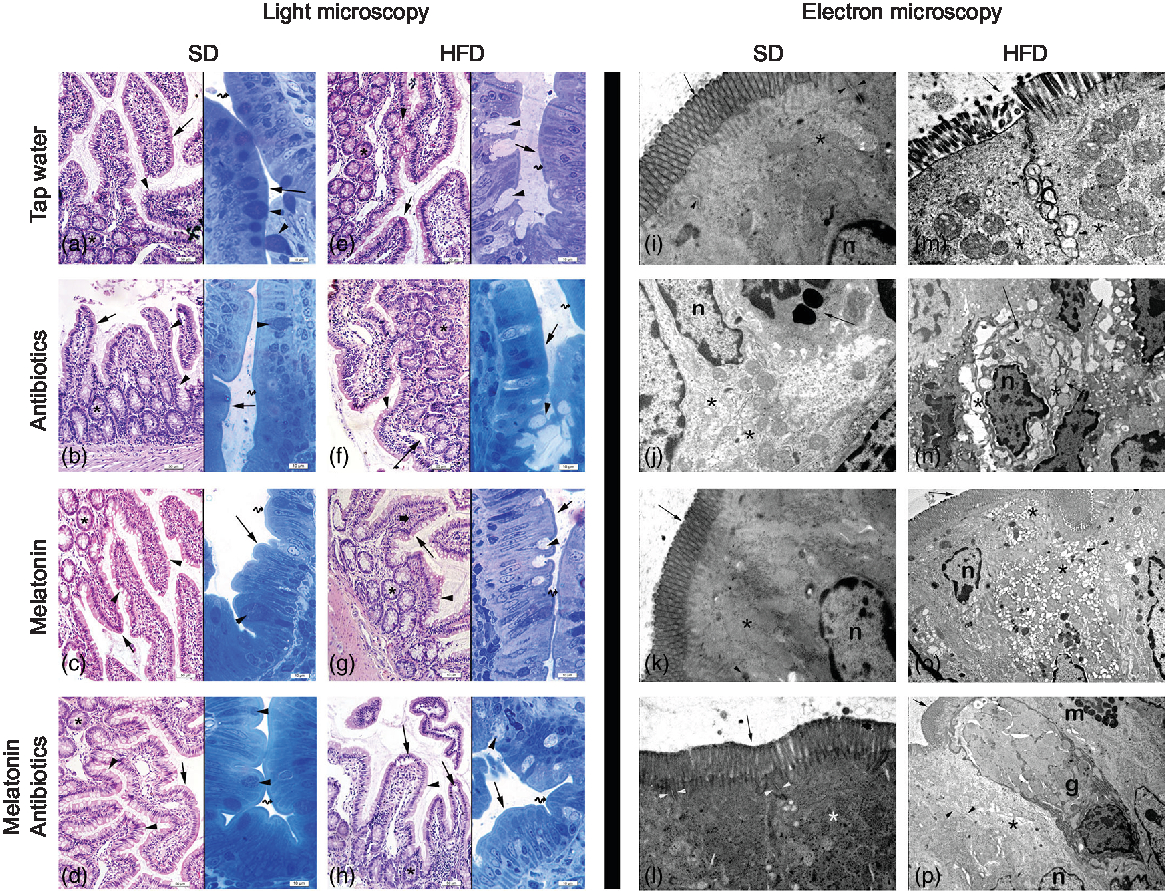
Fig. 7. Photomicrographs of intestinal tissues. (a) Standard diet (SD) + tap water-given group, and (c) SD + melatonin group. Regular morphology with epithelium (arrows) and glands (*), goblet cells (arrowheads) and brush border (curved arrow). (b) SD + antibiotics (ABX) group. Hypertrophy of goblet cells (arrowheads), epithelium (arrows), glands (*) and brush border (curved arrow). (d) SD + ABX + melatonin group. Reduction of hypertrophic goblet cells (arrowheads), epithelium (arrow) and brush border (curved arrow). (e) High-fat diet (HFD) + tap water-given group. Bolus extraction of mucous of goblet cells (arrowheads), epithelium (arrows), glands (*) and brush border (curved arrow). (f) HFD + ABX group. Partial oedema in the lamina propria (arrow), epithelium (arrow-inset), hypertrophic goblet cells (arrowheads), glands (*) and brush border (curved arrow). (g) HFD + melatonin group. Reduced mucous extraction (arrowheads) epithelium (arrows), glands (*) and brush border (curved arrow). (h) HFD + ABX + melatonin group. Reduced goblet cells (arrowheads), epithelium (arrows), glands (*) and brush border (curved arrow). Transmission electron microscope photomicrographs of intestinal tissues. (i) SD + tap water-given group, and (k) SD + melatonin group. Regular epithelium (arrows), cytoplasm (*) and mitochondria (arrowheads), n: nucleus, mag: 10000×. (j) SD + ABX group. Moderate mitochondrial degeneration (*), lysosomes in the cytoplasm (arrow), n: nucleus, 15000×. (l) SD + ABX + melatonin group. Regular tight junctions (arrowheads) and epithelium (arrow) and cytoplasm (*), 20000×. (m) HFD + tap water-given group. Severe degeneration in tight junctions (arrowheads), microvillar epithelium (arrow) with cytoplasm (*), 20000×. (n) HFD + ABX group. Severe dilatations of intercellular junctions (*), vacuolisation in cytoplasm (arrow), n: nucleus, 10000×. (o) HFD + melatonin group. Reduced reduction of tight junctions (arrowheads) and ongoing vacuolisation in cytoplasm (*), epithelium (arrow), n: nucleus, 15000×. (p) HFD + ABX + melatonin group. Regular intercellular junctions (arrowheads), vacuoles in the cytoplasm (*), epithelium (arrow), n: nucleus, goblet cell (g), mast cell (m), 6000×.
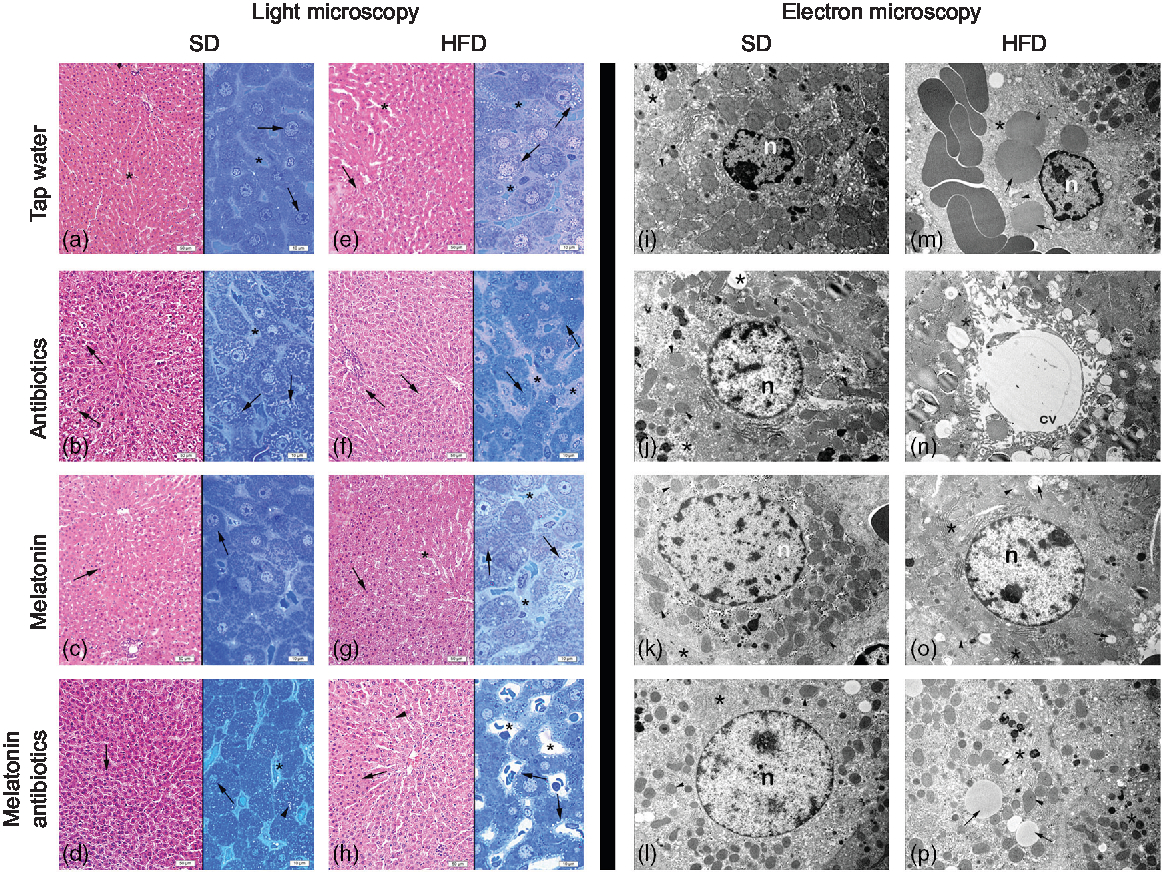
Fig. 8. Photomicrographs of liver tissues. (a) Standard diet (SD) + water group, and (c) SD + melatonin group. Regular hepatocytes (arrows) and sinusoids (*). (b) SD + antibiotics (ABX) group. Vacuolisation in the hepatocyte cytoplasm (arrows), sinusoids (*). (d) SD + antibiotics + melatonin group. Reduced vacuolisation (arrowhead) in hepatocytes (arrows), sinusoids (*). (e) High-fat diet (HFD) + water group. Severe vacuolisation in hepatocytes (arrows), dilation in sinusoids (*). (f) HFD + ABX group. Vacuolisation in hepatocytes (arrows), sinusoidal dilation (*). (g) HFD + melatonin group. A moderate reduction of vacuolisation (arrows) dilation of sinusoids (*). (h) HFD + ABX + melatonin group. Pericytoplasmic vacuolisation in hepatocytes (arrows), sinusoids (*). Transmission electron microscope photomicrographs of liver tissues. (i) SD + water group, and (k) SD + melatonin group. Regular morphology with hepatocyte cytoplasm (*) and mitochondria (arrowheads), n: nucleus, 7500× and 10000×. (j) SD + ABX group. Vacuolisation in the cytoplasm (*), and intact mitochondria (arrow), 10000×. (l) SD + ABX + melatonin group. Reduced vacuolisation (*) and intact mitochondria (arrow), n: nucleus, 10000×. (m) HFD + water group. Besides heavy lipid droplets (arrows) cytoplasmic (*) and mitochondrial degeneration (arrowhead), n: nucleus, 7500×. (n) HFD + ABX group. Heavy vacuolisation (*) and accumulation of membranous structures in the periphery of hepatocyte cytoplasm (arrowheads), central vein (cv), 10000×. (o) HFD + melatonin group. Reduced concentration and volume of lipid droplets and vacuoles (arrows), mitochondria (arrowhead) activation or rough endoplasmic reticulum (RER) in the cytoplasm (*), n: nucleus, 10000×. (p) HFD + ABX + melatonin group. Reduced concentration of vacuoles and lipid droplets (arrows) and regenerated cytoplasm with RER activation (*), mitochondria (arrowheads), 7500×.
In HFD-fed rats, moderate-to-severe hypertrophy of both goblet and glandular cells along with leucocyte accumulation in the lamina propria was microscopically evident (Fig. 7), and severe vacuolisation of hepatocyte cytoplasm (Fig. 8) was observed. In transmission electron microscope analysis of the HFD-fed group, dilatation in epithelial tight junctions, accumulated membranous structures in hepatocyte cytoplasm with heavy lipid droplets, and increased activation of endoplasmic reticulum were observed. Addition of melatonin to HFD consumption reduced infiltration of leucocytes, hypertrophy of goblet cells and dilatation of epithelial tight junctions in the ileal sections, while cytoplasmic vacuolisation and cytoplasmic degeneration of hepatocytes were also diminished. When ABX mixture was given in HFD-fed rats, oedema in lamina propria, degeneration in the glandular epithelium with extrusion of goblet cells, severe intercellular dilatations of junctions and vacuolisation were observed. In the ABX-treated HFD group, hepatic injury was overall worsened, and hepatocytic vacuolisation and sinusoidal dilation were evident. The addition of melatonin to ABX cocktail reduced sinusoidal dilation, and accumulation of lipid droplets reduced hypertrophy of goblet cells and intercellular dilatations, but oedema in lamina propria was still sustained.
Discussion
HFD feeding for a 2-week period caused hyperglycaemia, increased prerenal fat and hepatic weight, while a low level of hepatic and intestinal inflammation, accompanied with disruption of epithelial tight junctions and an enhanced growth of colonic bacteria, was observed without any discrimination among the studied phyla. In addition, feeding with HFD delayed intestinal transit, caused morphologic disorganisation in the intestines and liver and increased hepatic GSH content. Although administration of an ABX cocktail for 2 weeks to the rats on a SD inhibited the growth of caecal bacteria (specifically, the Clostridiales phylum), it also resulted in hyperglycaemia, lipid accumulation and disorganisation in the intestines and liver, and a delayed intestinal transit, which was accompanied by an elevated serum alanine transaminase level and an increased hepatic but a depleted intestinal GSH content. Despite that intake of ABX in HFD-fed rats abolished increases in fat accumulation, liver weight and blood glucose, TAG were elevated. ABX suppressed HFD-induced overgrowth in colonic bacteria, reversed HFD-induced delay in intestinal transit and reduced the oxidative injury of ileum. On the other hand, ABX in HFD-fed rats increased neutrophil accumulation to liver, which was accompanied by enhanced hepatic injury and dysfunction. In SD-fed rats, melatonin caused no changes in the intestinal or hepatic parameters but increased total bacterial count in the caecum without any preferences in the studied bacterial phyla. Addition of melatonin to the intake of ABX reduced hepatic and intestinal disorganisation, decreased colonic motility and depressed neutrophil recruitment to the intestines, while in HFD-fed rats, melatonin reduced ileal inflammation, colonic motility and perirenal fat accumulation.
In accordance with the categorisation of obesity and obesity-related phenotypes such as ‘low-grade’ chronic inflammation(Reference Hotamisligil55), there is also substantial evidence to verify the association between HFD consumption and gastrointestinal inflammation(Reference Cani, Rodrigo and Knauf21). Obesity is well known to involve increased generation of ROM, including the mitochondrial respiratory chain and nicotinamide adenine dinucleotide phosphate oxidase systems(Reference Hulsmans, Van Dooren and Holvoet56). In a previous study conducted in mice fed with HFD for 8–12 weeks, it was shown that this prolonged intake of the obesogenic diet induced colonic inflammation, impaired gut barrier function along with an altered profile of faecal microbiota, while the other fat depots have showed no signs of inflammation, emphasising that gut dysfunction is the major component of HFD-induced metabolic alterations(Reference Lam, Ha and Campbell57). Similarly, following HFD consumption for 12 weeks, intestinal inflammation was verified by increased MPO activity in the ileum of the rats(Reference de La Serre, Ellis and Lee58), along with increased expression of the pro-inflammatory cytokines in the ileum(Reference Ding, Chi and Scull59). In obese rats, which were fed with HFD for 8 weeks and induced with experimental colitis, healing of colonic inflammation was delayed as compared to rats that have consumed normal or low fat(Reference Bilski, Mazur-Bialy and Brzozowski60). Similarly, feeding mice with a high-fructose diet has also increased postprandial recruitment of neutrophils to liver, which was accompanied with elevated hepatic cytokine concentration(Reference Rodrigues, do Carmo Henriques and Oliveira61), suggesting an enhanced pro-inflammatory state in the liver due to ingestion of a fructose meal. Our results demonstrate that consumption of a diet rich in fats for only 2 weeks, which did not have a significant effect on body weight, increased adiposity and liver weight, and resulted in increased generation of ROM in the liver and intestines along with the microscopic evidence of hepatic and ileal inflammation. It was already shown that only a 1-week HFD ingestion has resulted in an acute and reversible increase in paracellular permeability in the small intestine, which was accompanied by decreased expression of the anti-inflammatory cytokine IL-10, suggesting that initial impairments in the gut permeability could be responsible for the development of obesity and related metabolic dysfunctions(Reference Hamilton, Boudry and Lemay62). In a recent report, HFD feeding for 2 weeks in mice was shown to enhance hepatic fat accumulation by stimulating hepatic lipogenesis and suppressing hepatic lipolysis(Reference Yoshimura, Nakashima and Tomiga63). Thus, taken together with the aforementioned studies, the present results suggest that shifting the diet to a fat-rich composition for even a short period of time results in hepatic and intestinal inflammation, alters the intestinal permeability and hepatic enzyme activity, and initiates the metabolic disturbances that predispose to obesity.
The composition of the gut microbiota significantly differs between the lean individuals and obese patients(Reference Ley, Turnbaugh and Klein15), as well as between normal-diet- and HFD-fed mice(Reference Cani, Rodrigo and Knauf21, Reference Cani, Delzenne and Amar64, Reference Turnbaugh, Bäckhed and Fulton65). On the other hand, in germ-free mice, no metabolic effects were observed by consumption of HFD, verifying the regulatory role of the intestinal microbiota on body weight and adiposity(Reference Bäckhed, Manchester and Semenkovich66). Despite that intestinal microbiota, by upregulating the expression of nutrient transporters and by modifying lipid metabolism, is known to be closely associated with the development of obesity, how interventions in the diet could modulate the composition of gut microbiota to be beneficial or harmful is not clear yet(Reference Woting and Blaut67). Hamilton et al. (Reference Hamilton, Boudry and Lemay62) have indicated that transcellular flux in the large intestines and the abundance of Bacteroidales demonstrate a positive correlation, and this association was suggested to be an indicator of the onset of the obesity. Based on the differential expressions of the metabolic genes in germ-free and conventionally raised mice, Mardinoglu et al. (Reference Mardinoglu, Shoaie and Bergentall68) have indicated that gut microbiota significantly influences lipid and amino acid metabolism of the host and regulates GSH metabolism, suggesting that the modification of the host oxidant–antioxidant status by gut microbiota could be the key regulator in the development of HFD-induced inflammation. Our findings show that HFD-induced increase in the colonic bacteria, including similar increases in Enterobacteriales, Clostridiales and Bacteroidales phyla, was accompanied by dilated intestinal tight junctions, an enhanced generation of hepatic and intestinal ROM and an augmented hepatic GSH content. Similarly, in mice fed with HFD for 12 weeks, microbiota analysis has revealed increases in Proteobacteria (which includes Enterobacteriales) and Firmicutes phyla (which includes Clostridiales), but a concomitant reduction in the Bacteriodetes phylum was observed(Reference Hildebrandt, Hoffmann and Sherrill-Mix17, Reference Zhang, Zhang and Pang69). However, when a more detailed analysis was made, it was shown that the classes in the Bacteriodetes phylum have responded differently to HFD and significant increases in some classes including Bacteroides, Barnesiella and Alistipes were observed. Thus, our results confirm that including the Bacteroidetes phylum, which also consists of pathogenic genera(Reference Wexler70), all three studied phyla were excessively stimulated by only a 2-week HFD intake. It was previously shown that changing the diet to a high-fat, high-sugar Western diet for just a single day could alter the composition of intestinal microbiota of mice and humans(Reference Turnbaugh, Ridaura and Faith71).
HFD-induced obesity was shown to be associated with a disturbance in circadian rhythm(Reference Honma, Hikosaka and Mochizuki72, Reference Kohsaka, Laposky and Ramsey73), suggesting that HFD-related metabolic dysfunctions could involve disrupted melatonin secretion. When melatonin was administered to HFD-fed rats(Reference Trufakin, Shurlygina and Dushkin74) or to the aged rats, which are expected to have reduced levels of endogenous melatonin(Reference Wolden-Hanson, Mitton and McCants37), increased body weight, intra-abdominal adiposity and metabolic disturbances were all reversed within 3 months. Moreover, melatonin was reported to induce weight loss by the browning of white adipose tissue in diabetic obese rats(Reference Jiménez-Aranda, Fernández-Vázquez and Campos75). Chronic (4 months) or short-term (3 weeks) treatment with melatonin in obese rats was shown to prevent metabolic abnormalities and protect against cardiac ischaemia–reperfusion injury(Reference Nduhirabandi, Du Toit and Blackhurst36, Reference Nduhirabandi, Huisamen and Strijdom76). Similarly, non-alcoholic fatty liver disease and associated oxidative injury of the liver were attenuated by melatonin treatment(Reference Hatzis, Ziakas and Kavantzas39, Reference Hermoso, Shimada and Gilglioni42). Our data also revealed that melatonin prevented intra-abdominal obesity and reduced intestinal inflammation in HFD-fed rats. Apart from its radical scavenging actions, which make melatonin a candidate as a therapeutic agent or a food supplement in ameliorating the injurious effects of obesity-related disturbances(Reference Navarro-Alarcón, Ruiz-Ojeda and Blanca-Herrera35, Reference Nduhirabandi, du Toit and Lochner77), it may also be postulated to have a modulatory role in the distribution of gut microbiome constituents; because disruption of the circadian clock was shown to affect the dynamics of the intestinal microbiota(Reference Voigt, Forsyth and Green78). Accordingly, HFD-induced dysbiosis in mice was reversed by melatonin with a reduction in the Firmicutes to Bacteroidetes ratio(Reference Xu, Wang and Hong43). Despite the stimulatory effect of melatonin on the gut bacterial populations of the SD-fed rats, our findings also demonstrate that increased count of gut bacteria in HFD-fed rats was suppressed by melatonin. However, the inhibitory effect of melatonin was observed only in the Bacteriodales class. These data show that melatonin inhibited the HFD-induced overgrowth of gut bacteria and alleviated hepatic and intestinal inflammation.
In obese individuals, an enhanced upper intestinal motility, but a delayed distal small intestine and colonic motility, was observed(Reference Al Mushref and Srinivasan79). Similarly, when obese patients were on a HFD for 2 weeks orocaecal transit time was shorter(Reference Gallagher, Baird and Winter80), total colonic transit time was delayed and they had a higher frequency of constipation(Reference Pecora, Suraci and Antonelli81, Reference vd Baan-Slootweg, Liem and Bekkali82), which may be attributed to retrograde phasic contractions observed after a high-fat meal(Reference Rao, Kavelock and Beaty83). On the other hand, an increased prevalence of diarrhea was also shown in obese patients(Reference Delgado-Aros, Locke and Camilleri84). In our study, intestinal transit, which was delayed following a 2-week HFD intake, was facilitated back to control levels in rats that have taken ABX along with HFD, implicating the inhibitory role of HFD-induced intestinal inflammation. However, melatonin treatment further enhanced the delays in intestinal and colonic motility of rats fed with HFD. On the other hand, when the rats were on a SD, both ABX and melatonin had similar inhibitory effects on gut motility. These controversial results on motility may be associated with the impact of bacterial products on gastrointestinal motility, which require further investigation.
The perturbations in gut microbiota and antibiotics-induced dysbiosis are well known to be involved in the development of obesity(Reference Million, Lagier and Yahav85, Reference Murphy, Clarke and Marques86), and thereby research has been accumulated on the use of probiotics to prevent obesity(Reference An, Park and Lee87–Reference Yin, Yu and Fu89). The results of our study demonstrate that shifting the diet to a fat-rich composition for only a 2-week period initiates hepato-intestinal inflammation with increased generation of ROM, disrupted epithelial tight junctions, which are accompanied by bacterial overgrowth and delayed intestinal motility. Since acute hepatic inflammation and metabolic disturbances due to HFD intake were aggravated by antibiotic intake, it may be suggested that co-intake of antibiotic and HFD should be avoided.
Acknowledgements
The authors are grateful to Professor Goncagül Haklar for her guidance in measuring the metabolic parameters in blood samples.
This work was partly supported by a grant from the Scientific and Technological Research Council of Turkey (TUBITAK – programme code: 2209, project no: 1919B011601567) and Marmara University Research Fund travel grant (SAG-D-120417-0160). It was partially presented at the ‘Joint Meeting of the American Physiological Society and The Physiological Society’ (2016) and ‘Digestive Disease Week’ (2017).
A. Y., S. A. T., E. A. and B. Ç. Y. conceived of the study and designed the study; A. Y., S. A. T., D. S., F. B., M. M. K., N. D. O., Y. B. C., O. T. C. K., B. A. and B. Ç. Y. acquired the data; A. Y., S. A. T., D. S., F. B., M. M. K., N. D. O., Y. B. C., O. T. C. K., B. A., E. A., M. Y., Ş. Ç. and B. Ç. Y. analysed and interpreted the data; A. Y., S. A. T., D. S., F. B., M. M. K., N. D. O., Y. B. C., O. T. C. K., B. A., E. A., M. Y., Ş. Ç. and B. Ç. Y. drafted the manuscript; A. Y., S. A. T. and B. Ç. Y. critically revised the paper.
The authors have no conflicts of interest to declare.


