The most well-known source of vitamin D is through skin synthesis induced by sun exposure. Studies from Northern Europe have highlighted a marked seasonal fluctuation in serum 25-hydroxyvitamin D (25(OH)D) concentrations among adults and newborns, with values being lowest in late winter and spring, because of less UV and skin-mediated vitamin D synthesis during these seasons( Reference Bodnar, Simhan and Powers 1 ).
During gestation, the vitamin D stores of the fetus depend entirely on those of its mother( Reference Mcaree, Jacobs and Manickavasagar 2 ), and newborns’ 25(OH)D concentrations are correlated with their mothers’( Reference Streym, Moller and Rejnmark 3 ). Vitamin D insufficiency (25(OH)D <50 nmol/l) and deficiency (25(OH)D <25 nmol/l) are common among otherwise healthy pregnant women, especially in high-latitude countries such as Denmark (56° North) where UV radiation (UVR) from the sun (and thus vitamin D synthesis) is insufficient to produce vitamin D from October to March( Reference Andersen, Brot and Jakobsen 4 – Reference Holick 7 ). It has been estimated that 16–31 % of Danish women suffer from vitamin D insufficiency in early pregnancy, of which 3·5–6·3 % are vitamin D deficient( Reference Streym, Moller and Rejnmark 3 , Reference Milman, Hvas and Bergholt 8 – Reference Petersen, Olsen and Mølgaard 10 ). Vitamin D insufficiency and deficiency during pregnancy have been linked to many pregnancy-related health complications and may also impair offspring health( Reference Karras, Fakhoury and Muscogiuri 11 ). The most evident poor health outcome related to low vitamin D during fetal development and early life is the development of infancy and childhood rickets( Reference Sahay and Sahay 12 ). Apart from its role in Ca and phosphate homoeostasis and bone mineralisation( Reference Norman 13 ), vitamin D also has extra-skeletal functions such as regulation of hormone secretion, immune function and cellular proliferation and differentiation( Reference Yang, Ma and Zhang 14 , Reference Bikle 15 ). Exposure to low vitamin D in utero may therefore predispose to a range of adverse health outcomes throughout life( Reference Hyppönen, Läärä and Reunanen 16 ).
The use of a proxy model may be of value when vitamin D measurements are lacking and thus need to be estimated. Environmental factors such as sunshine hours, temperature and UVR might explain seasonal fluctuations in vitamin D concentrations, but few studies have investigated the influence of these environmental factors during pregnancy on neonatal vitamin D concentrations. Most of these studies concerned season of birth in relation to cord blood measures of vitamin D( Reference Vinkhuyzen, Eyles and Burne 17 , Reference Basile, Taylor and Wagner 18 ). In addition, some studies have used self-reported maternal intake of 25(OH)D or UVR exposure during pregnancy( Reference Petersen, Strøm and Maslova 19 – Reference Krieger, Cabaset and Canonica 21 ) as well as season of birth as proxies of maternal or offspring 25(OH)D status in relation to the development of diseases in infancy and adulthood( Reference Jensen, Zimmermann and Gamborg 22 – Reference Vassallo, Banerji and Rudders 24 ). However, currently there is poor understanding regarding the environmental factors or individual (maternal and offspring) characteristics that best contribute to determine neonatal 25(OH)D concentrations. Previous studies describing the determinants of neonatal 25(OH)D were based on either relative small samples <300 individuals or used cord blood 25(OH)D concentration( Reference Krieger, Cabaset and Canonica 21 , Reference Smith, Sun and Pezic 25 – Reference Kelishadi, Sharifi-Ghazvini and Poursafa 30 ). Only one previous study used 25(OH)D from dried blood spots (DBS) obtained from 259 children( Reference Smith, Sun and Pezic 25 ). Hence, there is a need for large cohort studies based on representative samples of the population using objective measurements of neonatal 25(OH)D. Furthermore, no previous studies have included measured bright sunshine hours and temperature as environmental proxies of 25(OH)D status among neonates. In Denmark, a relative low temperature might further prevent individuals from exposing their skin to the sun even when there is a high UV index and bright sunshine. Therefore, we hypothesised that UVR would be the main predictor of the neonatal 25-hydroxyvitamin D3 (25(OH)D3) variation and that temperature would be an additional important environmental determinant. We hypothesised that bright sunshine hours would be highly correlated to UVR and therefore be a minor additional environmental predictor. We also hypothesised that adding individual maternal and offspring characteristics would further improve the proxy model.
Therefore, using DBS from a large sample of Danish newborns, the aims of this study were to (1) identify environmental and individual determinants of 25(OH)D concentrations in newborns and (2) investigate whether these environmental factors and individual characteristics combined could be used as proxy measures for neonatal 25(OH)D concentrations.
Methods
25(OH)D3 was measured from neonatal DBS from a random sub-sample of the Danish population of 2873 individuals, born between 1 May 1981 and 31 December 2002, retrieved from the Biological Specimen Bank for Neonatal Screening (BSBNS)-Statens Serum Institute (SSI) in Denmark. Inclusion criteria were children born in Denmark, being alive 1 week after birth, and who had sufficient biological material from the DBS for the vitamin D analyses. Individuals were identified through the Danish Civil Registration system. No restriction on type of birth (multiple births) or gestational age was applied.
As part of a national routine screening programme for congenital disorders among neonates in Denmark, a heel prick is taken within 5–7 d after birth (until 2009 and within 48–72 h after birth thereafter). The blood samples were collected on filter paper and subsequently stored at –20°C in a locked freezer at SSI( Reference Nørgaard-Pedersen and Hougaard 31 ). To assess the 25(OH)D status, one 3·2 mm punch was taken halfway from the centre of the blood spot. A modified version of Eyles and colleagues’ method( Reference Eyles, Anderson and Ko 32 ) of the highly sensitive liquid chromatography tandem MS method (LC–MS/MS) was used to measure the concentration of 25(OH)D. It has previously been reported that 25(OH)D measurements from archived DBS are highly correlated with cord blood among neonates as well as with sera or plasma in adults( Reference Eyles, Morley and Anderson 33 , Reference Heath, Williamson and Ebeling 34 ). Sample degradation occurring during 13–34 years storage time is unlikely, as studies have shown that, regardless of temperature and light exposure, storage times of 25(OH)D for up to 40 years do not bias inter-individual variation in concentrations for a given birth cohort( Reference Eyles, Anderson and Ko 32 , Reference Bodnar, Catov and Wisner 35 ). Natural dietary sources of 25(OH)D2 are scarce and, in Denmark, vitamin D supplements come in the form of 25(OH)D3. Accordingly, more than 90 % of 25(OH)D2 measured in the DBS were below the detection limit of 3 nmol/l and were therefore excluded from these analyses. All measured concentration levels for intra-assay and inter-assay analyses had acceptable precision, as the variability coefficient for intra-assay and inter-assay variation for 25(OH)D3 ranged 7–12 and 7–20 %, respectively. There was no exclusion of the results based on the detection limit for 25(OH)D3, which was 4 nmol/l. The concentration of 25(OH)D3 is reported in nmol/l and the following formula, which takes into account the neonatal haematocrit fraction for capillary blood, was used to approximate the sera values: serum (25(OH)D3) nmol/l=DBS (25(OH)D3) nmol/l×1/(1–0·61 (the Hct fraction))( Reference Eyles, Anderson and Ko 32 , Reference Kayiran, Ozbek and Turan 36 ). The SSI laboratory participates in the vitamin D external quality assessment scheme with the equivalent-serum method( Reference Carter, Berry and Durazo-Arvizu 37 ).
Monthly aggregated data on daily number of bright sunshine hours recorded by Campbell–Stoke sunshine recorders( 38 ), average temperature recorded from thermometers placed 2 m above ground level in a ventilated screen or in a thermometer cabin( 39 ), and UVR recorded from Brewer spectrophotometer( Reference Eriksen, Jepsen and Jønch-Sørensen 40 ), available since 1993, were retrieved from the Danish Meteorological Institute( 39 ). The standard erythemal dose (SED, J/m2) was used as the UVR unit. SED is a weighted measure of ambient UVR using an erythemal response function to give biologically effective UVR and is independent of skin tone( Reference Lucas and Prüss-Üstün 41 ). Temperature was measured in °C.
Maternal characteristics age at delivery, education level, parity and smoking status during pregnancy; and offspring characteristics birth date, birth weight, gestational age at birth and sex were obtained from the Danish Medical Birth Register (DMBR)( Reference Bliddal, Broe and Pottegård 42 ) via Statistics Denmark.
From 1991, binary (smokers or non-smokers) categorisation of maternal smoking status during pregnancy was started from manually collected data. Electronic data collection started in 1997 and further categories were added as follows: unknown, mother not smoking, mother smokes, mother stopped smoking in the first trimester, mother stopped smoking after the first trimester, mother smoked up to 5, 6–10, 11–20 or >20 cigarettes/d. Combining this information, maternal smoking was dichotomised into ever smoking (women who ever smoked during their pregnancy) v. never smoking (women who did not smoke during their pregnancy) or unknown. Ethnicity was defined based on the mother’s place of birth and was dichotomised into European and non-European origin. Hence, children with fathers with non-European origin were considered European if mothers were of European origin. Maternal education was categorised into school, high school and university as the highest education achievement level. Parity was dichotomised into primiparous and multiparous. Estimation of parity was based on summarised estimates of total births and the actual birth, as the DMBR only included information on live and still births before 1996. Maternal age at time of delivery was categorised as follows: <20, 20–24·9, 25–29·9, 30–34·9, 35–39·9 and >40. Season of birth was defined based on the seasonal variation in serum 25(OH)D concentration among individuals from countries in northern latitudes( Reference Godang, Froslie and Henriksen 43 , Reference Hyppönen and Power 44 ): winter – born between November and January; spring – born between February and April; summer – born between May and July; autumn – born between August and October. Year of birth included 1993–2002. Gestational age at birth was based on gestational weeks (37–44 weeks). Birth weight in grams was used and categorised as follows: <2500, 2500–4000 and >4000.
Ethics
The Danish National Committee on Biomedical Research Ethics and Steering committee of the BSBNS granted permissions to access and analyse the DBS samples from the BSBNS (J. no. H-3-2011-126). Permission from the Danish Data Protection Agency was granted to merge biobank information with the other individual-level information from the Danish Administrative registers. (J. no. 2012-41-116).
Statistical methods
Forward selection of covariates based on the mean squared error (MSE) and subsequent cross-validation (CV) was used to determine the best predictive model based on the available data. Hence, each covariate was included by forward selection and at each selection step the covariate giving the highest reduction in the MSE of the previous model was included. The models resulting from the forward selection process were compared by estimating their out-of-sample performance using ten rounds of 5-fold CV for each model, and the model with the lowest CV error was chosen as the final model( 45 ).
The base model was a linear mixed model, with partition of the residual variance into a between-group component (GC) and a within-GC, with individuals grouped by year of birth and in the month before the month of birth. UVR in the month before the month of birth was used in this study as the half-life of 25(OH)D during pregnancy is around 21 d( Reference Jones, Assar and Prentice 46 ). To allow for a possible non-linear relationship between SED and 25(OH)D3, the forward selection algorithm had both a linear model and a restricted cubic spline model, with a single knot at the median value of UVR (210 SED) among the candidate models.
As 25(OH)D3 standard deviations increased proportionally with the mean (online Supplementary Fig. S1a and b), a generalised linear model with γ distribution (where standard deviations are proportional to the mean) was used as sensitivity analysis.
We used R version 3.5.0( 47 ). To generate the descriptive tables, we used the ‘Hmisc’ package( 48 ); and to fit the mixed models, we used the ‘lme4’ package( Reference Bates, Mächler and Bolker 49 ).
Results
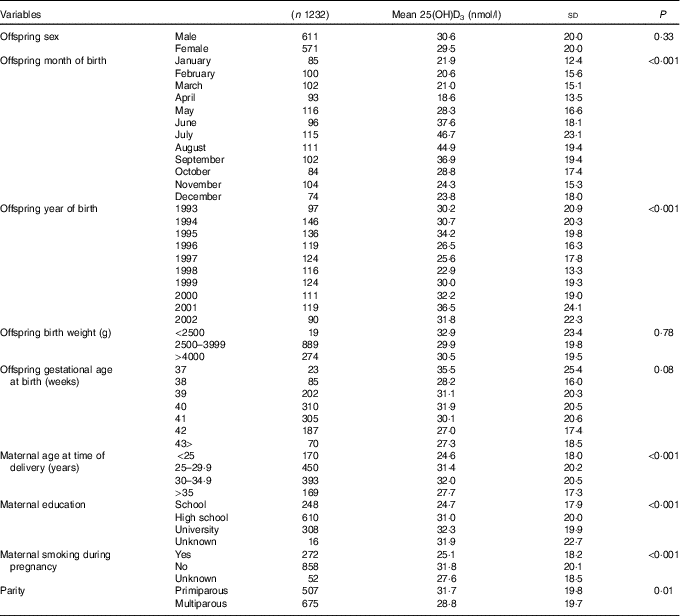
UVR data were available from February 1993 only, therefore the sample was reduced from 2873 individuals to 1387 individuals born between February 1993 and December 2002. Individuals born preterm (<37 gestational weeks) were further excluded as preterm births might be due to underlying causes that may influence maternal and fetal pregnancy outcomes and vitamin D concentrations (n 50) (Fig. 1). In addition, no seasonal pattern could be seen among neonates of non-European origin (defined according to maternal place of birth in the DMBR), therefore they were excluded from the analyses (n 139) (Fig. 1). After further exclusion of sixteen individuals with missing information on some of the covariates, a total of 1182 individuals were included in the analyses (Fig. 1). The mean 25(OH)D3 concentration was 30·1 (sd 19·8) nmol/l and median 25·6 (range 0·5–110) nmol/l when corrected for the haematocrit fraction. Maternal and offspring characteristics are presented in Table 1.
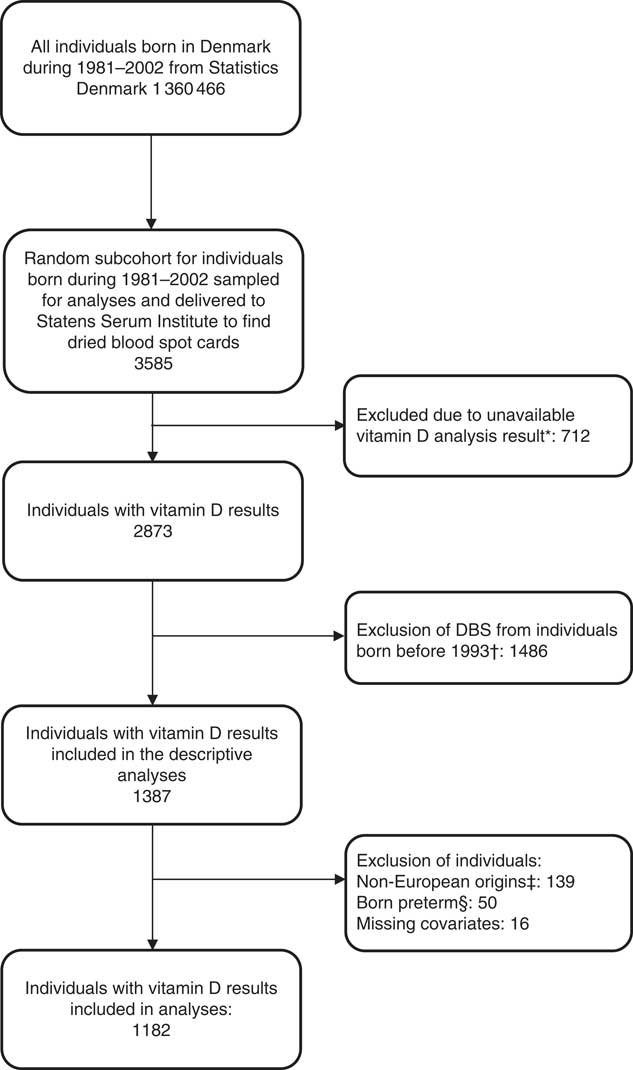
Fig. 1 Flow chart of study population. * Dried blood spot (DBS) cards were either not found, there was insufficient material for analysis or the analysis failed. † UV radiation data were available from February 1993 from the Danish Meteorological Institute. ‡ No seasonal pattern could be seen among offspring of non-European individuals. § Individuals born preterm (<37 gestational weeks) were excluded as preterm births might be due to underlying causes that may influence maternal and fetal pregnancy outcomes and vitamin D concentrations.
Table 1 Maternal and offspring characteristics
25(OH)D3, 25-hydroxyvitamin D3.
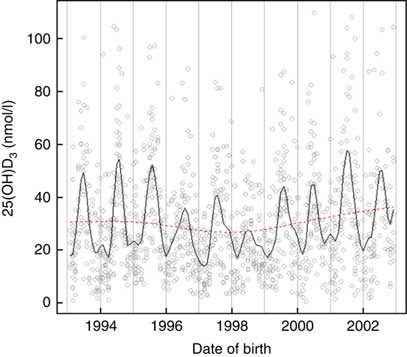
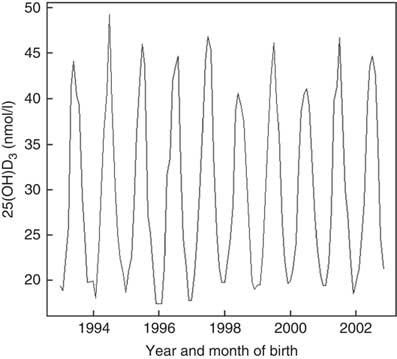
Vitamin D concentrations were higher among individuals born in summer and autumn and lower in winter and spring months P<0·001 (Fig. 2). Month of birth explained 24 % of neonatal 25(OH)D3. The greatest correlation was between UVR and sunshine hours (r 0·93), followed by UVR and temperature (r 0·86) and sunshine hours and temperature (r 0·80).
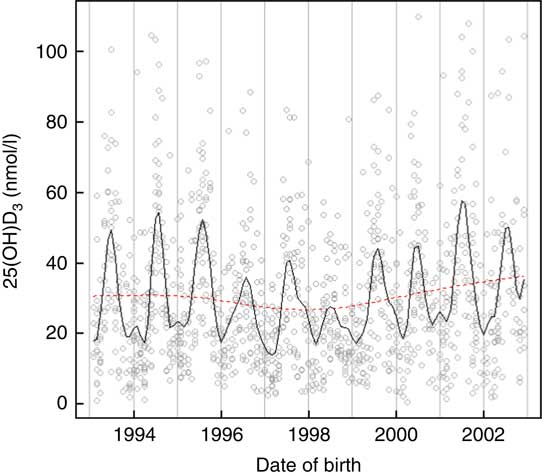
Fig. 2 Neonatal 25-hydroxyvitamin D3 (25(OH)D3) variations by month and year of birth among a random sample of infants born between 1993 and 2002 in Denmark.
Assessment of the fitted spline (Fig. 3) showed that association between UVR and 25(OH)D3 was not linear and suggested a continuous increase in neonatal 25(OH)D3 with increased UVR.
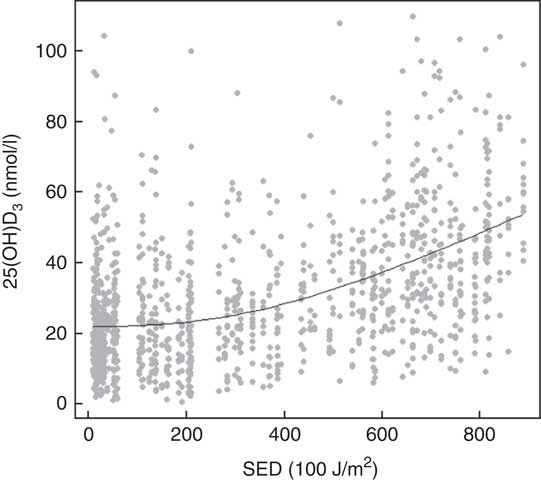
Fig. 3 UV radiation (standard erythemal dose (SED, J/m2)) and neonatal 25-hydroxyvitamin D3 (25(OH)D3) among a random sample of infants born between 1993 and 2002 in Denmark.
Based on the available data and according to re-sampling method for model selection, the preferred model to predict 25(OH)D3 concentrations from neonatal DBS was the one including the group-level variables UVR (as a cubic spline) and temperature, together with the following individual-level variables: maternal education, maternal smoking during pregnancy, gestational age at birth and parity. This model explained 30 % of the variation of 25(OH)D3 in the neonatal DBS with ambient UVR in the month before the month of birth, accounting for 24·5 % of the neonatal 25(OH)D3 variance (Tables 2, 3 and Fig. 4).
Table 2 Prediction model selectionFootnote *
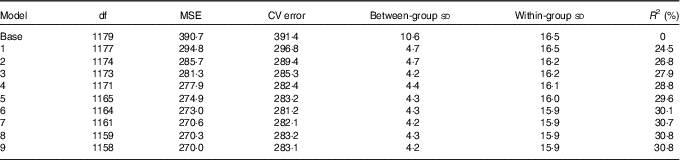
MSE, mean square error; CV, cross-validation; R 2, explained variation without conditioning on group level parameters.
* Base model by year of birth and in the month before the month of birth; model 1: model 0+UVR; model 2: model 1+education; model 3: model 2+temperature; model 4: model 3+maternal smoking during pregnancy; model 5: model 4+gestational age at birth; model 6: model 5+parity; model 7: model 6+maternal age at delivery; model 8: model 7+birth weight; model 9: model 8+sex.
Table 3 Multivariable model of factors predicting 25-hydroxyvitamin D3 (25(OH)D3) (nmol/l) concentration from neonatal dried blood spots
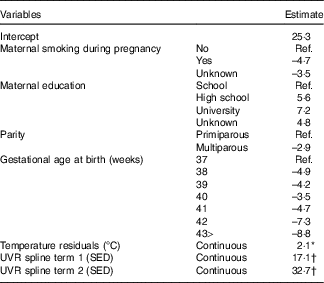
Ref., referent values; UVR, UV radiation; SED, standard erythemal dose.
* Standardised to mean zero and standard deviation one: one standard deviation= 3·1°C.
† The spline basis was bases on SED values standardised to mean zero and standard deviation one. One standard deviation=291·4 SED.
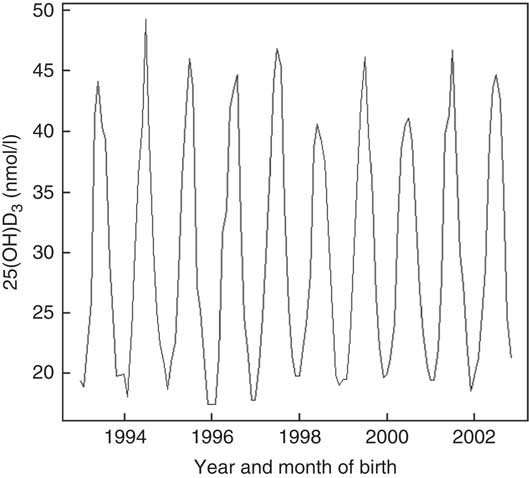
Fig. 4 Prediction of neonatal 25-hydroxyvitamin D3 (25(OH)D3) from the multilevel analysis based on a random sample of infants born between 1993 and 2002 in Denmark.
The model was better at predicting between-group variation of neonatal 25(OH)D3 compared with within-group variation (grouped by year of birth and the month before the month of birth). Group-level determinants, UVR and temperature, explained more than 60 % of the between group-level variation (standard deviation basal model: 10·6 nmol/l to standard deviation prediction model (model 6): 4·3 nmol/l), while individual-level determinants (maternal education, maternal smoking during pregnancy, gestational age at birth and parity) explained <0·5 %. The within-group variation only reduced by 0·6 % when both group-level and individual-level determinants were included in the model (standard deviation basal model: 16·5 to standard deviation prediction model (model 6): 15·9 nmol/l) (Table 2). As 25(OH)D3 standard deviations increased proportionally with the mean (online Supplementary Fig. S1a and b), this suggests that our prediction model might be better at predicting 25(OH)D3 during winter and spring compared with summer and autumn. However, sensitivity analysis using generalised linear model with γ distribution showed similar results (data not shown).
Discussion
This study examined the environmental and individual predictors of 25(OH)D concentrations measured from neonatal DBS among a representative sample of neonates born in Denmark. Our findings showed as expected a seasonal pattern of vitamin D concentration, with higher values in summer and autumn and lower values in winter and spring. Ambient UVR in the month before the month of birth was the best predictor of neonatal 25(OH)D3, accounting for 24 % of its variance. Neonatal 25(OH)D3 concentration was further determined by other factors such as ambient temperature, maternal education, maternal smoking during pregnancy, gestational age at birth and parity. The final model explained 30 % of neonatal 25(OH)D3 concentration from DBS. The model best predicted between-group (grouped by year of birth and in the month before the month of birth) variation of neonatal 25(OH)D3 compared with within-group variation, and individual-level determinants explained only a small proportion of the between group-level variation. Our findings might be explained by the natural yearly and monthly variation in ambient UVR and temperature. Furthermore, our findings suggest that the individual-level determinants included in the model might only have a marginal influence on neonatal 25(OH)D3 concentration. Our findings suggest that less than a third of neonatal 25(OH)D3 concentration could be predicted by our model. Hence, this model might prove useful in cohort studies assessing the association between neonatal vitamin D and disease outcomes for ranking individuals in groups according to 25(OH)D3 status. However, it cannot substitute actual blood measurements as a tool for evaluating individual vitamin D status, as only a proportion of the variation in 25(OH)D3 could be appraised( Reference Bjørn Jensen, Thorne-Lyman and Vadgård Hansen 20 ).
Previous prediction models of maternal or neonatal 25(OH)D concentrations found higher prediction than ours, explaining between 40( Reference Bjørn Jensen, Thorne-Lyman and Vadgård Hansen 20 ) and 43 %( Reference Smith, Sun and Pezic 25 ) of the total 25(OH)D variance. This difference might relate to the different variables included in the prediction models, distinct study population characteristics, differences in sample sizes and potentially different analytical methods used.
The strengths of the present study include the large sample of individuals randomly selected among the entire Danish population and measurements of neonatal biological 25(OH)D3 from DBS as well as the use of the high-quality register data from the DMBR. The use of the resampling method with MSE and CV guaranteed, to some degree, that the best model could be selected preventing overfitting. Furthermore, 25(OH)D3 concentrations were measured using the validated modified version of Eyles and colleagues’ method( Reference Eyles, Anderson and Ko 32 ) of the highly sensitive LC–MS/MS.
The study also has limitations. Data on sunshine hours, temperature and UVR in the month before the month of birth obtained from the DMI were group-level determinants aggregated monthly; therefore, within-month variation including inter- and intra-individual exposure variations could not be assessed. Furthermore, pure UVB measurements, which are responsible for vitamin D skin synthesis, were only available from 2015. Therefore, it was only possible to include UVR in our model. However, as UVR measurements correlate very closely to vitamin D synthesis, it is not expected that the use of UVB instead of UVR would have greatly influenced our predictive model( Reference Eriksen 50 ).
It has been reported that breastfed infants are at an increased risk of vitamin D deficiency compared with formula-fed infants( Reference Gordon, Feldman and Sinclair 51 ). As DBS were collected within 7 d after birth, the concentration of 25(OH)D3 between breastfed and formula-fed infants could differ. In the present study, data about breast-feeding were not available; however, in Denmark <5 % of infants are not being breastfed at the time of hospital discharge( Reference Fenger-Grøn, Fenger-Grøn and Blunck 52 ). Therefore, as our sample is representative of the Danish population, we expect similar rates in our cohort. Furthermore, supplementation with vitamin D is first recommended from 2 weeks of age( Reference Klahn 53 ); therefore, 25(OH)D concentration from neonatal DBS is not expected to be affected by supplementation.
Vitamin D dietary intake from supplements and dairy products has previously been identified as a determinant of vitamin D status in pregnant women and neonates( Reference Woolcott, Giguère and Weiler 28 ); therefore, including these variables in the model would potentially have added to the explanation of a bigger proportion of the neonatal 25(OH)D variation. Furthermore, maternal body weight has been identified as a determinant of vitamin D status in pregnant women and neonates in some( Reference Woolcott, Giguère and Weiler 28 ) but not all studies( Reference Bjørn Jensen, Thorne-Lyman and Vadgård Hansen 20 ) (pregnant women only). Therefore, it is unclear whether including this variable would have influenced our prediction model.
The influence on the prediction of factors such as outdoor activity, tanning beds use, sun exposure habits, skin colour, use of sunscreen and clothing habits known to influence maternal vitamin D skin synthesis could not be assessed in this study as such data were not available. Results from two studies from the UK have suggested that fair-skinned individuals need 9 min of daily sunlight at lunchtime from March to September, for 25(OH)D concentrations to remain >25 nmol/l throughout the winter and without causing erythema (sun burnt), while dark-skinned individuals need approximately 25 min( Reference Webb, Kazantzidis and Kift 54 , Reference Webb, Kazantzidis and Kift 55 ). In the study by Smith et al. ( Reference Smith, Sun and Pezic 25 ), maternal clothing and sun exposure habits explained 4 % of neonatal 25(OH)D variance; and in another study, the use of sunscreen and skin pigmentation were described as possible determinants of maternal 25(OH)D deficiency (defined as <50 nmol/l)( Reference Krieger, Cabaset and Canonica 21 ). Therefore, these variables may be expected to explain a small proportion of neonatal 25(OH)D3 concentration and inclusion in our prediction model would have strengthened our model.
A recent genome-wide association study meta-analysis of serum 25(OH)D among European individuals validated three 25(OH)D risk loci (GC, 7-dehydrocholesterol reductase (NADSYN1/DHCR7) and CYP2R1) previously identified, and identified two new loci (Sec23 homolog A, coat protein complex II component and amidohydrolase domain containing 1). The study reported that there was a modest overall heritability in serum 25(OH)D among European individuals due to the common genome-wide SNP of 7·5 %( Reference Jiang, O’Reilly and Aschard 56 ). In the Danish population, the 25(OH)D risk loci in GC and 25-hydroxylase (CYP2R1) were associated with serum 25(OH)D concentrations( Reference Nissen, Rasmussen and Ravn-Haren 57 ); and in Hungary, selected SNP (NADSYN1, DHCR7, GC, CYP2R1 and CYP24A1) accounted for 13·1 % of the variance of total 25(OH)D levels( Reference Szili, Szabó and Horváth 58 ). In Australia, the study by Smith et al. (25) reported that 5·2 % of the predicted variance in neonatal 25(OH)D from DBS could be explained by infant genetic variants GC (rs2282679) and DHCR7 (rs12785878). Therefore, including information on genetic variance would also have most likely improved our model.
Information about maternal smoking status was missing for more than 40 % of individuals and reporting bias may have occurred. Therefore, the true effect of smoking on neonatal 25(OH)D concentration might have been underestimated. However, results from different studies suggest a non-significant inverse association between maternal smoking and maternal and neonatal 25(OH)D concentrations( Reference Krieger, Cabaset and Canonica 21 , Reference Woolcott, Giguère and Weiler 28 , Reference Banihosseini, Baheiraei and Shirzad 59 ). Therefore, maternal smoking during pregnancy might only marginally predict offspring 25(OH)D concentration at birth.
A high correlation (r ≥0·83) between maternal and neonatal vitamin D concentrations has been previously reported, with maternal vitamin D concentration explaining between 69 and 77 % of the neonatal one( Reference Streym, Moller and Rejnmark 3 , Reference Rodda, Benson and Vincent 60 ). Maternal 25(OH)D was not available in this study. However, the environmental factors and individual characteristics (UVR, temperature, parity, gestational age at birth, maternal education and maternal smoking during pregnancy) included in this study can be thought of as both maternal and offspring’s proxies of 25(OH)D concentrations. As our model explained 30 % of neonatal 25(OH)D3 concentration, determinants other than the ones included in our model must play a significant role in both maternal and neonatal 25(OH)D3 concentrations.
Finally, the present results might only be generalised to populations living at high latitudes (56° North) and with fair skin.
Conclusion
Ambient UVR in the month before the month of birth was the best predictor of neonatal 25(OH)D3, accounting for 24 % of its variance. Neonatal 25(OH)D3 concentration was further determined by maternal and offspring characteristics, but the final model explained an additional 6 % of neonatal 25(OH)D3 only, leaving 70 % of the variation to be explained by other genetic and environmental factors and individual characteristics. Hence, although this model cannot substitute actual blood measurements, it might prove useful in cohort studies for ranking individuals in groups according to 25(OH)D3 status.
Acknowledgements
The authors would like to thank Paul Eriksen from the Danish Meteorological Institute for his help in providing relevant documents regarding UVR measurement methods used in Denmark.
The study is a part of the 4-year project ‘D-tect’ funded by the Programme Commission on Health, Food and Welfare under the Danish Council for Strategic research (grant number 0603-00453B). The Danish Diabetes Academy supported by the Novo Nordisk Foundation. The Lundbeck Foundation (grant number R170-2014-643). The funders had no role in study design, data collection and analysis, decision to publish or preparation of the manuscript.
B. L. H., P. F., R. J. and A. K. designed the study and formulated the research question. P. F. performed the statistical analyses. R. J. and M. N. H. provided feedback on the study design. A. K. wrote the manuscript. J. M. and A. S. C. provided interpretation of data and critical revision of the manuscript for important intellectual content.
None of the authors had any conflicts of interest.
Supplementary material
For supplementary material/s referred to in this article, please visit https://doi.org/10.1017/S0007114518003604