


Conjugated linoleic acid (CLA) is the collective term for positional and geometric isomers of octadecadienoic acid (linoleic acid 18 : 2n-6), which contain two conjugated double bonds. The principal dietary sources of CLA are meat and dairy products derived from ruminants. The cis-9, trans-11 isomer of CLA is the most abundant dietary form and is derived from incomplete biohydrogenation of linoleic acid by the micro-organism, Butyrivibrio fibrisolvens, in the rumen(Reference Lawson, Moss and Givens1) or from the activity of Δ9-desaturase on vaccenic acid (VA) in bovine mammary tissue(Reference Griinari, Cori and Lacy2).
CLA has been reported to induce potentially favourable effects on body composition, carcinogenesis, atherogenesis, glucose tolerance and immune function(Reference Park, Albright and Liu3–Reference Ramirez-Santana, Castellote and Castell10). Many of these effects have been observed in animal models and cell cultures, but several human intervention studies have also demonstrated beneficial effects(Reference Riserus, Berglund and Vessby11–Reference Gaullier, Halse and Hoivik15). It is thought that the two CLA isomers that are responsible for such effects are cis-9, trans-11 CLA and trans-10, cis-12 CLA.
Due to the potential health benefits associated with CLA consumption, several studies have been carried out to ascertain the CLA content of foodstuffs using analytical techniques such as silver ion HPLC(Reference Adlof16) and GC(Reference Steinhart, Winkler and Rickert17). Chin et al. (Reference Chin, Liu and Storkson18) used GC to demonstrate that the CLA content of ruminant products ranged from 2·7 mg/g fat in veal to 5·6 mg/g fat in lamb and from 2·9 mg/g fat in Romano cheese to 7·1 mg/g fat in Brick cheese, with cis-9, trans-11 isomer of CLA being the predominant isomer (75–90 %). Considerable differences in CLA content were reported, indicating the possibility of large variations in dietary intake of CLA.
Currently, only limited data are available regarding the intake of CLA in human subjects and there appears to be a significant variation in intakes of CLA in different countries. The estimated daily intake of CLA in Germany was found to be 0·43 g/d for men and 0·35 g/d for women(Reference Fritsche and Steinhart19). However, in the US, the intake was found to be 0·14 g/d for men and 0·05 g/d for women(Reference Ritzenthaler, McGuire and Falen20). This variation in the daily intake of CLA between different countries may be due partly to differences in diet, food processing and cattle-feeding diet regimens(Reference Lawson, Moss and Givens1), and in part due to differences in dietary assessment methods for estimation of food intake (dietary recalls, food frequency, 24-h recall etc). Currently, there are few data available on the CLA isomer content of UK foodstuffs, which means that estimations of UK dietary CLA intakes are difficult to undertake.
The aim of the present study was to estimate the daily intake of cis-9, trans-11 CLA and trans-10, cis-12 CLA in a cohort of eighteen healthy adult subjects using a 7-d weighed food record method. The cis-9, trans-11 CLA and trans-10, cis-12 CLA content of a comprehensive range of ruminant-derived UK foodstuffs was determined using triple-column silver ion HPLC. These data, combined with the information from the weighed intake food diaries, were used to estimate daily intake of the cis-9, trans-11 CLA and trans-10, cis-12 CLA isomers by the cohort. To our knowledge, the present study is the first to provide comprehensive information about dietary CLA intakes in the UK.
Materials and methods
Materials
Chloroform, methanol, potassium methoxide, sodium sulphate (anhydrous), H2SO4, acetonitrile (HPLC grade), hexane (HPLC grade) were purchased from Fisher Scientific UK Ltd (Bishop Meadow Road, Loughborough, Leicestershire, UK). cis-9, trans-11 CLA methyl ester and the trans-10, cis-12 CLA methyl ester standards were purchased from Matreya Inc. (Pleasant Gap, PA, USA). Food items for analysis were purchased from local supermarkets in Nottingham, UK, or from where they were originally obtained if the food had been produced on-site, i.e. restaurants, cafés, bakeries etc.
Subjects and study design
The present study was conducted according to the guidelines laid down in the Declaration of Helsinki, and all procedures involving human subjects were approved by the Faculty of Science and Technology Ethical Committee of the Nottingham Trent University, UK. Written informed consent was obtained from all subjects.
Eighteen healthy subjects were recruited for the present study using advertisements posted on the university email system. Potential subjects were invited to attend a screening session where they completed a medical and dietary questionnaire and signed a consent form. Height (using a stadiometer) and weight (using digital scales) were measured in order to ascertain BMI. Subject selection criteria were: age 21–60 years; satisfactory completion of a health screen questionnaire; individuals being free-living and consuming a ‘European’ diet. Exclusion criteria were: pregnant or breast-feeding women; individuals with metabolic disorders; individuals consuming a weight loss diet; vegans or vegetarians; individuals with special nutritional requirements (e.g. nut allergy and lactose intolerance). Subjects who satisfied the inclusion criteria were asked to record the weight of all the food and drink that they consumed during a 7-d period. To facilitate this, each subject was given an instruction sheet, diary sheets to record weights etc. and calibrated electronic weighing scales accurate to 1 g. For home-made recipes, subjects were asked to provide a copy of the recipe in the food diary, record all the ingredients, the number of servings and the weight of each portion eaten. For meals consumed in restaurants or away from home where the use of scales was impractical, subjects were asked to state restaurant name, list foods and their amounts. Subjects were asked to estimate portion sizes if exact amounts were unknown and list brand name. At the end of the weighed intake period, the food diaries were analysed using dietary analysis software (Microdiet, Downlee Systems Ltd, Chapel-en-le Frith, UK) to estimate the daily intake of macronutrients. For each subject, the mean daily intake of cis-9, trans-11 CLA and trans-10, cis-12 CLA was estimated by determining the content of these isomers in the ruminant-derived foods that were consumed over the weighed intake period.
Extraction of lipids from foodstuffs
Lipids were extracted from selected foodstuffs based on the method of Bligh & Dyer(Reference Bligh and Dyer21). To a homogenising tube containing 0·2 g or 0·2 ml sample, 4 ml methanol and 2 ml chloroform were added and the mixture was homogenised for 2 min. Chloroform (2 ml) was added a second time and the mixture was shaken vigorously for 2 min. Distilled water (3·6 ml) was added and the mixture was vortexed again for 2 min. The mixture was filtered through Whatman no. 1 filter paper. A second extraction was carried out with 3·6 ml of 10 % (v/v) methanol and 0·4 ml chloroform by vortexing for 2 min. The mixture was filtered through Whatman no. 1 filter paper, and the combined filtrate was transferred to a separating funnel and allowed to separate. The lower layer was transferred to a pear-shaped flask (pre-weighed) and the solvent was removed using a rotary evaporator. The residue was dried further at 104°C for 1 h.
Determination of cis-9, trans-11 conjugated linoleic acid and trans-10, cis-12 conjugated linoleic acid content of food items
Fatty acid methyl esters of the food items were prepared by transesterification with potassium methoxide(Reference Fritsche and Steinhart22). The fat sample was dispersed in 15 ml hexane in a Pyrex® tube and 0·5 ml potassium methoxide (5 % w/w in methanol) was then added. The tube was capped tightly, vortexed and heated at 60°C for 15 min in a water-bath. After cooling, 1·5 ml H2SO4 (2 % w/w in distilled water) was added and the tube was vortexed again. The clear organic phase was retained for HPLC separation of the CLA isomers. Three analytical, silver-impregnated HPLC columns (ChromSpher 5 Lipids, 4·6 mm internal diameter × 250 mm stainless steel; 5 μm particle size, Varian Inc., Middelburg, The Netherlands), along with a guard column, were fitted in series and connected to a Beckman System Gold HPLC system. This method was employed as better resolution of the isomer peaks is achieved compared to GC(Reference Fritsche, Fritsche and Solomon23). The HPLC was connected to a Beckman System Gold programmable UV detector module set at a wavelength of 233 nm. The columns were equilibrated with mobile phase (0·1 % acetonitrile in hexane) for 30 min before and after each run at a flow rate of 1 ml/min. After equilibration, the sample was loaded into a 50 μl loop and injected (in triplicate). The System Gold software provided information on the retention times and integrated the peak area after each run.
The cis-9, trans-11 CLA and the trans-10, cis-12 CLA peaks within the food samples were identified on the basis of peak retention times compared to commercial cis-9, trans-11 CLA and trans-10, cis-12 CLA methyl ester standards, which were injected before and after the samples. To calculate the concentrations of these CLA isomers in foodstuffs, standard curves were plotted relating peak area to concentration of isomer using known concentrations of the CLA standards (4-point calibration). The CV for this method was < 1 % and the lower limit of detection was approximately 0·01 mg/g lipid. The concentration of the CLA isomers was expressed in terms of milligrams of the CLA isomer per gram of fat. This was calculated by dividing the total amount of the CLA isomer in the sample by the total extracted lipid yield.
Results and discussion
cis-9, trans-11 and trans-10, cis-12 conjugated linoleic acid concentrations of ruminant derived food items
As cis-9, trans-11 CLA and trans-10, cis-12 CLA are thought to be the biologically active isomers with respect to potential health benefits, the concentrations of these isomers were estimated in various (n 112) UK foodstuffs. The CLA concentrations for selected foodstuffs in different food groups are shown in Tables 1–5. cis-9, trans-11 CLA was the predominant isomer in all of the foodstuffs examined. trans-10, cis-12 CLA concentrations were low or below the threshold of detection of the instrumentation; therefore, the remainder of the discussion will primarily be concerned with the cis-9, trans-11 CLA isomer.
Table 1 cis-9, trans-11 and trans-10, cis-12 conjugated linoleic acid (CLA) concentrations in selected cheese products determined by Ag+ HPLC
(Mean values and standard deviations)
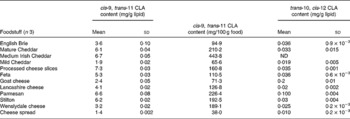
ND, not detected.
Table 2 cis-9, trans-11 and trans-10, cis-12 conjugated linoleic acid (CLA) concentrations in selected butter, margarine and butter substitute spreads determined by Ag+ HPLC
(Mean values and standard deviations)
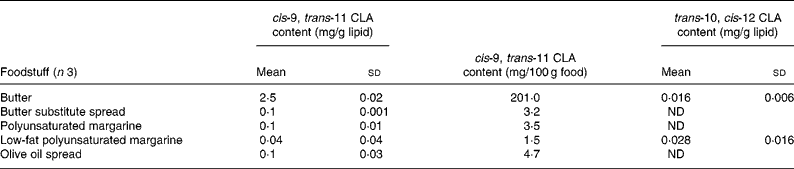
ND, not detected.
Table 3 cis-9, trans-11 and trans-10, cis-12 conjugated linoleic acid (CLA) concentrations in selected milk, cream, yoghurt and ice cream determined by Ag+ HPLC
(Mean values and standard deviations)
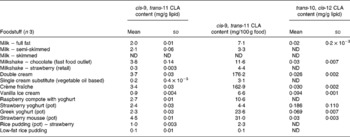
ND, not detected.
Table 4 cis-9, trans-11 and trans-10, cis-12 conjugated linoleic acid (CLA) concentrations in selected meats and meat products determined by Ag+ HPLC
(Mean values and standard deviations)
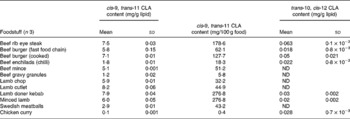
ND, not detected.
Table 5 cis-9, trans-11 and trans-10, cis-12 conjugated linoleic acid (CLA) concentrations in selected sweets, chocolate and cake products determined by Ag+ HPLC
(Mean values and standard deviations)
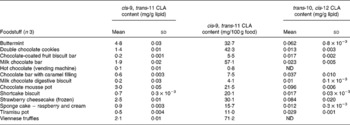
ND, not detected.
Conjugated linoleic acid concentration of cheese products
As shown in Table 1, processed cheese slices contained the highest concentration of cis-9, trans-11 CLA (7·3 mg/g lipid), which was higher than the value for USA-processed cheese determined using GC by Chin et al. (Reference Chin, Liu and Storkson18) (4·65 mg/g fat) but less than the 11·1 mg/g fat of cis-9, trans-11 CLA in German-processed cheese (also determined by GC) reported by Fritsche & Steinhart(Reference Fritsche and Steinhart19). These higher values for CLA contents in processed cheese may have been due in part to heat treatment during processing of cheese as an increase in processing temperature, and the addition of whey protein concentrate has been shown to produce a significant increase in the CLA content of cheese(Reference Shantha, Decker and Ustunol24). Mature Cheddar contained a relatively high concentration of cis-9, trans-11 CLA (6·1 mg/g lipid), which was approximately three times the concentration in mild Cheddar (1·9 mg/g lipid) and was also higher than the value of 3·4 mg/g lipid for sharp Cheddar determined by Chin et al. (Reference Chin, Liu and Storkson18). The concentration of cis-9, trans-11 CLA in Brie (3·6 mg/g lipid) was similar to the value of 3·8 mg/g lipid reported by Chin et al. (Reference Chin, Liu and Storkson18). The variation in the isomer concentrations between the studies may be due to several factors including: length of ageing period(Reference Chin, Liu and Storkson18); differences in feeding diet regimens and grazing of cattle(Reference Jahreis, Fritsche and Steinhart25, Reference Khanal, Dhiman and Boman26); extent of ripening(Reference Chin, Liu and Storkson18); differences in processing(Reference Shantha, Decker and Ustunol24); seasonal variations(Reference Ledoux, Chardigny and Darbois27, Reference Parodi28).
Conjugated linoleic acid concentration of butter and margarine
The margarines and butter substitutes examined contained very small amounts of cis-9, trans-11 CLA (Table 2). This was expected as these products are mainly derived from sunflower or vegetable oils. Some of the butter substitute spreads contained small amounts of buttermilk, but this did not appear to increase the CLA content (0·1 mg/g lipid). These small amounts of CLA in margarines and butter substitute spreads may have been a by-product of the partial hydrogenation of vegetable oils during the production of margarine and spreads(Reference Parodi, Sebedio, Christie and Adlof29). As expected, butter contained the highest cis-9, trans-11 CLA concentration of 2·5 mg/g fat. This value was much lower than 9·4 mg/g fat estimated by Fritsche & Steinhart(Reference Fritsche and Steinhart19) in German butter, but is closer to the value of 4·7 mg/g fat estimated by Chin et al. (Reference Chin, Liu and Storkson18) in US butter.
Regional and seasonal variations may be responsible for variation in CLA values in butter. Ledoux et al. (Reference Ledoux, Chardigny and Darbois27) measured CLA concentrations in French butter at different times of the year and from different regions in France. Butter CLA contents were higher in summer (8·0 mg/g lipid) than in winter (4·5 mg/g lipid) and regional variations were also observed. This may have been due to differences in grass pastures, cattle breed, fodder quality and production technology.
Several studies have shown that CLA in edible oils is negligible and often undetected(Reference Chin, Liu and Storkson18, Reference Fritsche and Steinhart19). The small quantities that are present can be formed as a result of heating, bleaching and deodorisation during refining processes(Reference Parodi, Sebedio, Christie and Adlof29). Because of this, CLA content of vegetable oils was not estimated in the present study.
Conjugated linoleic acid concentration of milk
Cow's milk fat is one of the richest sources of CLA in nature and literature values range between 2 and 37 mg/g fat(Reference Parodi, Sebedio, Christie and Adlof29). The CLA concentrations from the present study were at the lower end of this range. Table 3 shows that the estimated concentration of the cis-9, trans-11 CLA in whole milk was 2·0 mg/g fat, in semi-skimmed milk was 2·1 mg/g fat and was undetected in skimmed milk. CLA could not be detected in skimmed milk due to the fact that skimmed milk normally contains less than 0·3 % fat.
There are a wide variety of factors that affect the CLA content of fat in ruminant milk. These include cattle-feeding diet regimens, for example diets rich in PUFA have been shown to increase milk fat CLA concentration(Reference Jahreis, Fritsche and Steinhart25). Khanal et al. (Reference Khanal, Dhiman and Boman26) found that an abrupt change from indoor feeding to grazing cows on pasture increased the CLA content of milk fat by up to 550 %. This may be due in part to the increase in α-linolenic acid, provided through pasture, as well as linoleic acid and VA in feeds, which are substrates for bacteria involved in rumen biohydrogenation. Seasonal variations are also highly significant as CLA concentrations in milk fat in the summer period have been found to be up to two or three times higher than in the winter period(Reference Parodi, Sebedio, Christie and Adlof29).
Conjugated linoleic acid concentration of meats
Table 4 shows that of the meats surveyed, lamb cutlets contained the highest concentration of cis-9, trans-11 CLA (8·2 mg/g fat), followed by lamb doner kebab meat (7·9 mg/g fat), beef rib eye steak (7·5 mg/g fat) and beef burger (7·1 mg/g fat). These high values were expected as beef and lamb are ruminant meats. The lowest concentration of CLA was found in chicken curry (0·1 mg/g fat), which consists of non-ruminant meat and thus contains a negligible amount of CLA. These values corresponded well with those of Fritsche & Steinhart(Reference Fritsche and Steinhart19) who reported CLA concentrations for lamb of 12·0 and 6·5 mg/g fat in beef fillet in Germany. However, Chin et al. (Reference Chin, Liu and Storkson18) reported lower CLA concentrations − 5·8 mg/g fat in lamb and 4·3 mg/g fat in ground beef in the US.
The present UK study and the German study by Fritsche & Steinhart(Reference Fritsche and Steinhart19) reported higher CLA concentrations for lamb and beef than the US study by Chin et al. (Reference Chin, Liu and Storkson18), which may be due to differences in grazing conditions. In a study by Diaz et al. (Reference Diaz, Alvarez and De la Fuente30) investigating the CLA content in meat from lambs from the UK, Spain, Germany and Uruguay, animals exclusively fed concentrate (e.g. Spanish lambs) presented the lowest concentration of CLA, while grass-fed lambs, which were mainly British and German, had higher concentrations. The higher amounts of CLA in UK and Germany may have been due to the fact that the lambs in these two countries consumed grass and concentrate, which is high in linoleic acid. Grazing conditions also affect CLA concentrations in beef. Some of the highest reported values for CLA content in beef are for Australian samples, with up to 17 mg/g fat for beef obtained during a time when animals were mostly pasture fed(Reference Fogerty, Ford and Svoronos31). Cooking meat does not appear to affect the CLA content of its fat to any great extent(Reference Shantha, Decker and Ustunol24).
Conjugated linoleic acid concentration of confectionery, cakes and biscuits
Table 5 shows the CLA concentrations for a variety of confectionery products and cakes. Buttermint contained the highest concentration of cis-9, trans-11 CLA (4·8 mg/g fat), followed by chocolate mousse (3·0 mg/g fat). The concentration in milk chocolate (1·91 mg/g fat) was higher than in a study by Hurst et al. (Reference Hurst, Tarka and Dobson32) who demonstrated the existence of CLA in samples of milk chocolate using a combination of GC-MS and Ag+ HPLC techniques and reported a concentration of 1·4 mg/g fat. The CLA content of these confectionery products is most likely to have been derived from the dairy products involved in their manufacture, such as the milk in milk chocolate and the butter in buttermint.
Variation in conjugated linoleic acid concentrations due to different analytical techniques
The accuracy of the methods used to determine the CLA concentrations is a major factor that may account for the variations in reported CLA concentrations. Fritsche et al. (Reference Fritsche, Fritsche and Solomon23) compared the CLA concentration of twenty samples of beef fat determined by both GC-FID and Ag+ HPLC. They found that amounts obtained by GC were generally higher than those with Ag+ HPLC, with mean values for CLA of 3·5 and 2·7 mg/g fat, respectively, and in one case the CLA level was 176 % higher when determined by GC. These discrepancies may in part have been due to co-elution of non-conjugated fatty acids using GC. The present study estimated the concentrations of the cis-9, trans-11 CLA isomer only, whereas many studies estimate total CLA concentrations. Although the cis-9, trans-11 CLA isomer generally constitutes about 90 % of the total CLA isomers in foodstuffs(Reference Chin, Liu and Storkson18), this must be taken into account when making comparisons.
Estimation of the mean daily conjugated linoleic acid intake of a cohort of healthy, adult subjects
The mean daily intake of CLA in a cohort of eighteen healthy volunteers (nine male and nine female) was estimated using a 7-d weighed intake record. The volunteers' physical and dietary data are displayed in Table 6. The mean BMI was 24·0 (sd 2·2) kg/m2. The mean daily energy intake for the male subjects was 11·43 (sd 1·65) and 7·96 (sd 1·79) MJ for female subjects. These values are close to the estimated average requirements for energy in UK adults (19–50 years) − 10·68 MJ/d for males and 8·12 MJ/d for females(33), but are higher than the mean daily energy intake values from the UK National Diet and Nutrition Survey(Reference Henderson, Gregory and Irving34), which reported that the mean daily energy intake for UK men was 9·72 and 6·87 MJ for women. This may be in part due to selection of volunteers in the present study who were largely within the normal BMI range, whereas the UK National Diet and Nutrition Survey data are for all BMI ranges. In general, the percentage contribution of macronutrients to mean total energy intake compares closely to the values from the UK National Diet and Nutrition Survey for both males and females. However, for males the percentage of total energy from alcohol (2·9 (sd 2·6)) was markedly lower than the UK National Diet and Nutrition Survey value of 6·5 %. The relative comparability of this energy and macronutrient data with national intake data suggests that the cohort in the present study is reasonably representative of the UK population.
Table 6 Subjects' physical data and mean daily macronutrient, total energy and conjugated linoleic acid (CLA) intakes estimated using 7-d weighed food record
(Mean values and standard deviations)
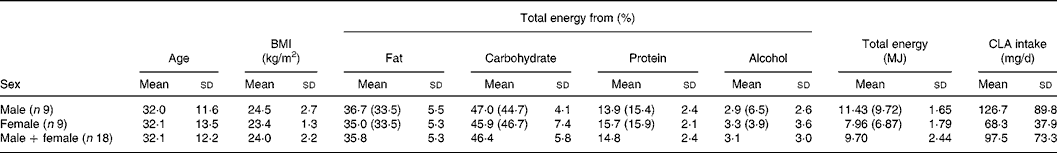
Figures in brackets indicate the percentage contribution of the corresponding macronutrients to the mean daily total energy intakes from the National Diet and Nutrition Survey for UK adults aged 19–64 years(Reference Henderson, Gregory and Irving34). For total energy, the figures in brackets state mean daily total energy.
The mean daily intake of cis-9, trans-11 CLA in the present cohort was estimated to be 97·5 (sd 73·3) mg/d (male − 126·7 (sd 89·8) mg/d; female − 68·3 (sd 37·9) mg/d). This value is close to a mean daily cis-9, trans-11 CLA intake of 94·9 (sd 40·6) mg/d reported by Ens et al. (Reference Ens, Ma and Cole35) who carried out a 7-d dietary record study in a small cohort of Canadian subjects. Some studies have found lower intakes than in the present study including Ritzenhaler et al. (Reference Ritzenthaler, McGuire and Falen20) who reported a mean daily intake of 50 mg/d for US women using 3-d dietary records. A study in the Portuguese population by Martins et al. (Reference Martins, Lopes and Alfaia36) estimated the total CLA intake to be 73·70 mg/d using national dietary survey data.
The mean daily intake of cis-9, trans-11 CLA determined in the present study is much lower than values determined by Fritsche & Steinhart(Reference Fritsche and Steinhart19) who found that the estimated daily intake of CLA for German men was 440 and 360 mg/d for women, using data from a national dietary survey. One of the highest reported mean daily intake values is from a study in Australia(Reference Parodi37) using data from a national dietary survey where reported CLA intakes were between 500 and 1500 mg/d.
Although there appears to be a wide range of CLA intakes by the populations of different countries, several factors may be at least partially responsible for this. The methods used to estimate the daily intake of CLA vary from large dietary surveys, to limited nutrient databases with 3-d dietary records, semi-quantitative food questionnaires, data from national food surveys and FFQ. All of these methods have their advantages and disadvantages. The 7-d weighed intake method used in the present study may, however, underestimate dietary intake as weighing all food and drink consumed can interfere with the usual eating habits of the participant and may have lead to under-reporting in the present study.
As discussed earlier, the concentration of CLA in foodstuffs reflects factors such as seasonal variations, differences in cattle-feeding diet regimens, variations in breed and food processing, which vary between different countries. The high mean daily intake of CLA in Australia could be largely due to different grazing conditions. Some of the highest reported values for CLA content in beef are for Australian beef, with up to 17 mg/g fat for samples obtained during a time when animals were mostly pasture fed(Reference Fogerty, Ford and Svoronos31), whereas the highest cis-9, trans-11 CLA concentration in beef determined in the present study was 7·51 mg/g fat for beef rib eye steak. Also, relative consumption of fat between cohorts in different countries is significant, as those from cohorts in countries with a higher intake of fat would also result in a higher intake of CLA(Reference McGuire, McGuire, Ritzenthaler, Yurawecz, Mossoba, Kramer, Pariza and Nelson38).
It was estimated that an intake of 3 g/d would be required to observe health benefits in human subjects analogous to those observed in rats(Reference Ip, Singh and Thompson39) and many CLA supplement manufacturers recommend a daily dose of 3 g. The present study reported a dietary intake of only 97·5 (sd 73·3) mg/d for UK volunteers. In fact, no studies of dietary intake have reported a value that comes close to 3 g/d, meaning that for people to consume this level of CLA, supplementation will be required or ruminant foodstuffs need to be enriched artificially. CLA-enriched butter has been produced with concentrations of CLA up to 41 mg/g fat(Reference Bauman, Corl, Peterson, Sebedio, Christie and Adlof40), but this is not currently mass produced and is used only for scientific research purposes(Reference Lock, Horne and Bauman41). Even so, large quantities of this butter would need to be consumed to reach an intake of 3 g CLA, which would have obvious detrimental effects due to the high saturated fat and energy contents of butter.
Although several studies have reported positive health-related effects of CLA supplementation, the efficacy of CLA supplementation in human subjects is still a matter of intense debate, and even detrimental effects have been observed in individuals consuming CLA supplements. For example, a CLA preparation containing the purified cis-9, trans-11 CLA isomer increased insulin resistance and lipid peroxidation compared with placebo in obese men in a study by Riserus et al. (Reference Riserus, Vessby and Arnlov42).
Turpeinen et al. (Reference Turpeinen, Mutanen and Aro43) showed that approximately 20 % of dietary VA was converted to CLA endogenously by Δ9-desaturase in human subjects, and because ruminant products contain at least twofold more VA than CLA, the effective physiological dose of CLA will be CLA intake × 1·4(Reference Jahreis, Fritsche and Steinhart25). This would increase the mean cis-9, trans-11 CLA intake for the UK determined by the present study to 136·5 mg/d. When comparing CLA intake values between different countries, it must be noted that the present study estimates the daily intake of the cis-9, trans-11 CLA isomer only, whereas many studies estimated total CLA intake. As the cis-9, trans-11 CLA isomer generally constitutes about 90 % of the total CLA isomers in foodstuffs, the total intake of CLA would be expected to be up to 10 % greater than the figure for cis-9, trans-11 CLA intake.
Conclusions
Currently, there are few data on the CLA content of UK foodstuffs, which makes it difficult to carry out epidemiological studies to investigate the relationship between CLA intake and factors such as disease incidence in this country. A total of 112 foods were analysed to quantify the concentrations of the cis-9, trans-11 CLA and trans-10, cis-12 CLA isomers. The cis-9, trans-11 CLA concentrations for cheese ranged from 1·4 mg/g fat in cheese spread to 7·3 mg/g lipid in processed cheese slices. In meats, lamb cutlets contained the highest concentration of cis-9, trans-11 CLA (8·2 mg/g fat), whereas chicken curry (0·1 mg/g fat) contained the lowest. Cow's whole milk contained 2·0 mg/g fat, semi-skimmed milk contained 2·1 mg/g fat and CLA was not detected in skimmed milk. Most margarines and butter substitute spreads contained negligible amounts of cis-9, trans-11 CLA, whereas butter contained 2·5 mg/g fat.
To the best of our knowledge, the present study is the first to report an estimation of the habitual daily intake of CLA in the UK. The mean daily dietary intake of cis-9, trans-11 CLA in the present study was estimated to be 97·5 (sd 73·3) mg/d. This value increases to 136·5 mg/d when taking into account conversion of dietary VA to CLA endogenously by Δ9-desaturase(Reference Riserus, Vessby and Arnlov42). These data will be useful for carrying out future epidemiological studies determining the role of CLA in health and in particular, investigating possible relationships between CLA intake and chronic disease incidence.
Acknowledgements
We would like to express our gratitude to the subjects who gave their time to participate in the present study. K. A. H. was the principal investigator for the study and responsible for overall guidance and critical revision of the manuscript. E. H. M. was the co-investigator for the study and was responsible for technical guidance. S. M. carried out the laboratory work, data collection and analysis, participant management and prepared the manuscript. There were no conflicts of interest. The present work was supported by a Nottingham Trent University Research Bursary. The present work was performed at the School of Science and Technology, Nottingham Trent University, Erasmus Darwin 130, Clifton Campus, Nottingham NG11 8NS, UK.


