


Reports in the literature on the association of non-alcoholic fatty liver disease (NAFLD) with dietary patterns are scarce, particularly in the elderly population. NAFLD has attracted increasing attention given its high prevalence, estimated at 20–30 % in Western countries and 5–18 % in Asia( Reference Masarone, Federico and Abenavoli 1 ). The disease is characterised by the accumulation of fat in hepatic cells among individuals without excessive consumption of alcohol, use of steatogenic drugs or hereditary diseases( Reference Chalasani, Younossi and Lavine 2 ). NAFLD is part of a syndrome of metabolic dysregulation and associated with central obesity, advanced age, defects in insulin and glucose metabolism, dyslipidaemia, hypertension, the metabolic syndrome and inflammation( Reference Jesus, Nunes and Magalhães 3 ).
Among the different risk factors, age is noteworthy, as at older ages there is a greater prevalence of metabolic disorders related to insulin resistance, obesity and diabetes mellitus type 2. In addition, estimates suggest that population ageing is set to increase significantly in the coming decades( Reference Bertolotti, Lonardo and Mussi 4 ).
Steatohepatitis, fibrosis with evolution to cirrhosis and hepatocellular carcinoma are the most severe and concerning stages of NAFLD in elderly. Moreover, NAFLD associated with other more serious types of steatosis increases mortality from CVD( Reference Machado and Cortez-Pinto 5 ). The global rise in the proportion of individuals over the age of 60 years coupled with increasing rates of overweight, obesity and mortality from non-communicable chronic diseases( Reference Olinto 6 ) point to the need for studies investigating the risk factors associated with these diseases. The dietary patterns are between the modifiable factors.
Another relevant aspect is that the majority of studies investigating the relationship between diet and NAFLD have used more traditional methods of assessing consumption, exploring the effect of separate nutrients or foods. This approach has led to conflicting results that are hard to interpret owing to difficulties isolating the effects of specific nutrients on the outcome( Reference Fan and CAO 7 ).
The goal of identifying dietary patterns is more recent and overcomes this limitation because the synergistic effects of the foods and nutrients are taken into account( Reference Moeller, Reedy and Millen 8 ). Investigating this new approach, a systematic review article published in 2015 identified only five studies assessing the association between dietary patterns and hepatic steatosis( Reference Koch, Nothlings and Lieb 9 ), none of which specifically examined the association between NAFLD and dietary patterns in the elderly population. Against this background, the objective of the present study was to assess the association of dietary patterns with NAFLD in an elderly population.
Methods
Study population and data collection
Data collection was performed at the Arterial Hypertension Outpatient Clinic of a public hospital in 2009. The project was submitted to the Institutional Ethics Board and was approved under protocol no. 050203/09. All participants signed a free and informed consent form. Eligibility criteria for inclusion to the study were as follows: to be treated at the clinic, aged 60 years or older, be walking normally, have no previously diagnosed liver disease and no excessive intake of alcoholic beverages.
A total of 229 older adults, comprising 171 (74·7 %) women, took part in the study. The mean age of the group was 68·7 (sd 6·4) years, averaging 71·1 (sd 6·9) years among the men and 67·9 (sd 5·9) years among the women. The group with NAFLD showed lower mean age than those without the disease (P<0·001). The patients with NAFLD also presented higher mean BMI (P<0·001). The energy and macronutrient intakes were similar between groups (P>0·05) (Table 1).
Table 1 Demographic, socio-economic, anthropometric, diet and lifestyle characteristics of the participants by non-alcoholic fatty liver disease (NAFLD) status (Mean values and standard deviations; numbers and percentages)

MBW, minimum Brazilian wage (1 MBW approximately US$300).
* Student’s t test was applied to test mean differences in continuous variables and the χ 2 test was applied to analyse the association between categorical variables.
† Statistically significant (P<0·05).
‡ Overweight≥27 kg/m2.
Information was collected for identification (name, sex and age), socio-economic status (monthly family income), lifestyle factors (smoking, alcohol consumption, physical activity), health profile (medication used), anthropometrics (weight and height), liver ultrasound and 24-h dietary recall (24HR) variables.
With regard to smoking and alcohol consumption, data were collected on consumption or otherwise and on respective time, quantity and frequency of use. Smokers were defined as individuals who had smoked at least one cigarette in the last 30 d leading up to the study( Reference Garrett, Dube and Trosclair 10 ) and non-smokers as those who had stopped smoking more than 30 d before study start. For physical activity, type of activity practised, session duration and frequency were considered. Individuals who performed moderate activity at least three times per week for at least 30 min were classified as practising physical activity( Reference Brandrão, Brandão and Nogueira 11 ).
Anthropometric measures
Participants were weighed and measured according to the World Health Organization technique( 12 ). Weight was measured using calibrated digital anthropometric scales with a capacity of 180 kg and sensitivity to the nearest 100 g. Height was measured using a stadiometer attached to scales, which had a capacity of 1·92 m and sensitivity to the nearest 0·5 cm (Filizola). BMI (weight (kg)/(height squared (m2)) was calculated based on weight and height measurements, and the patients were classified according to the study by Lipschitz( Reference Lipschitz 13 ).
Liver ultrasonography and definitions of non-alcoholic fatty liver disease
Liver ultrasound examinations were carried out using an EnVisor C ultrasound device (Philips Medical Systems-Ultrasound). NAFLD diagnosis was defined according to American Gastroenterological Association recommendations( Reference Chalasani, Younossi and Lavine 2 ). A positive NAFLD diagnosis was attributed when ultrasound examinations disclosed hepatic steatosis at any stage, with or without associated biochemical changes, and in the absence of excessive intake of alcoholic beverages (abstinence or average daily alcohol intake of <20 g for women and 30 g for men).
Assessment of dietary intake
The 24HR was applied by trained nutritionists on 3 non-consecutive days, including 1 weekend day. Data on 24 h dietary intake were collected in the form of household measures and subsequently converted into grams for analysis of total energy consumption.
Dietary patterns
Dietary patterns were obtained by first tabulating the name of the food and the quantity in grams on each recall day for each individual assessed. The elderly reported consumption of over 600 different foods.
The foods were grouped by nutritional value. Only food items consumed by at least 80 % of participants, such as rice and beans, were not grouped. Foods consumed by <5 % of the sample not classified under any group were excluded, following the criteria adopted by Selem et al.( Reference Selem, Castro and César 14 ). Successive food groupings were tested until attaining the smallest number of groups, thus facilitating the analysis of dietary patterns.
The final analysis was performed for twenty-seven food groups. Multiple Source Method (MSM) software was used to remove the intrapersonal variance for each food group. This software, developed in 2006, uses statistical models to provide usual food intake distributions based on estimated individual intake( Reference Haubrock, Nothlings and Volatier 15 , Reference Hartting, Haubrock and Knuppel 16 ) and provides estimated usual intake of each individual for each food group( Reference Hartting, Haubrock and Knuppel 16 ).
Dietary patterns were derived by factor and principal component analyses (PCA), where input data were predicted from usual dietary intake in grams. The adequacy of the data was checked using the Kaiser–Meyer–Olkin (KMO)( Reference Kaiser 17 ) index and Bartlett’s sphericity test. KMO values≥0·5 and P≤0·05 on Bartlett’s sphericity test were considered acceptable( Reference Selem, Castro and César 14 , Reference Matos, Barreto and Rodrigues 18 , Reference Santos, Fisberg and Marchioni 19 ).
The number of factors (patterns) retained obeyed criteria of eigenvalues >1·5( Reference Selem, Castro and César 14 ) and analysis of the scree plot graph, whereby the point at which the graph starts to become horizontal indicates the maximum number of factors to be retained( Reference Kaiser 17 ). Subsequently, varimax orthogonal rotation was applied to simplify the factor matrix and facilitate interpretation of the data. These procedures are described in more detail by Hair et al.( Reference Hair, Black and Barry 20 ). For the interpretation of dietary patterns, food groups with rotational factor loadings ≥0·3 or ≤−0·3 were considered. The factor loading is the coefficient of correlation between the food group and the factor( Reference Hair, Black and Barry 20 ). Thus, factor loadings of <│0·3│were not interpreted, as these did not make a significant contribution to the pattern.
The dietary patterns were named based on the overall food groups scored in each factor and on terminology adopted in previous publications. Each individual was then attributed a score for each pattern.
Statistical analysis
After defining the patterns, mean scores and standard errors of each dietary pattern were calculated for the groups with and without NAFLD. Mean scores of the two groups were then compared using the Mann–Whitney U test.
Scores for each pattern were distributed in tertiles, and Poisson multiple regression models with robust variance( Reference Barros and Hirakata 21 ) were used to investigate the NAFLD with adherence to dietary patterns. In the statistical models, NAFLD was considered the dependent variable (dichotomous) and the dietary patterns (tertile in dummy) the independent variables of interest. Three models were built: model 1 raw; model 2 adjusted for sex, age and energy intake; and model 3 adjusted for sex, age, energy intake, BMI, smoking status, physical activity, family income and use of hypoglycaemic drugs. The model was tested by adjusting the healthy pattern for the other three patterns. Linear tendency tests were calculated using the tertile of the exposure variable as continuous. Values of P<0·05 were considered significant.
Results
Four dietary patterns were identified: traditional, regional snacks (Northeast of Brazil), energy dense and healthy, which together explained 29·4 % of the total variance in intake, with a KMO=0·526 and Bartlett’s sphericity test <0001, values accepted by the literature( Reference Selem, Castro and César 14 , Reference Matos, Barreto and Rodrigues 18 , Reference Santos, Fisberg and Marchioni 19 ).
The traditional pattern comprised foods commonly consumed by the Brazilian population, such as rice, beans, bread/toast, tea/coffee, sweet products/desserts/sugar (with significant negative loading for fruits, semi-skimmed and skimmed milk, whole grains and savoury bread/toast). The regional snacks pattern (Northeast of Brazil) comprised typical foods for morning and afternoon meals in the Northeast, such as tea/coffee, dairy products, cassava flour/tapioca/cuscus, butter and olive oil (with significant negative loading for rice). The energy-dense pattern included processed cold meats, beef, viscera, sweet products/desserts/sugar, soft drinks, tubers/spaghetti/pastries (with significant negative loading for white meat). The healthy pattern included fruits, vegetables/legumes, white meat, olive oil, margarine, and bread/toast (with significant negative loading for beef) (Table 2).
Table 2 Factor loadings for four dietary patterns of elderly, derived by principal component analysis
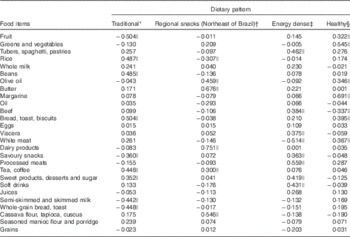
* Percentage variance of the factor is 8·249.
† Percentage variance of the factor is 7·404.
‡ Percentage variance of the factor is 7·258.
§ Percentage variance of the factor is 6·468.
|| Foods with loadings ≥0·3 or ≤−0·3.
The number of individuals with NAFLD was 103 (45 %). Individuals without NAFLD exhibited a positive mean healthy pattern adherence score, whereas those with NAFLD had negative mean scores, with statistically significant difference between these means (Table 3).
Table 3 Means scores for dietary patterns of elderly with and without non-alcoholic fatty liver disease (NAFLD) (Mean values with their standard errors)
* Mann–Whitney U test.
NAFLD was inversely associated with higher adherence to the healthy pattern (prevalence ratios (PR) 0·70; 95 % CI 0·50, 0·98, P trend=0·037) and was directly associated with the regional snacks pattern (PR 1·42; 95 % CI 1·02, 1·92, P trend=0·035) after adjustment for confounders. None of the other patterns exhibited an association with NAFLD (Table 4). After adjusting for the other dietary patterns (traditional, regional snacks (Northeast of Brazil) and energy dense), the upper tertile of the healthy pattern remained associated (PR 0·69; 95 % CI 0·48, 0·99).
Table 4 Association between dietary patterns and non-alcoholic fatty liver disease in elderly (Prevalence ratios (PR) and 95 % confidence intervals)
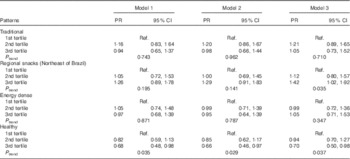
Model 1, crude; model 2, adjusted for sex, age and energy intake; model 3, adjusted for sex, age, energy intake, BMI, smoking status, physical activity, family income and hypoglycaemic drugs use; Ref., referent values.
Discussion
In the present study, an association between healthy dietary pattern and NAFLD was found, independently of confounding factors such as sex, age, energy intake, BMI, smoking status, physical activity, family income and use of hypoglycaemic drugs. Reports on this type of association in the literature are scarce, in contrast with cardiovascular outcomes. Before this publication, no association between a healthy dietary pattern and NAFLD in elderly had been reported in the literature.
In healthy adults, there is strong and consistent evidence that greater adherence to dietary patterns high in fruits, vegetables, whole grains, nuts, legumes, unsaturated oils, dairy products, poultry and fish, yet low in meat (red and processed) and sugar- and fat-rich dairy products, is associated with a lower risk of CVD including CHD and stroke( 22 ).
It is important to point out that NAFLD has been previously associated with central obesity, advanced age, deficits in insulin and glucose metabolism, dyslipidaemia, hypertension, the metabolic syndrome and inflammation( Reference Jesus, Nunes and Magalhães 3 ). Thus, a healthy dietary pattern, recognised as a protective factor for cardiovascular events and their risk factors( 22 ), may also play a key role in the prevention and control of NAFLD. Among 999 Chinese adults, the highest quartile of the grains–vegetables pattern (high intakes of coarse grains, tubers, vegetables, mushroom and kelp/seaweed, cooked meat and beans) presented the lowest prevalence of NAFLD (PR 0·777; 95 % CI 0·618, 0·977, P<0·05)( Reference Yang, Shu and Wang 23 ).
The findings of the present study corroborate the results of the few previous studies assessing dietary patterns and NAFLD, although none of the available studies specifically addressed the elderly population.
We also found associations between the regional snacks pattern with NAFLD after adjustment for confounders. This pattern was characterised by the presence of regional foods with high carbohydrates and high glycaemic load, such as cassava flour, tapioca and cuscus. Patterns with these characteristics were associated with NAFLD( Reference Jia, Xia and Zhang 24 ) and with high degree of disease( Reference Valtueña, Pellegrini and Ardigò 25 ). However, it is important to mention that the typical foods of the snack pattern are whole and minimally processed. Besides, they were not identified in patterns published by other studies.
Although the two dietary patterns (healthy and regional snacks) associated with the prevalence of NALFD have been validated by the literature, as to their effects in disease after adjustment by the four dietary patterns obtained, only the healthy pattern maintained the association (PR 0·69; 95 % CI 0:48, 0·99), strengthening its statistical power compared with other patterns.
Among 14-year-old adolescents with central obesity, the healthy pattern (characterised by consumption of whole grains, fruit, vegetables, greens and fish) obtained by factor analysis was a protective factor for the emergence of NAFLD at 17 years of age (OR 0·63; 95 % CI 0·41, 0·96, P=0·033), whereas the Western pattern (characterised by consumption of red meat, refined grains, processed meats, potato fries, whole dairy products and soft drinks) was a risk( Reference Oddy, Herbison and Jacoby 26 ), and dietary patterns were obtained by factor analysis.
Dietary patterns reflect eating habits in a more global fashion, facilitating investigations on their association with health outcomes. However, numerous subjective stages are involved as well as others with decision points of an analytical nature. The a posteriori method used to derive the patterns had the advantage of being based on empirical data from the population under study( Reference Olinto 6 ), as opposed to relying on a healthy pattern defined by other authors( Reference Newby and Tucker 27 ).
Other studies have used a priori methods of deriving dietary patterns, where a Mediterranean diet rich in olive oil was considered as the healthy pattern. In a case–control study in adults, adherence to this dietary pattern was not associated with lower risk of NAFLD but was associated with severity of the disease. A one unit increase in the MedDietScore was associated with a 36 % lower likelihood of having NAFLD (OR 0·64; 95 % CI 0·45, 0·92), after adjusting for sex and level of abdominal fat( Reference Kontogianni, Tileli and Margariti 28 ).
In an intervention study involving twelve individuals over a 6-week period, the Mediterranean diet reduced hepatic steatosis, while improving peripheral insulin sensitivity, even in the absence of weight loss. The authors advocate adherence to this pattern as an inexpensive, non-toxic therapy with potential to improve NAFLD-related health status, diabetes mellitus type 2 and CVD( Reference Ryan, Itsiopoulos and Thodis 29 ).
Although no studies assessing the association of dietary patterns with NAFLD in the elderly were found, a healthy pattern in this age group has previously been associated with enhanced nutritional status, quality of life, survival( Reference Anderson, Harris and Tylavsky 30 ), lower likelihood of cognitive deficit, less risk of Alzheimer’s disease( Reference Gu and Scarmeas 31 ) and lower mortality( Reference Masala, Ceroti and Pala 32 , Reference Bamia, Trichopoulos and Ferrari 33 ). Such results underscore the potential of the method of deriving dietary patterns and their association with health outcomes, as the synergistic effects of foods and nutrients are taken into account.
There are several limitations of the present study. The dietary pattern identification method used in this study, including the subjectivity inherent to the process of grouping food items, was carried out based on the technical knowledge of the researcher.
Several decision points in the process of deriving dietary patterns by PCA also give rise to different options of collection and analysis across studies, such as the data collection method used (FFQ or 24HR), treatment of input variables (grams, portions, percentage energy), use of rotation, selection of final patterns and their naming( Reference Moeller, Reedy and Millen 8 ) as well as cut-off points for eigenvalues( Reference Newby and Tucker 27 ). Therefore, further studies should be conducted to better define the criteria for decisions taken throughout the methodological process.
Another limitation of the present study was its cross-sectional design, as cause and effect were measured at the same time. Strengths of the study include the fact that NAFLD diagnosis took place only at the time of data collection. Thus, patients diagnosed with the disease had made no changes to their usual dietary habits in response to the condition and were not undergoing any specific treatment.
Although the NAFLD is a multifactorial disease( Reference Bertolotti, Lonardo and Mussi 4 ), we controlled our results (models 2 and 3) by the main factors associated with the outcome, such as age, sex, energy intake, BMI, smoking status, physical activity, family income and use of hypoglycaemic drugs. The associations remain even after adjustment for confounding factors, and the healthy and regional snacks patterns became increasingly important with the additional adjustments.
The methodological rigour of this study is also noteworthy, having used the MSM to remove intrapersonal variance and obtain the estimated usual intake in grams for each food group. Another advantage was the use of 24HR to estimate usual intake of food groups, thereby dispensing with the validation and calibration process required when using the FFQ.
It can be concluded that the healthy dietary pattern, characterised by consumption of a diet high in fruits, vegetables/legumes, white meat, olive oil, margarine, bread/toast and low in red meat is inversely associated with NAFLD in older adults. Greater adherence to this dietary pattern was observed in elderly individuals without the disease.
Acknowledgements
The authors thank the participants of this study.
This research received no specific grant from any funding agency, commercial or not-for-profit sectors.
The authors’ contributions are as follows: L. S. A, N. T. S.: drafting the article; L. S. A., H. A. d. C. S., S. P. M. A., A. A. F. C., N. T. S.: analysis and interpretation of data; C. L. d. M. P., H. A. d. C. S., M. L. P. d. M.: substantial contributions to conception, design and acquisition of data; A. A. F. C., N. T. S.: revising the manuscript critically for important intellectual content. All authors have approved the final draft of the manuscript.
The authors declare that there are no conflicts of interest.


