


Vitamin D is an important micronutrient required for not only maintaining Ca balance and safeguarding skeletal integrity but also overall health and well-being of all age groups( Reference Holick 1 ). Presently, vitamin D deficiency (VDD) is recognised as a global epidemic( Reference Palacios and Gonzalez 2 , Reference Cheng 3 ). Despite, adequate sunshine throughout the year, VDD has been reported among all age groups and both sexes from different parts of India( Reference Gupta and Gupta 4 – Reference Marwaha, Tandon and Chopra 9 ). This has been primarily attributed to poor sun exposure due to cultural avoidance of skin exposure, crowded houses with limited sun exposure, work culture of staying indoors, dark skin complexion, atmospheric pollution, vegetarian foods habits, absence of food fortification with vitamin D and poor intake of vitamin D supplements( Reference Gupta and Gupta 4 , Reference Marwaha and Goswami 10 ). Though vitamin D is synthesised in the skin on exposure to UV radiation, it is difficult for children to achieve vitamin D sufficiency in all seasons solely through sun exposure, as observed in two of our studies( Reference Marwaha, Sreenivas and Talwar 11 , Reference Marwaha, Yenamandra and Sreenivas 12 ). Fortification of widely consumed staple foods offers a simple, practical, effective and safe alternative for combating VDD and is being practised all over world( Reference Black, Seamans and Cashman 13 ). The food fortification program in India is still in the stage of infancy( Reference Gupta and Gupta 4 , 14 ). Food Safety and Standard Authority of India under section 16(5) of Food Safety and Standards Act (2006) relating to standards for food fortification has permitted voluntary fortification of milk and oil with vitamins A and D vide their letter dated 19 May 2017. Our own study in Indian schoolchildren clearly showed that providing milk fortified with vitamin D is an effective and safe strategy to deal with public health issue( Reference Khadgawat, Marwaha and Garg 15 ). Although there are several studies in literature evaluating the impact of vitamin D3 supplementation in adults( Reference Shab-Bidar, Bours and Geusens 16 ), studies in children and adolescents are limited( Reference Sacheck, Van Rompay and Chomitz 17 – Reference Maalouf, Nabulsi and Vieth 25 ), particularly from India( Reference Marwaha, Tandon and Agarwal 26 ). Duration of the available studies in children varied from 8 weeks( Reference Talib, Ponnapakkam and Gensure 19 , Reference Dong, Stallmann-Jorgensen and Pollock 24 ) to 1 year( Reference Al-Shaar, Mneimneh and Nabulsi 21 , Reference Marwaha, Tandon and Agarwal 26 ), with supplemental doses ranging from 200( Reference Al-Shaar, Mneimneh and Nabulsi 21 , Reference Putman, Pitts and Milliren 23 ) to 60 000 IU( Reference Marwaha, Tandon and Agarwal 26 ) administered daily( Reference Sacheck, Van Rompay and Chomitz 17 , Reference Talib, Ponnapakkam and Gensure 19 – Reference Dong, Stallmann-Jorgensen and Pollock 24 ), weekly( Reference Talib, Ponnapakkam and Gensure 19 , Reference Maalouf, Nabulsi and Vieth 25 ), bimonthly( Reference Ghazi, Hosseinpanah and Ardakani E 18 ), monthly( Reference Ghazi, Hosseinpanah and Ardakani E 18 , Reference Marwaha, Tandon and Agarwal 26 ) or once in 2 months( Reference Marwaha, Tandon and Agarwal 26 ). Supplementation with lower doses of 200–600 IU/d did not achieve vitamin D sufficiency in majority of VDD subjects( Reference Khadgawat, Marwaha and Garg 15 , Reference Shab-Bidar, Bours and Geusens 16 , Reference Chakhtoura, El Ghandour and Shawwa 27 ). Indian Council of Medical Research (ICMR) recommends daily allowance of 400 IU for Indian children and adolescents( 28 ) in contrast to 600 IU/d recommended by the Indian Academy of Pediatrics (IAP)( Reference Khadilkar, Khadilkar and Chinnappa 29 ) and Institute of Medicine (IOM)( Reference Rosen, Abrams and Aloia 30 ). In the absence of information with regard to adequate daily dose of vitamin D3 required for Indian children with VDD( Reference Gupta and Gupta 4 ), we undertook this study with the primary aim to evaluate the adequacy and efficacy of daily supplementation of 600, 1000 and 2000 IU of vitamin D3 on serum 25-hydroxyvitamin D (25(OH)D) and parathyroid hormone (PTH) levels in schoolchildren and adolescents with VDD.
Methods
Subjects
This randomised study was performed between July 2015 and December 2017. Two schools underwent supplementation in the year 2016 and the other two in the year 2017. A total of 1112 schoolchildren, aged 6–16 years, who responded to our request to participate, were recruited from four fee paying schools in Delhi (Latitude North 28.38°, East 77.12°), India, representing mid socio-economic strata. The consent was obtained from school management, parents/guardians and verbal assent from children before undertaking this study. Parents were asked to sign the consent form, after they were provided with the details of the study in the patient information sheet and interaction of the first author with the parents to clear their doubts. These children and adolescents had minimal interrupted sun exposure (10–30 % body surface area for approximately 30 min/d during 09.00–16.00 hours. The dietary intake of vitamin D3 was minimal as most commonly consumed Indian foods contain negligible amount of vitamin D( 14 ). However, mean dietary intake of Ca (boys: 958 (sd 566) mg/daily; girls 796 (sd 436) mg/daily) was adequate and met the RDA as advised by ICMR( 28 ). These subjects were not advised any change in lifestyle during the study period. The details of screening and selection of subjects for the study is given in Fig. 1. Children and adolescents who were either on drugs affecting bone mineral metabolism such as Ca, vitamin D, glucocorticoids, anti-tubercular or anti-epileptics or suffering from any systemic illness were excluded from the study. A total of forty-nine children were excluded as they did not meet the inclusion criteria, and the rest (1063) underwent baseline investigations. A total of fifty-five children had serum 25(OH)D >50nmol/l and therefore excluded from the study. The remaining 1008 were finally recruited to participate in the study. Clinical trial registration number CTRI:2017/01/007681.
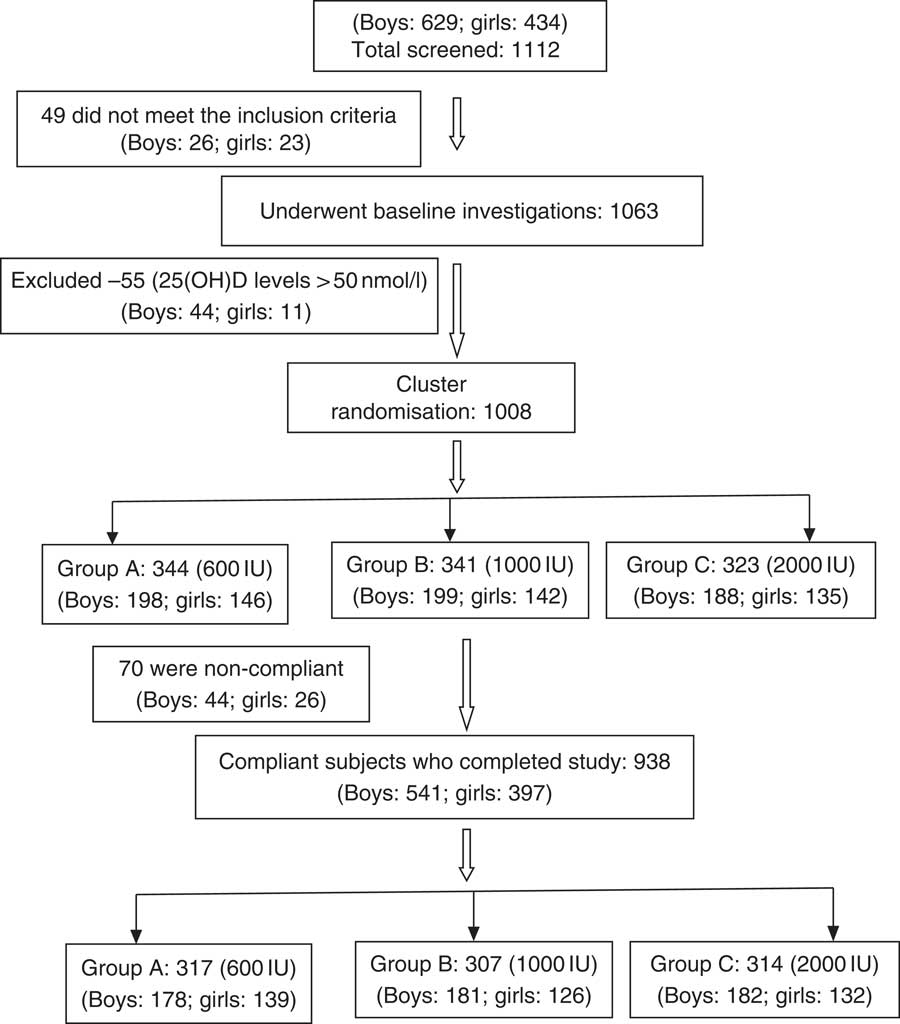
Fig. 1 CONSORT flow diagram. 25(OH)D, 25-hydroxyvitamin D.
The students were recruited from class one to nine, with three sections per class. Cluster randomisation was done within each class, taking each section as a cluster, using draw of lots to maintain age parity within each group. Within a class, three sections (clusters) were allocated for interventions (daily 600 IU (A), 1000 IU (B) and 2000 IU (C) of vitamin D3) for 6 months separately. The randomly allocated interventions were neither shared with class teachers nor shared with the students within each class till the end of the study. Three interventions were procured as tablets of same shape and colours packed in yellow, green and red bottles, content of which were not known to class teacher or students. The class teachers were handed over the respective allocated intervention to be given under supervision. Investigators were aware about the intervention allocation to sections, though the people involved in the laboratory analysis were blinded to the intervention status. The vitamin D3 capsules were manufactured and supplied every month by USV Private Ltd. The study protocol was approved by Institute Ethical committee of All India Institute of Medical Sciences, New Delhi. This trial was registered as Clinical trial registration number: CTRI-2017/01/007681. We did not include a placebo arm since only vitamin D-deficient children were included in the current study, and it would be unethical to supplement these children with placebo.
Data collection
Anthropometry measurements such as height, weight and BMI were noted at baseline. Height was measured to the nearest 0·1 cm using portable wall-mounted stadiometer (Holten’s stadiometer, 200 cm/78 inches, Model WS045; Narang Medical Limited), with subjects standing straight with head held in the Frankfurt plane. Weight without shoes and light clothes on was measured to the nearest 0·1 kg, using an electronic scale (EQUINOX Digital weighing machine, Model EB6171; Equinox Overseas Private Limited). BMI, defined as the ratio of body weight to height square, was expressed in kg/m2. Weight categories were defined based on the revised criteria as given by the IAP. Participants above adult equivalent of BMI of 23 kg/m2 were defined as overweight and those above adult equivalent of BMI of 27 kg/m2 were defined as obese( Reference Khadilkar, Yadav and Agrawal 31 ).
Blood samples were collected in the fasting state between 08.00 and 09.00 hours, centrifuged and serum separated into three aliquots at the study site and transported in dry ice to the laboratory. Serum Ca, P and alkaline phosphatase (ALP) were estimated within 2 d of collection and the other two aliquots were frozen at –20°C for estimation of serum 25(OH)D and PTH at a later date. Serum Ca, serum phosphate and ALP were measured by commercially available kit using automated biochemistry analyser Cobasc-501 (Roche Diagnostics). The normal range for serum total Ca for 2- to 12-year-olds was 2·2–2·7mmol/l and 2·1–2·6mmol/l for 12- to 18-year-old children with analytical sensitivity of 0·05mmol/l, inorganic phosphorus was 1·0–1·7mmol/l in 7- to 12-year-olds and 0·9–1·5mmol/l in 13- to 16-year-old children with analytical sensitivity of 0·1mmol/l; and among girls, ALP was 129–417 U/l in 10–<13 years, 57–254 U/l in 13–<15 years and 50–117 U/l in 15–<18 years; and among boys it was 129–417 U/l in 10–<13 years, 116–468 U/l in 13–<15 years and 82–331 U/l in 15–<18 years with an analytical sensitivity of 5 U/l. The serum 25(OH)D was assayed using chemiluminescence method (Diasorin) and PTH (reference range: 10–65 pg/ml, analytical sensitivity 0·7 pg/ml) using electrochemiluminiscence assay (Roche Diagnostics), respectively. Intra- and inter-assay CV was 3·5 and 5 % for serum 25(OH)D and 2·4 and 3·6 % for serum PTH. Serum 25(OH)D level of <50 nmol/l was defined as VDD( Reference Rosen, Abrams and Aloia 30 ). VDD was further classified as severe (25(OH)D <12·5 nmol/l), moderate (25(OH)D <25 nmol/l) and mild (25(OH)D <50 nmol/l)( Reference Lips 32 ). Urinary samples were also collected for the random urinary Ca:creatinine ratio (UCaCrR – both Ca and creatinine measured in mg)) and was performed using Cobas-C III (Roche Diagnostics). Both blood and urine samples were repeated 6 months after intervention. However, in the absence of established Indian standards, diagnosis of hypercalciuria was made when random UCaCrR exceeded 0·21( Reference Metz 33 ).
Intervention
Supplementation was initiated in the month of July 2016 and 2017, every day for a period of approximately 6 months, under supervision of teachers and investigating staff at the study site for 6 working days/week and the records were maintained. Required numbers of vitamin D capsules were provided to the parents/guardians along with a record sheet to be maintained by the parents for sundays and planned holidays as per school calendar. For unplanned holidays, parents were advised to collect their requirement from school. Subjects were labelled as non-compliant when they either missed taking vitamin D for more than 7 d or were regularly absenting themselves from school during the period of supplementation. Although seventy participants (7·0 %) were labelled as non-compliant, they completed the study.
Sample size calculation
We expect that 70, 80 and 90 % children would achieve a serum level of 25(OH)D ≥50 nmol/l after 6 months of supplementation with 600, 1000 and 2000 IU/d cholecalciferol, respectively. This was based on our earlier study where 70 and 81 % children achieved serum 25(OH)D of ≥50nmol/l when supplemented with a daily dose of 600 and 1000 IU of vitamin D3 for 3 months( Reference Khadgawat, Marwaha and Garg 15 ). To detect a significant difference among the three groups in a two-sided test with a 5 % α error and 80 % power, seventy-four patients per group were required. Considering 10 % loss during the follow-up period, a sample size of eighty-two per group was considered. The increase in sample size in this study, however, was due to the fact that we had approached all children in schools to participate and we could not refuse any child’s participation.
Statistical analysis
Analysis was performed using Stata 12.0. Descriptive statistics were calculated as means and standard deviations and median (min–max). Difference in the means of various parameters (continuous variables) and difference in the proportions were compared among the three study groups using ANOVA and χ 2 test for trend. The primary outcome (serum 25(OH)D ≥50nmol/l) and secondary outcomes such as changes in serum 25(OH)D(nmol/l) and serum PTH (pg/ml) were analysed by both intention-to-treat (ITT) and per-protocol method. The missing values were imputed using the baseline observation carried forward technique for ITT analysis. The differences in percentage of serum 25(OH)D ≥50nmol/l across the groups were compared using regress (adjusted for age) and ‘svy regress’ command to account for cluster randomisation. The results were presented as difference (95 % CI). Paired ‘t’ test was applied to calculate the significance level of various parameters pre- and post-supplementation. Serum PTH and UCaCrR were not normally distributed. These parameters were analysed with Kruskal–Wallis test followed by Wilcoxon rank sum test and Wilcoxon signed rank test was used to assess the change in PTH and UCaCrR pre- and post-supplementation. Pearson’s correlation was used to evaluate the relation between various parameters and change in serum 25(OH)D and PTH levels. Multiple linear regression analysis was carried out on delta change in hormonal parameters after adjusting for age, BMI and basal 25(OH)D levels. A P-value <0·05 was considered statistically significant.
Results
The baseline anthropometric and biochemical characteristics of the participants is shown in Table 1. The mean age and BMI of the children were 11·7 (sd 2·4) years (boys: 11·8 (sd 2·5) years; girls: 11·6 (sd 2·3) years) and 18·1 (sd 3·7) kg/m2 (boys: 18·2 (sd 3·8) kg/m2; girls: 17·8 (sd 3·6) kg/m2), respectively. Among the three study groups, there was no significant difference in various parameters except for age and serum Ca levels (Table 1). The mean age of group C was significantly higher than those in groups A and B. Bony deformities (genu valgum/varum) were present in 15·1 % (152) participants. A total of eighty-seven participants (8·6 %) were obese (boys: 67 (11·5 %); girls: 20 (4·7 %)) and 187 (18·7 %) were overweight (boys: 113 (19·3 %); girls 74 (17·5 %)). Number of participants with obesity and overweight did not differ significantly between trial groups (obesity: 9·6, 8·8 and 7·4 %; overweight: 16·3, 19·6 and 19·8 % in groups A, B and C, respectively). In all, 14·6 % (147) participants had severe, 46·8 % (472) had moderate and 38·6 % (389) had mild VDD.
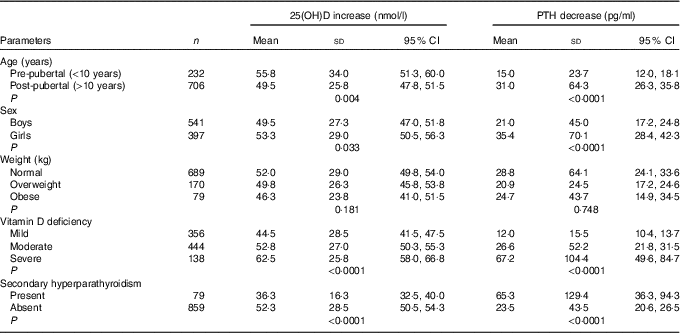
Table 1 Baseline demographic details and biochemical parameters (Mean values, standard deviations and 95 % confidence intervals)
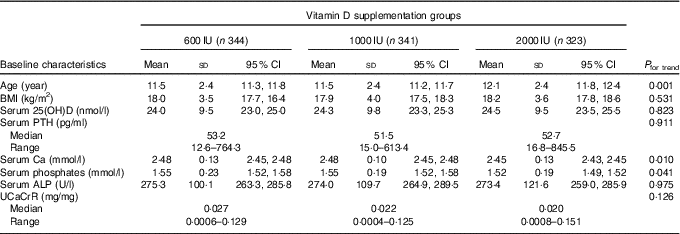
25(OH)D, 25-hydroxyvitamin D; PTH, parathyroid hormone; ALP, alkaline phosphatase; UCaCrR, urinary Ca:creatinine ratio.
Vitamin D status
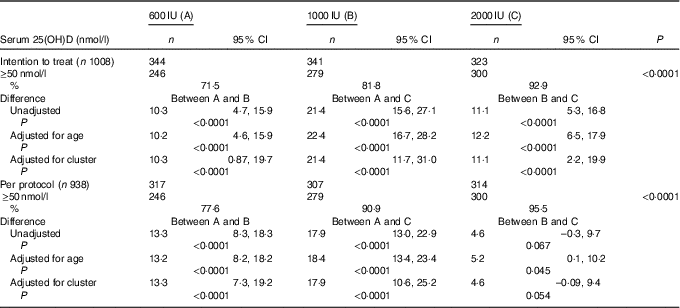
The overall mean baseline serum 25(OH)D level of 24·3 (sd 9·5nmol/l (boys: 26·3 (SD 9·8)nmol/l; girls: 21·8 (SD 8·8)nmol/l; P<0·0001) increased significantly to 77·8 (SD 27·5)nmol/l (P<0·001) with no appreciable difference in the post-supplementation serum 25(OH)D levels between boys and girls (boys: 75·5 (SD 25·8); girls 75·3 (SD 29·5)nmol/l; P=0·842). Overall, 84·1 % (789) participants achieved serum 25(OH)D levels of ≥50nmol/l (boys: 86·7 %; girls: 80·6 %). As shown in Table 2, in the ITT analysis, the percentage of subjects achieving serum 25(OH)D levels ≥50nmol/l increased significantly from group ‘A’ to group ‘C’ (71·5, 81·8 and 92·9 %, P<0·0001), respectively. The results did not change even after adjustment for age (71·2, 81·4 and 93·6 %). The differences in the percentage of subjects achieving serum levels of 25(OH)D ≥50nmol/l between the supplementation groups, A v. B, A v. C and B v. C were 10·3 (95 % CI 4·7, 15·9), 21·4 (95 % CI 15·6, 27·1) and 11·1 (95 % CI 5·3, 16·8), respectively. After accounting for cluster randomisation, the difference between A v. B, A v. C and B v. C was 10·3 (95 % CI 0·87, 19·7), 21·4 (95 % CI 11·7, 31·0) and 11·1 (95 % CI 2·2, 19·9), respectively. Similarly, significant differences were observed between A and C and A and B except for B and C in the per-protocol analysis. Those who did not achieve serum 25(OH)D levels ≥50nmol/l (149 children (15·9 %)) had higher BMI (18·6 (sd 3·6) v. 17·8 (sd 3·7) kg/m2, P=0·016), lower baseline serum 25(OH)D (21·3 (SD 8·0)) v. 24·8 (SD 9·8)nmol/l, P<0·0001) and higher PTH (79·3 (sd 81·3) v. 63·9 (sd 60·5) pg/ml, P=0·007) when compared with those who achieved serum 25(OH)D >50nmol/l.
Table 2 Comparison of percentage of serum 25-hydroxyvitamin D (25(OH)D) levels ≥50 nmol/l (primary outcome) after vitamin D supplementation in the three groups by intention-to-treat and per-protocol analysis (Numbers, percentages and 95 % confidence intervals)
A significant rise in serum 25(OH)D following supplementation was observed in all the three groups both in ITT and in per-protocol analysis. Significant incremental responses in the mean serum 25(OH)D and percentage increase in serum 25(OH)D levels were observed among the three groups (A–C) (Table 3).
Table 3 Comparison of mean serum levels of serum 25-hydroxyvitamin D (25(OH)D) and parathyroid hormone (PTH) in the three groups by intention-to-treat and per-protocol analysis (Mean values and standard deviations; means and 95% confidence intervals; medians and ranges)
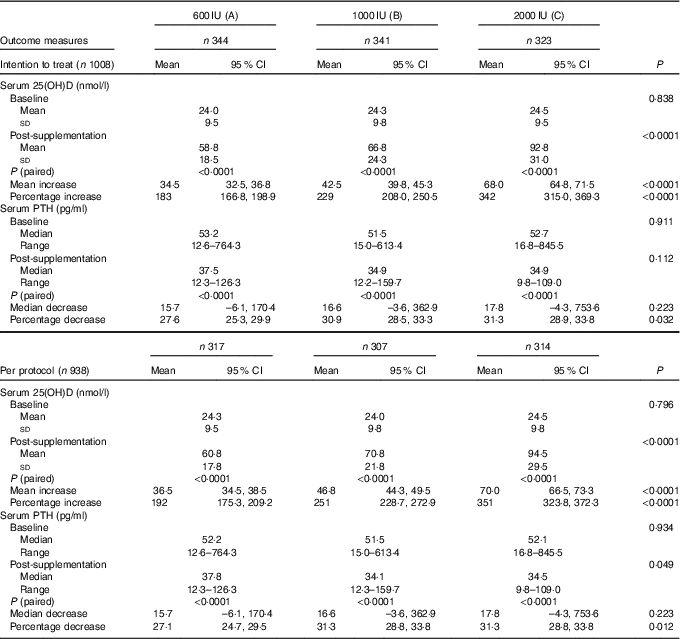
Increase in serum 25(OH)D levels was negatively correlated with age (r –0·045, P=0·169), BMI (r –0·091, P=0·005) and baseline 25(OH)D (r –0·235, P<0·0001). Serum 25(OH)D increase among three groups (means with their standard errors) remained significant even after adjusting for age, BMI and baseline 25(OH)D levels (‘A’: 36·3 (SD 1·3), ‘B’: 46·3 (SD 1·3), ‘C’: 70·8 (SD 1·3)nmol/l; P<0·0001). Serum 25(OH)D increase was significantly higher in pre-pubertal than in post-pubertal children, in girls than in boys and in severe than in mild VDD subjects (Table 4).
Table 4 Parameters affecting changes in 25-hydroxyvitamin D (25(OH)D) and parathyroid hormone (PTH) (Mean values, standard deviations and 95 % confidence intervals)
Serum parathyroid hormone status
The median serum baseline PTH decreased from 52·3 (12·6–845·5) pg/ml (boys: 49·5 (12·6–845·5) pg/ml, girls: 57·3 (16·8–764·3) pg/ml) to 39·8 (9·8–159·7) pg/ml (boys: 33·5 (9·8–159·7) pg/ml, girls: 38·6 (12·3–129·4) pg/ml) following 6 months of vitamin D3 supplementation (P<0·0001). This decrease was observed in all three groups in both ITT and per-protocol analysis categories (Table 3). Secondary hyperparathyroidism (PTH >65 pg/ml) was seen in 31·7 % (320) participants (boys: 25·6 % (150), girls: 40·2 % (170); P<0·0001) at baseline, decreased to 79 (8·4 %) post-supplementation (boys: 7·2 % (39), girls: 10·1 % (40); P=0·075). The median decrease in serum PTH was not significant but the percentage decrease was significant among three groups in both categories (Table 3). Decrease in serum PTH was higher in post-pubertal adolescents than in per-pubertal children, in girls than in boys, in severe than in mild VDD and in those with secondary hyperparathyroidism (Table 4).
Other biochemical parameters
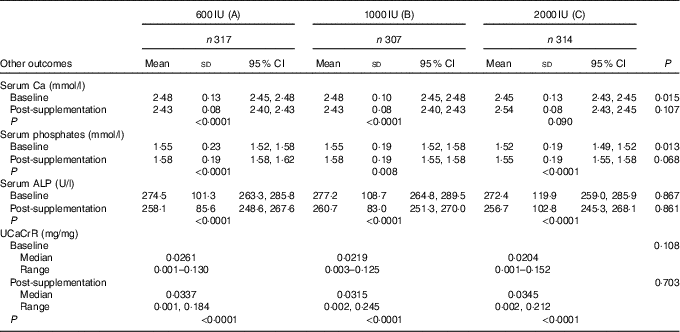
Though the mean serum Ca and ALP decreased while serum phosphate increased significantly post-supplementation, their values were still within normal ranges. The median UCaCrR increased from 0·022 (0·0003–0·152) to 0·032 (0·001–0·245) mg/mg following 6 months of supplementation (P<0·001). The decrease in the serum Ca, ALP and increase in serum phosphates and UCaCrR post-supplementation was no different among the three groups (Table 5). Even though none of the subjects in this study developed hypercalcaemia, two participants from group ‘B’ developed hypercalciuria following supplementation.
Table 5 Showing effect of vitamin D supplementation on serum levels of serum calcium, phosphates, alkaline phosphatase (ALP) and urinary calcium:creatinine ratio (UCaCrR) in the three groups (Mean values, standard deviations and 95 % confidence intervals; medians and ranges)
Discussion
In the absence of universal food fortification with vitamin D, supplementation is an effective alternate strategy to improve serum 25(OH)D status in India, as it has greater specificity of intervention and permits dose adjustment. There are several studies assessing the efficacy of vitamin D3 supplementation in adults( Reference Shab-Bidar, Bours and Geusens 16 ). However, only limited studies are available in children( Reference Sacheck, Van Rompay and Chomitz 17 – Reference Maalouf, Nabulsi and Vieth 25 ). Furthermore, there are even fewer studies assessing the adequacy and efficacy of different daily doses of vitamin D3 supplementation in increasing the serum 25(OH)D levels in children and adolescents with VDD( Reference Talib, Ponnapakkam and Gensure 19 , Reference Rajakumar, Moore and Yabes 20 , Reference Dong, Stallmann-Jorgensen and Pollock 24 ) compared with those without VDD( Reference Sacheck, Van Rompay and Chomitz 17 , Reference Lewis, Laing and Hill Gallant 22 – Reference Dong, Stallmann-Jorgensen and Pollock 24 ).
A report of an expert group from ICMR recommended 400 IU/d of vitamin D daily for Indians of all age groups( 28 ) as against 600 IU/d recommended by IAP( Reference Khadilkar, Khadilkar and Chinnappa 29 ) and IOM, USA( Reference Rosen, Abrams and Aloia 30 ) and several other countries( Reference Balvers, Brouwer-Brolsma and Endenburg 34 ). There is no definite data on how much daily vitamin D is required to prevent VDD and whether recommended daily allowance of 400 or 600 IU/d will suffice to combat widely prevalent VDD in India( Reference Gupta and Gupta 4 ). We, therefore, undertook to supplement a large cohort of schoolchildren with different daily doses of vitamin D and evaluated their adequacy and efficacy. We chose the daily supplementation dose of 600 IU as it is a widely recommended RDA in literature, a higher dose of 1000 IU as per our earlier reported prediction equation( Reference Garg, Marwaha and Khadgawat 7 ) and 2000 IU, as the estimated daily intake of vitamin D shown to achieve serum 25(OH)D levels of ≥50nmol/l in 97·5 % of subjects( Reference Rajakumar, Moore and Yabes 35 ).
The dose-dependent increase in serum 25(OH)D following daily supplementation in consistent with the reports in literature with( Reference Talib, Ponnapakkam and Gensure 19 , Reference Rajakumar, Moore and Yabes 20 , Reference Dong, Stallmann-Jorgensen and Pollock 24 ) or without VDD( Reference Sacheck, Van Rompay and Chomitz 17 , Reference Lewis, Laing and Hill Gallant 22 – Reference Dong, Stallmann-Jorgensen and Pollock 24 ) and with different time durations( Reference Sacheck, Van Rompay and Chomitz 17 – Reference Marwaha, Tandon and Agarwal 26 ). We, in one of our earlier studies evaluating the impact of supplementing milk fortified with 600 and 1000 IU of vitamin D3 in schoolchildren with VDD every day for 12 weeks, showed almost similar increase of 28·6 and 39·2nmol/l, respectively. Likewise, percentages of children (70 and 81 %) who had achieved serum 25(OH)D of ≥50nmol/l with 600 and 1000 IU of vitamin D in our previous study were very similar to that observed in the present study (71·5 and 81·8 %)( Reference Khadgawat, Marwaha and Garg 15 ). Though there is a 3-month difference in the duration of the two studies, a recent study reported little change in the mean serum 25(OH)D levels following 3 or 6 months of daily supplementation( Reference Sacheck, Van Rompay and Chomitz 17 ). Talib et al. ( Reference Talib, Ponnapakkam and Gensure 19 ) from New York (USA), who carried out a study in 183 vitamin D-deficient children (mean age 16·6 (sd 2·2) years) with three doses of 50 000 IU/weekly, 5000 IU/daily and 1000 IU/daily, also observed a dose-dependent mean increase in 60·3, 52·5 and 15·5nmol/l in serum 25(OH)D, respectively.
Dong et al. ( Reference Dong, Stallmann-Jorgensen and Pollock 24 ) compared 400 and 2000 IU given for 16 weeks to forty-nine black boys and girls aged 16·3 (sd 1·4) years with VDD (mean baseline serum 25(OH)D of 34nmol/l) also did show a higher increase with 2000 IU than 400 IU/d. The mean increase in serum 25(OH)D of 60nmol/l with 2000 IU dose was almost similar to the rise in serum 25(OH)D in the present study. Similar observation was made by Al-Shaar et al. ( Reference Al-Shaar, Mneimneh and Nabulsi 21 ) in 336 Lebanese adolescents aged 13 (sd 2) years while studying the impact of low- (200 IU) and high-dose (2000 IU) vitamin D supplementation. The mean baseline serum 25(OH)D increased from 37·5 (SD 17·5) to 90·8 (SD 55·8)nmol/l with 2000 IU and to 46·5 (SD 16·5)nmol/l with 200 IU and the percentage of vitamin D-deficient Lebanese children achieving sufficiency (96 %) after 1 year of supplementation with 2000 IU/d was the same as that achieved in the present study.
Similarly, increase in serum 25(OH)D with increasing doses of vitamin D supplementation in vitamin D-sufficient children was also noted in a recent study by Sacheck et al. ( Reference Sacheck, Van Rompay and Chomitz 17 ) who evaluated the impact of three doses of vitamin D3 on serum 25(OH)D in at-risk schoolchildren where the mean baseline serum 25(OH)D was 55·0 (SD 17·0)nmol/l. In addition, the GAPI (Georgia, Purdue, and Indiana University) trial (multicentre randomised dose–response trial) conducted in children aged 9–13 years, with the mean baseline serum 25(OH)D of 70·0nmol/l and supplementation doses ranging from 400- to 4000-IU/d, also showed a dose-dependent increase( Reference Lewis, Laing and Hill Gallant 22 ).
The response to supplementation in VDD subjects in the present study as well as other studies was significantly greater in terms of rise in serum 25(OH)D levels( Reference Al-Shaar, Mneimneh and Nabulsi 21 , Reference Dong, Stallmann-Jorgensen and Pollock 24 ) as compared with subjects with baseline vitamin D sufficiency( Reference Sacheck, Van Rompay and Chomitz 17 , Reference Lewis, Laing and Hill Gallant 22 ). The response to supplementation with 2000 IU of vitamin D3 per d in the current study (68·0 (SD 31·3)nmol/l) was similar to that reported by Al-Shaar et al. ( Reference Al-Shaar, Mneimneh and Nabulsi 21 ) (60·0nmol/l) and Dong et al. ( Reference Dong, Stallmann-Jorgensen and Pollock 24 ) (52·5nmol/l) in VDD subjects in contrast to not very large rise (26·8nmol/l) in a recent study by Sacheck et al. ( Reference Sacheck, Van Rompay and Chomitz 17 ) and (38nmol/l) in an earlier study by Lewis et al. ( Reference Lewis, Laing and Hill Gallant 22 ) in vitamin D-sufficient subjects. The rise, however, in serum 25(OH)D post-supplementation with 1000 IU in the present study was not only significantly higher than in studies carried out with vitamin D-sufficient subjects (14·5 and 12·5nmol/l)( Reference Sacheck, Van Rompay and Chomitz 17 , Reference Lewis, Laing and Hill Gallant 22 ) but also significantly higher in studies undertaken with VDD subjects (15·5 and 17·3nmol/l)( Reference Talib, Ponnapakkam and Gensure 19 , Reference Rajakumar, Moore and Yabes 20 ). This is possibly due the fact that the baseline serum 25(OH)D levels in the present study subjects was markedly lower than all the studies quoted above. The other possible explanation is the differences in the BMI of subjects as the serum 25(OH)D response is dependent on the vitamin D dose per unit of weight( Reference Garg, Marwaha and Khadgawat 7 ). The mean BMI of subjects in the present study was markedly lower than that reported in other studies( Reference Sacheck, Van Rompay and Chomitz 17 , Reference Talib, Ponnapakkam and Gensure 19 , Reference Rajakumar, Moore and Yabes 20 , Reference Lewis, Laing and Hill Gallant 22 ).
The overall increase of 4·5 (SD 2·5)nmol/l in serum 25(OH)D per 100 IU of vitamin D supplementation in the present study was significantly greater than that of 1·8±2·5nmol/l reported in literature( Reference Rosen, Abrams and Aloia 30 ). It is well known that the increment in serum 25(OH)D levels after vitamin D supplementation is inversely correlated with dose per unit weight( Reference Garg, Marwaha and Khadgawat 7 ), baseline serum 25(OH)D levels( Reference Talib, Ponnapakkam and Gensure 19 , Reference Marwaha, Tandon and Agarwal 26 ), and dose and duration of the study( Reference Shab-Bidar, Bours and Geusens 16 ), which was also observed in present study explains the higher increase in serum 25(OH)D per 100 IU of vitamin D supplementation. Interestingly, a study among fifty-six vitamin D-sufficient children with mean baseline serum 25(OH)D of 72·3 (SD 17·5)nmol/l did not show any further increase in serum 25(OH)D with 1000 IU supplementation for 11 weeks( Reference Putman, Pitts and Milliren 23 ). This finding suggests that our bodies adapt to an increase in serum 25(OH)D as per their requirement following supplementation with vitamin D. Other supplementation studies performed in children with VDD are not comparable as vitamin D supplementation was carried out either weekly( Reference Maalouf, Nabulsi and Vieth 25 ), or fortnightly( Reference Ghazi, Hosseinpanah and Ardakani E 18 ) and monthly doses( Reference Ghazi, Hosseinpanah and Ardakani E 18 , Reference Marwaha, Tandon and Agarwal 26 ).
The results of our study showed that 2000 IU/d of vitamin D were required to achieve the serum 25(OH)D levels of ≥50nmol/l in 94 % of participants. This observation was consistent with what was reported by Rajakumar et al. (35) who showed that 2098 IU of vitamin D/d were needed to maintain serum 25(OH)D levels at 50nmol/l in 97·5 % of US children. A systematic review and meta-analysis from Middle East and North Africa (NENA region) also suggested that a daily dose of 1000–2000 IU of vitamin D will be required to obtain serum 25(OH)D levels of >50nmol/l in the majority of the paediatric population( Reference Chakhtoura, El Ghandour and Shawwa 27 ). These observations raise doubts about the adequacy of current recommendations of 400 IU/d by ICMR or 600 IU/d by IAP and IOM for Indian children and adolescents.
The possible explanations as to why 15·9 % subjects in the present study did not achieve the desired levels of ≥50nmol/l could be higher baseline BMI, lower baseline serum 25(OH)D and higher baseline PTH levels in these study subjects when compared with those became vitamin D sufficient. These children may require either higher supplemental dose of vitamin D or longer duration of supplementation to respond and normalise serum 25(OH)D as has also been observed by several other workers( Reference Shab-Bidar, Bours and Geusens 16 , Reference Maalouf, Nabulsi and Vieth 25 , Reference Romagnoli, Pepe and Piemonte 36 ).
A significant decrease in serum PTH levels as well as decline in the prevalence of secondary hyperparathyroidism was also reported in a study from Middle East( Reference Al-Shaar, Mneimneh and Nabulsi 21 ) and in one of our earlier studies where the decline in secondary hyperparathyroidism was reported from 50 to 7·1 % when VDD children were supplemented with 60 000 IU/month for a period of 6 months( Reference Marwaha, Yenamandra and Ganie 37 ). All these studies had subjects with VDD and high baseline serum PTH levels. In contrast, no significant decrease in serum PTH was recorded in studies carried out in subjects without VDD( Reference Sacheck, Van Rompay and Chomitz 17 , Reference Talib, Ponnapakkam and Gensure 19 , Reference Rajakumar, Moore and Yabes 20 , Reference Putman, Pitts and Milliren 23 ) as these studies had lower serum PTH levels when compared with present study. The fact that the mean decrease in serum PTH was not statistically significant among the three groups, suggests that decrease in serum PTH is not dose dependent as also noticed in other study( Reference Lewis, Laing and Hill Gallant 22 ). Since the mean decrease in serum PTH was significantly higher in participants with severe VDD and those with secondary hyperparathyroidism; it may be hypothesised that children and adolescents in the current study truly represented vitamin D deficiency as opposed to those from west who either did not truly have vitamin D deficiency or had subclinical VDD( Reference Garg and Mahalle 38 ). Those studies were probably conducted to raise serum 25(OH)D levels to >75nmol/l to derive controversial extra-skeletal benefits particularly in paediatric population( Reference Moslehi, Shab-Bidar and Mirmiran 39 ).
Persistence of secondary hyperparathyroidism in 8·4 % subjects despite serum levels of 25(OH)D being ≥50nmol/l may be indicative of either persistent low dietary intake of Ca in them or inability of parathyroid gland to return to it’s normal functioning within 6 months despite achieving adequate levels of serum 25(OH)D. This is similar to what is seen with serum thyroid-stimulating hormone levels remaining suppressed for months despite patient being in remission in Grave’s disease with normal T3 and T4 levels. Possibility of primary hyperparathyroidism is ruled out as none of these subjects had hypercalcaemia( Reference Moslehi, Shab-Bidar and Mirmiran 39 ).
In this study, though serum levels of Ca showed statistically significant decline following vitamin D supplementation with 600 and 1000 IU of vitamin D/d, the levels were still numerically within normal limits. Whether this decrease has any clinical relevance is questionable. Hyperparathyroidism is associated with increase in serum Ca, ALP and decrease in phosphates; hence, improvement in secondary hyperparathyroidism post-supplementation may have led to decrease in serum Ca, ALP and increase in serum phosphates. Significant decrease in serum ALP levels and increase in serum phosphates levels post-supplementation has also been observed in one of our earlier reports( Reference Marwaha, Tandon and Agarwal 26 ). Some other studies have reported no change in serum Ca, phosphates and ALP levels( Reference Sacheck, Van Rompay and Chomitz 17 , Reference Putman, Pitts and Milliren 23 ).
The UCaCrR has shown a wide variation ranging from 0·024 to 0·44 in various geographic areas( Reference Penido, Diniz and Guimarães 40 – Reference El Mallah, Ghattas and Shatila 47 ). Two early studies from India showed a mean ratio of 0·155 and 0·299, respectively( Reference Sorkhi and Haji Aahmadi 48 , Reference Rath, Aggarwal and Mishra 49 ). The median value noted in the present study was 0·022 (0·0003–0·152), which significantly increased to 0·032 (0·001–0·250) post supplementation. The change in UCaCrR in children following vitamin D3 supplementation has not been studied earlier, however, there are conflicting reports in adults( Reference Arthur, Piraino and Candib 50 , Reference Penniston, Jones and Nakada 51 ). Though hypercalcaemia and hypercalciuria always remains a possibility with vitamin D supplementation as reported by Talib et al. ( Reference Talib, Ponnapakkam and Gensure 19 ) in three children following supplementation, there was no case of hypercalcaemia and only two cases of hypercalciuria were detected in the present study. It is also known that hypercalciuria and hypercalcaemia are unrelated with dose and duration of vitamin D supplementation( Reference Talib, Ponnapakkam and Gensure 19 , Reference Malihi, Wu and Stewart 52 ).
The main strength of our study was a large cohort of schoolchildren undertaken for daily vitamin D supplementation and evaluation of UCaCrR to detect hypercalciuria which has been done for the first time in Indian children. We did not advise any change in life style, which can be an important confounding factor and may affect the results of vitamin D intervention. However, exposure to sun( Reference Marwaha, Sreenivas and Talwar 11 , Reference Marwaha, Yenamandra and Sreenivas 12 ) remains an important part of management of both symptomatic and asymptomatic VDD subjects. Possible weaknesses were inability to carry out individual randomisation and evaluate bone formation and resorption markers.
Conclusion
Supplementation of vitamin D with all three daily doses of vitamin D3 (600, 1000, 2000 IU) resulted in significant increase in the serum 25(OH)D levels in schoolchildren with VDD. Children seem to benefit maximum with the daily dose of 2000 IU/d with 94 % achieving serum levels of ≥50nmol/l following supplementation. The rise in serum 25(OH)D was inversely proportional to age, BMI and serum 25(OH)D levels. Whether daily allowance of 400 IU as recommended by ICMR or 600 IU by IAP and IOM, would suffice in children and adolescents with VDD to achieve serum levels of ≥50 nmol/l, remains debatable. Further studies are required to be undertaken before revising the earlier proposed RDA by ICMR, IAP and IOM.
Acknowledgements
The authors gratefully acknowledge USV Private Limited, India, for providing vitamin D3 capsules for the trial. The authors thank Mr D. H. Pai Panandiker, Chairman, and Ms Rekha Sinha, CEO, International Life Sciences Institute (India) for sponsoring the project. The authors highly appreciate the support of the principals, parents and children for participating in this trial. The authors would like to put on record our appreciation for the help rendered by Ms Pamela Marwaha, Dr S. K. Mathur and Ms Neeru Gandhi of Society for Endocrine Health for Elderly, Adolescents and Children for their valuable contribution towards this project.
Nestle R & D, India has provided funds for the study. The funding organisation played no role in the study design; in the collection of data; in the writing of the report; or in the decision to submit the report for publication.
R. K. M. and G. S. – conceptualising the study, clinical evaluation and preparation of manuscript. M. K. G. – designing the study, analysis of data and preparation of manuscript. N. G. – laboratory evaluation of hormones. A. M. – designing the study and preparation of manuscript. N. D. – biochemical evaluation of samples. M. K. – sample size calculations and statistical analysis. M. A. G. – recruitment and clinical evaluation of the subjects. A. N., P. A., A. S., A. C. and R. K. M. – execution of project including sample and data collection, supervision of supplementation in all schools, sample collection and data entry.
The authors declare that there are no conflicts of interest.


