


The development of overweight/obesity is closely associated with numerous inter-related metabolic complications including insulin resistance and dyslipidaemia. These in turn increase an individual’s risk of type 2 diabetes and CVD, prevalence rates of which are rising in congruence with weight trends( Reference Leiter, Fitchett and Gilbert 1 ). Glucose and lipid homoeostasis can be improved through weight loss( Reference Magkos, Fraterrigo and Yoshino 2 ) which is most commonly advised via a modest (daily) continuous energy restriction (CER)( 3 ). Intermittent energy restriction (IER) has received considerable recent interest as an alternative dietary strategy for weight loss and entails intermittent periods of substantial energy restriction interspersed with periods of normal eating( Reference Antoni, Johnston and Collins 4 ).
Previous studies comparing the effects of IER to CER on cardiometabolic risk factors have found them to have equivalent effects on most metabolic outcomes( Reference Harvie, Pegington and Mattson 5 – Reference Trepanowski, Kroeger and Barnosky 7 ). There is some suggestion that IER (2 consecutive days of 70 % energy restriction (ER)) may elicit greater benefits than CER on proxies of hepatic insulin sensitivity( Reference Harvie, Pegington and Mattson 5 , Reference Harvie, Wright and Pegington 6 ), however, no study to date has controlled for the extent of weight loss; a confounding factor from the perspective of metabolic comparisons. In addition, the majority of studies have conducted steady-state assessments, with only fasting blood measurements taken which is not truly representative as humans spend most of their day in a postprandial state; a dynamic, non-steady-state condition. Furthermore, impairments in postprandial glucose and lipid handling are widely regarded as clinically significant CVD risk factors( Reference Levitan, Song and Ford 8 , Reference Jackson, Poppitt and Minehane 9 ) and as such must also be considered within metabolic comparisons. One uncontrolled study by Heilbronn et al. ( Reference Heilbronn, Civitarese and Bogacka 10 ) demonstrated a decline in glucose tolerance after 3 weeks of IER (alternate days of total ER) among healthy and overweight women. However, baseline and post-treatment postprandial assessments were conducted following 12h and 36 h fasting periods, respectively. Prolonged (36 h) fasting intervals are known to impair glucose tolerance( Reference Antoni, Johnston and Collins 11 ), and as such, the observed decline in glucose tolerance may not reflect a true chronic treatment effect. In sum, there is very little known about the effects of IER on postprandial metabolism.
The present study, which was conducted as a randomised controlled dietary intervention in overweight/obese men and women, aimed to compare the effects of IER v. CER on postprandial glucose and lipid responses to a liquid mixed test meal challenge following matched 5 % weight loss. Changes in fasting cardiometabolic disease risk factors, resting energy expenditure (REE) and substrate oxidation were also assessed.
Methods
Participants
Overweight and obese participants (BMI>25 kg/m2) aged 18–65 years were recruited to the study from Surrey (UK). All participants had an elevated waist circumference of >94 cm for men and >80 cm for women. Participants were weight-stable (±2 kg) over the preceding 3 months and had no significant medical history. To control for the potential influence of the menstrual cycle between visits, female participants were either post-menopausal (defined as absence of menses for ≥1 year) or taking oral contraceptives. The study obtained a favourable opinion from the University of Surrey ethics committee (UEC/2014/140/FHMS) and was conducted in accordance with the guidelines laid down in the Declaration of Helsinki. ISRCT registry no.: ISRCTN13687043. The study ran between May 2015 and August 2016.
Sample size considerations
On the basis of our previous acute observations( Reference Antoni, Johnston and Collins 11 ), changes in postprandial lipaemia was selected the primary outcome, with the a priori hypothesis that the relative improvement in lipaemia would be greater following weight loss via IER. As no comparable study has been performed, comparing the effects of IER v. CER following matched weight loss, prospective power calculations were not possible. To assess the possibility of type 2 error, retrospective power calculations were conducted for a secondary outcome measure, postprandial glucose. For the incremental AUC (iAUC) for plasma glucose, retrospective power calculations determined that at a two-sided 0·05 significance level, the study had 80 % power to detect a mean difference of 120 mmol×360 min/l between treatment groups (IER v. CER), based on a pooled standard deviation of 105 mmol×360 min/l.
Study design
The study was a randomised, parallel-armed, comparison between IER and CER. Participants were stratified by age (<42/≥42 years; mid-point of the recruitment range), BMI (<30/≥30 kg/m2), sex, ethnicity and homoeostasis model assessment of insulin resistance (HOMA-IR;<1/≥1) to ensure balanced group allocation, with matched pairs randomly assigned 1:1 to the interventions. The CER intervention served as the ‘standard treatment’ control, compliant with UK National Institute of Clinical Excellence (NICE) obesity guidelines( 3 ).
To control for the degree of weight loss, study measurements were taken at baseline and after participants had attained a 5 % weight loss, a threshold adjudged to have a clinically significant impact on cardiometabolic risk factors( Reference Van Gaal, Mertens and Ballaux 12 ).
Dietary interventions
Estimated energy requirements were calculated using the Henry predictive equation( Reference Henry 13 ) for BMR multiplied by an appropriate physical activity factor based on self-reported occupational and leisure activity levels( 14 ). Healthy eating advice (compliant with UK guidelines) and individualised food portions lists were provided by an appropriately trained study investigator (R. A.). Participants were only informed of the comparison diet once they had completed the study.
Intermittent energy restriction diet
On 2 consecutive days of the week, participants consumed four commercially available LighterLifeTM very-low energy formula-based Food Packs (2638 kJ: 38, 36 and 26 % of total energy as carbohydrate, protein and fat) which delivered approximately 25 % of their estimated euenergetic needs. Consecutive days were chosen to mirror that of previously published work by Harvie et al. ( Reference Harvie, Pegington and Mattson 5 , Reference Harvie, Wright and Pegington 6 ). On the remaining 5 d (feed days), participants’ food intake was self-selected, but they were asked to consume an euenergetic healthy diet. Averaged overall prescribed ER was 22 (sem 0·3) %.
Continuous energy restriction diet
Participants assigned to the CER diet were advised to consume a daily hypoenergetic diet of 2510 kJ below their estimated energy requirements( 3 ). All foods were self-selected by participants. Averaged overall prescribed ER was 23 (sem0·8) %, comparable with the IER intervention.
Laboratory visits
All participants initially undertook a 7-d baseline period during which time they were required to record habitual dietary intakes. At the end of this baseline, participants attended the Surrey Clinical Research Centre for initial measurements. Participants were instructed to abstain from alcohol and strenuous exercise for 48 h before the visit, and were provided with a standardised pasta-based microwaveable meal (2377 kJ, 75 g carbohydrate, 16 g fat, 24 g protein), which they consumed before 20.00 hours on the preceding evening as the macronutrient composition of an evening meal can affect metabolic responses on the following day( Reference Robertson, Henderson and Vist 15 ). Participants arrived at the research unit following a 12-h overnight, water-only fast. Body weight and body composition (estimated by multi-frequency bioimpedance) were recorded using the Tanita BC420MA (Tanita Corp.) alongside measures of waist and hip circumference. After a period of rest, blood pressure measurements were taken in duplicate (UA-767; A&D) and the mean recorded. Following this, fasted resting measurements of energy expenditure and substrate utilisation were taken via indirect calorimetry. An indwelling cannula was then inserted following which the first (fasted) sample was taken. A liquid mixed test meal was provided (400 ml Fortisip; Nutricia: 2510 kJ, 74 g carbohydrate (49 % of total energy), 24 g protein (16 %) and 23 g fat (35 %)) which participants consumed within 5 min. This homogenous liquid meal was used for the purpose of standardisation, to minimise potential variance in postprandial response associated with factors such as cooking/food preparation and chewing rate. In addition, its composition is reflective of the macronutrient proportions of typical western dietary intakes. Serial blood samples were taken at regular intervals over the next 360 min (from the first mouthful) to assess postprandial changes in glucose, insulin, C-peptide, TAG, NEFA and 3-hydroxybutyrate (3-OHB). After the initial visit, both groups commenced their respective diets whilst maintaining habitual activity patterns. Participants returned to the research centre for repeated measurements once the 5 % target was achieved. They consumed the same standardised evening meal and were given identical pre-visit instructions with regards to alcohol and exercise. Participants in both groups abstained from any form of ER for ≥7 d before the repeat study visit to mitigate the effects of acute ER on the metabolic outcomes. Participants did not complete diet diaries during this period; however, intake and weight were regularly reviewed during this period to ensure adherence.
Monitoring and compliance
Participants received fortnightly motivational contact from the study investigators via phone, email and/or texts in addition to monthly face-to-face clinic appointments, where weight was recorded. Every 2 weeks, participants were sent online questionnaires which asked them to self-report their morning fasted weight and, for IER participants, ER-day intakes. A compliant ER day was defined as energy intake ≤3347 kJ, which corresponds to the very-low energy diet threshold defined by NICE( 3 ). The frequency of weight monitoring increased as participants approached their 5 % target. All participants also completed 7-d diet diaries and self-reported physical activity levels midway (about 2·5 % weight loss) and as they were approaching their 5 % weight-loss target
Blood biochemistry
Blood samples were collected into potassium EDTA (for plasma lipid and insulin analysis) and sodium oxalate (for plasma glucose analysis). For the measurement of plasma C-peptide, blood was collected into EDTA containing 200 kallikrein inhibiting units of aprotinin per ml of whole blood. Samples were centrifuged for 15 min at 2500 rpm and separated; aliquots were then stored at −20°C or −80°C (for 3-OHB analysis). Plasma insulin was measured using RIA (Millipore; intra/inter-assay CV 8 and 4 %); C-peptide by RIA (Millipore; intra/inter-assay CV 6 and 8 %); glucose, TAG and NEFA using the ILAB 650 photometric auto-analyser (Instrumentation Laboratory; intra/inter-assay CV all <6 %); and 3-OHB using the Cobas MIRA photometric auto-analyser (Roche; intra/inter-assay CV <5 and <6 %). All samples from an individual participant were included in the same assay.
Indirect calorimetry
REE and substrate utilisation were calculated using data obtained from a gaseous exchange monitor (ISGEM319; GEMNutrition), an open-circuit indirect calorimeter based on the ventilated flow-through technique. Following a 30-min period of rest, measurements were taken over 20 min and in accordance with methodological recommendations by Compher et al. ( Reference Compher, Frankenfield and Keim 16 ). REE was calculated utilising the modified Weir equation( Reference Weir 17 ) and substrate utilisation implied from the RQ (VCO2/VO2). To permit comparisons between individuals of varying body masses, REE was also normalised for estimated metabolically active mass (REE/fat-free mass+18 kg( Reference Ravussin and Bogardus 18 )).
Dietary analyses
All dietary analyses were carried out in Diet Plan 7 (Forestfield Software) using the McCance and Widdowson’s composition of foods integrated data set. Participants recorded 7-d food intake in validated diet diaries( Reference McKeown, Day and Welch 19 ). Intakes were then averaged. Data for participants who did not complete a baseline diary and/or at least one of their two diaries whilst dieting were omitted completely from analyses.
Data manipulation and statistical analyses
AUC (for NEFA and 3-OHB) and iAUC (for all other metabolites) were calculated using the trapezoid method, subtracting the area below baseline for iAUC. LDL-cholesterol was calculated using the Friedewald equation( Reference Friedewald, Levy and Fredrickson 20 ). HOMA-IR and %B were calculated using the HOMA2 online calculator (https://www.dtu.ox.ac.uk/homacalculator/) as proxies for insulin sensitivity and β-cell function, respectively.
Data were statistically analysed using SPSS version 23 (IBM). Data were first checked for normality using the Shapiro–Wilks test, with non-normally distributed data normalised via log transformation where possible to permit parametric testing. The primary analysis was an ANCOVA between the dietary intervention groups with post-treatment values as the dependent variable, and baseline values of each parameter as the covariate. This is recommended statistical method (in terms of bias, precision and power) for the analysis of continuous outcomes in randomised studies with a single post-treatment measurement previously measured at baseline( Reference Egbewale, Lewis and Sim 21 ). Between-group factors which could have influenced study outcomes (age, sex, body fat and metabolic syndrome status) were entered systematically into the outcome models, but none were found to be statistically significant. To then enter all of them at once into the models would have invited spurious results and thus these factors were not included as covariates in the final models. The Mann–Whitney U test was used as the non-parametric alternative to ANCOVA. Differences between intervention groups at baseline were assessed using independent t tests for continuous variables or the χ 2 test for categorical variables. No significant baseline differences were found unless otherwise stated. A paired t test (or non-parametric Wilcoxon’s signed-rank test) was used to assess the change between baseline and post intervention values within each dietary intervention group. Correlations between changes in metabolic and dietary intake variables were explored using Pearson’s (parametric) or Spearman’s (non-parametric) tests as appropriate. Statistical significance was accepted at P<0·05, and a statistical trend at P=0·05–1·0. Summary measures are presented as mean values with their standard errors (for parametric data) or medians and interquartile ranges (IQR, for non-parametric data).
Results
Participant baseline characteristics
Seven participants allocated to the CER intervention did not start the study. Of the forty-one participants (IER=24, CER=17) who started the study, twenty-seven (IER=15, CER=12) attained their 5 % weight-loss target. The consort diagram is presented in Fig. 1.
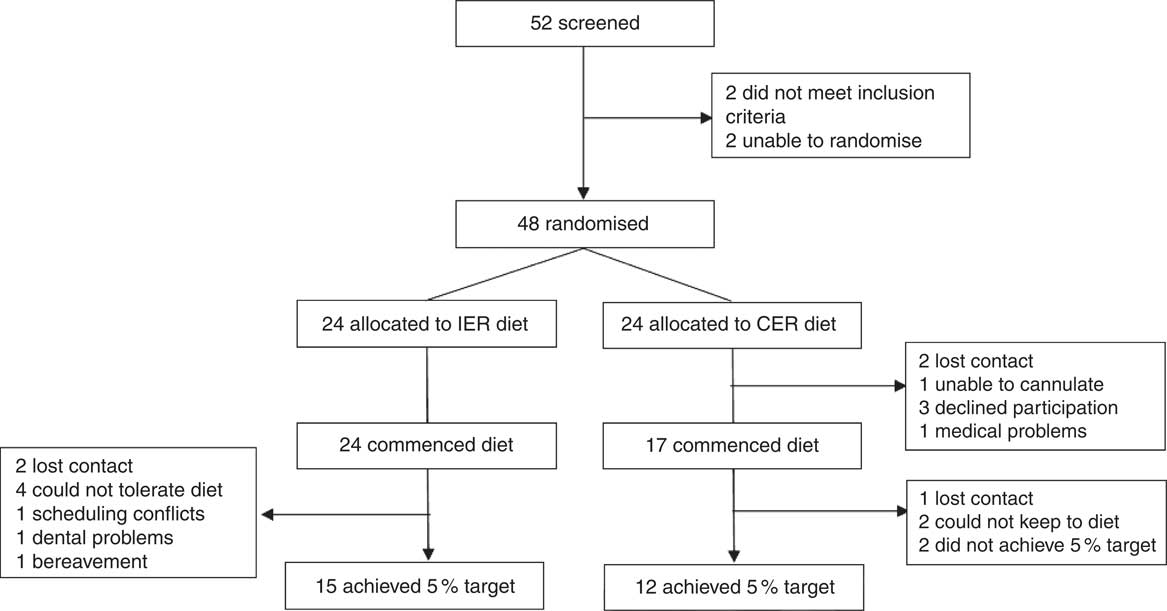
Fig. 1 CONSORT diagram. Matched pairs could not be found for two participants to ensure balanced group allocation and so these individuals were not randomised to an intervention. IER, intermittent energy restriction; CER, continuous energy restriction.
Baseline characteristics of the twenty-seven study completers are presented in Table 1. The groups were matched for age, BMI, adiposity, sex, metabolic syndrome classification and were primarily Caucasian. In all, twelve participants withdrew from the study due to scheduling conflicts (IER=1), bereavement (IER=1), dental problems (IER=1), problems tolerating (IER=4) or adhering to (CER=2) their diet, or were lost to follow up (IER=2, CER=1). Two CER participants were unable to attain a 5 % weight loss within the maximum timeframe (9 months) and so were withdrawn from the study. Non-completers were significantly younger than completers (27 (sem 3) v. 45 (sem 3) years; P<0·001, independent t test), no other significant differences were noted.
Table 1 Baseline characteristics for study completers of the intermittent energy restriction (IER) and continuous energy restriction (CER) interventions (Mean values with their standard errors; numbers of participants)
* Unpaired t test or χ 2 (for ethnicity, metabolic syndrome classification).
† Bioimpedance.
‡ International Diabetes Federation criteria.
Changes in body composition and circumferences
Mean percentage weight loss was 5·3 (sem 0·3) % in the IER group and 5·0 (sem 0·3) % in the CER group (P=0·446, ANCOVA). The accompanying changes in body composition were also comparable between the groups (P≥0·437, ANCOVA) and are reported in Table 2. It took IER participants a median of 59 d (IQR: 41–80) to attain their 5 % weight-loss target and CER participants 73 d (IQR: 48–128), which was not statistically different between groups (P=0·246, Mann–Whitney U test).
Table 2 Body composition before and after 5 % weight loss via intermittent energy restriction (IER) and continuous energy restriction (CER) (Mean values with their standard errors)
a Significant within-group change (P<0·05, paired t test).
* ANCOVA.
† Bioimpedance.
Dietary intakes and physical activity
Changes in dietary intake are reported in Table 3. By the end of the intervention the reductions in energy intake were significantly greater in the IER group (mean difference: 1081 kJ; 95 % CI −1900, −263; P=0·012 ANCOVA, d=1·21), with a similar tendency noted for total carbohydrate intake (mean difference: −28 g; 95 % CI −57, 1; P=0·054 ANCOVA, d=0·90). Adherence to the IER protocol (i.e. 2 substantial ER days/week) was high (93 (sem 4) %), and were most frequently completed on consecutive days (86(sem7) %). Physical activity levels remained stable in both groups across the study.
Table 3 Dietary intakes and physical activity levels at baseline, midway through (2·5 % weight loss) and at the end (nearing 5 % weight loss) of the intermittent energy restriction (IER) and continuous energy restriction (CER) dietary interventions (Mean values with their standard errors of 7 d or 5 feed days)
a,b Significant within-group change: a v. baseline or b between midway v. end time-points (P<0·05, paired t test). (a,b) Within-group trend (P=0·05–0·1).
* ANCOVA.
Fasting biochemistry and physiological markers
Changes in fasting biochemistry and physiological markers are reported in Table 4.
Table 4 Fasting biochemistry and physiological markers before and after 5 % weight loss via intermittent energy restriction (IER) and continuous energy restriction (CER) (Mean values with their standard errors; medians and interquartile ranges (IQR))
HOMA, homoeostasis model assessment; IR, insulin resistance; TOTC, total cholesterol; 3-OHB, 3-hydroxybutyrate; BP, blood pressure; REE, resting energy expenditure; MAM, metabolically active mass; RQ, respiratory quotient.
a Significant within-group change (P<0·05, paired t test or Wilcoxon’s signed-ranks test). (a) Within-group trend (P=0·05–0·1).
* ANCOVA or Mann–Whitney U test.
† n 24 (IER=13, CER=11).
‡ n 23 (IER=13, CER=10).
There were no significant between-group differences for changes in all fasting biochemical measures (all P≥0·147, ANCOVA). Within the IER group, there was a small increase in fasting glucose (P=0·008, paired t test) post-weight loss, whereas a trend in favour of reduced plasma NEFA was also found (P=0·056, paired t test).
The IER group exhibited a significantly greater reduction in systolic blood pressure (mean difference −6 mmHg; 95 % CI −11, −1; P=0·020 ANCOVA, d=1·17), whereas the decreases in diastolic blood pressure were comparable between groups (P=0·691, ANCOVA). A positive relationship between the changes in energy intake and systolic blood pressure was found (r 0·461, P=0·047).
There were no significant differences between groups for changes in REE (P=0·205, ANCOVA), although a trend in favour of a reduction was observed following IER (P=0·058, paired t test). Similar within-group trends were noted when REE was normalised for metabolically active mass, whereas the between-group differences were strengthened (mean difference −7·28 kJ/kg metabolically active mass/d; 95 % CI −15·07, 0·510; P=0·067 ANCOVA, d=0·97).
The relative change in RQ was not significantly different between the two diets (P=0·148, Mann–Whitney U test) although a significant within-group decline in fasting RQ was noted in the IER group (P=0·045, Wilcoxon’s signed-ranks test).
Postprandial lipid metabolism
Postprandial lipid parameters before and after the dietary interventions are presented in Fig. 2, and as averaged hourly iAUC in the online Supplementary Fig. S1. The relative reduction in postprandial TAG was significantly greater following IER v. CER (P=0·045 ANCOVA, d=0·83). The log-transformed mean difference between groups was −0·112 mmol×360 min/l (95 % CI −0·221, −0·003). A trend in favour of a positive relationship between decreases in incremental TAG and RQ was found (r 0·34, P=0·06). For postprandial NEFA, there were no significant between-group differences (P=0·410, Mann–Whitney U test), although, a tendency for reduced NEFA AUC was observed within the CER group (P=0·059, Wilcoxon’s signed-ranks test). No significant between group differences (P=0·618, ANCOVA) or within-group changes (P≥0·248, paired t tests) in postprandial 3-OHB responses were found.
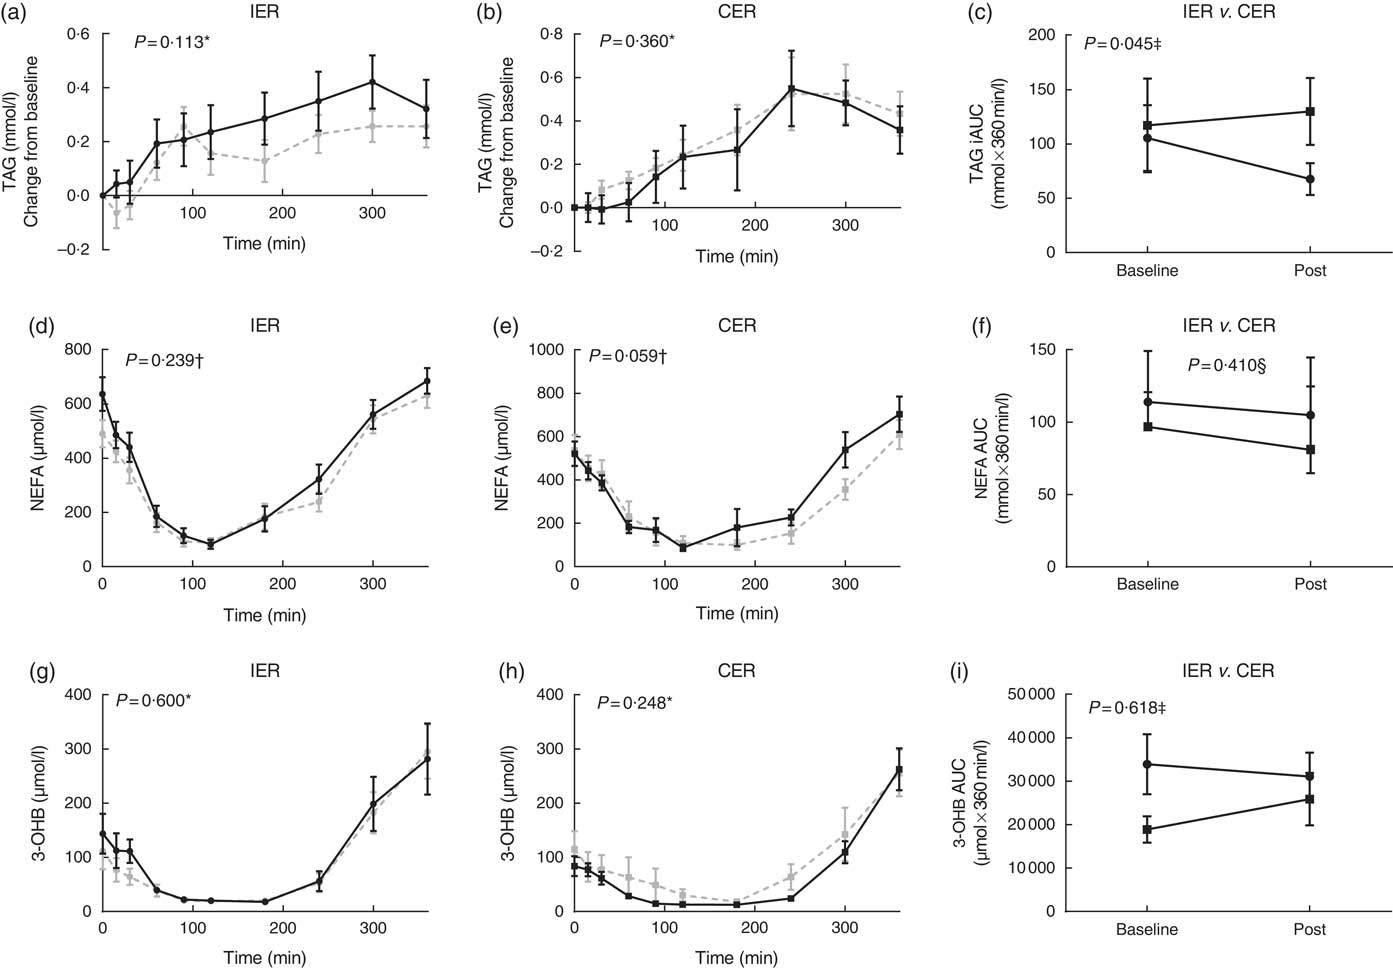
Fig. 2 (a–i) Postprandial lipid indices before and after 5 % weight loss via intermittent energy restriction (IER, ![]() ) and continuous energy restriction (CER,
) and continuous energy restriction (CER, ![]() ). For postprandial graphs: baseline (
). For postprandial graphs: baseline (![]() ) and post-treatment (
) and post-treatment (![]() ). Liquid test meal provided: 2510 kJ, 74 g carbohydrate, 24 g protein and 23 g fat. f: values are medians and interquartile ranges; a–e and g–i: values are means with their standard errors. TAG: n 26 (IER=14, CER=12). NEFA and 3-hydroxybutyrate (3-OHB): n 24 (IER=13, CER=11). Statistical comparisons were conducted on incremental AUC (iAUC) values. * Paired t tests. † Wilcoxon signed-ranks test. ‡ ANCOVA. § Mann–Whitney U test.
). Liquid test meal provided: 2510 kJ, 74 g carbohydrate, 24 g protein and 23 g fat. f: values are medians and interquartile ranges; a–e and g–i: values are means with their standard errors. TAG: n 26 (IER=14, CER=12). NEFA and 3-hydroxybutyrate (3-OHB): n 24 (IER=13, CER=11). Statistical comparisons were conducted on incremental AUC (iAUC) values. * Paired t tests. † Wilcoxon signed-ranks test. ‡ ANCOVA. § Mann–Whitney U test.
Postprandial glucose metabolism
Postprandial glycaemic indices before and after the dietary interventions are presented in Fig. 3. For postprandial glucose responses, no significant between-group differences (P=0·266, ANCOVA) or within-group changes (P≥0·252, paired t tests) were observed. Postprandial insulinaemia was reduced comparatively in both groups (P=0·903, ANCOVA). On the other hand, postprandial C-peptide was reduced following IER but not CER (P trend=0·057 ANCOVA, d=0·81), with a mean difference between groups of −61769 pmol×360 min/l (95 % CI −127 496, 3957).
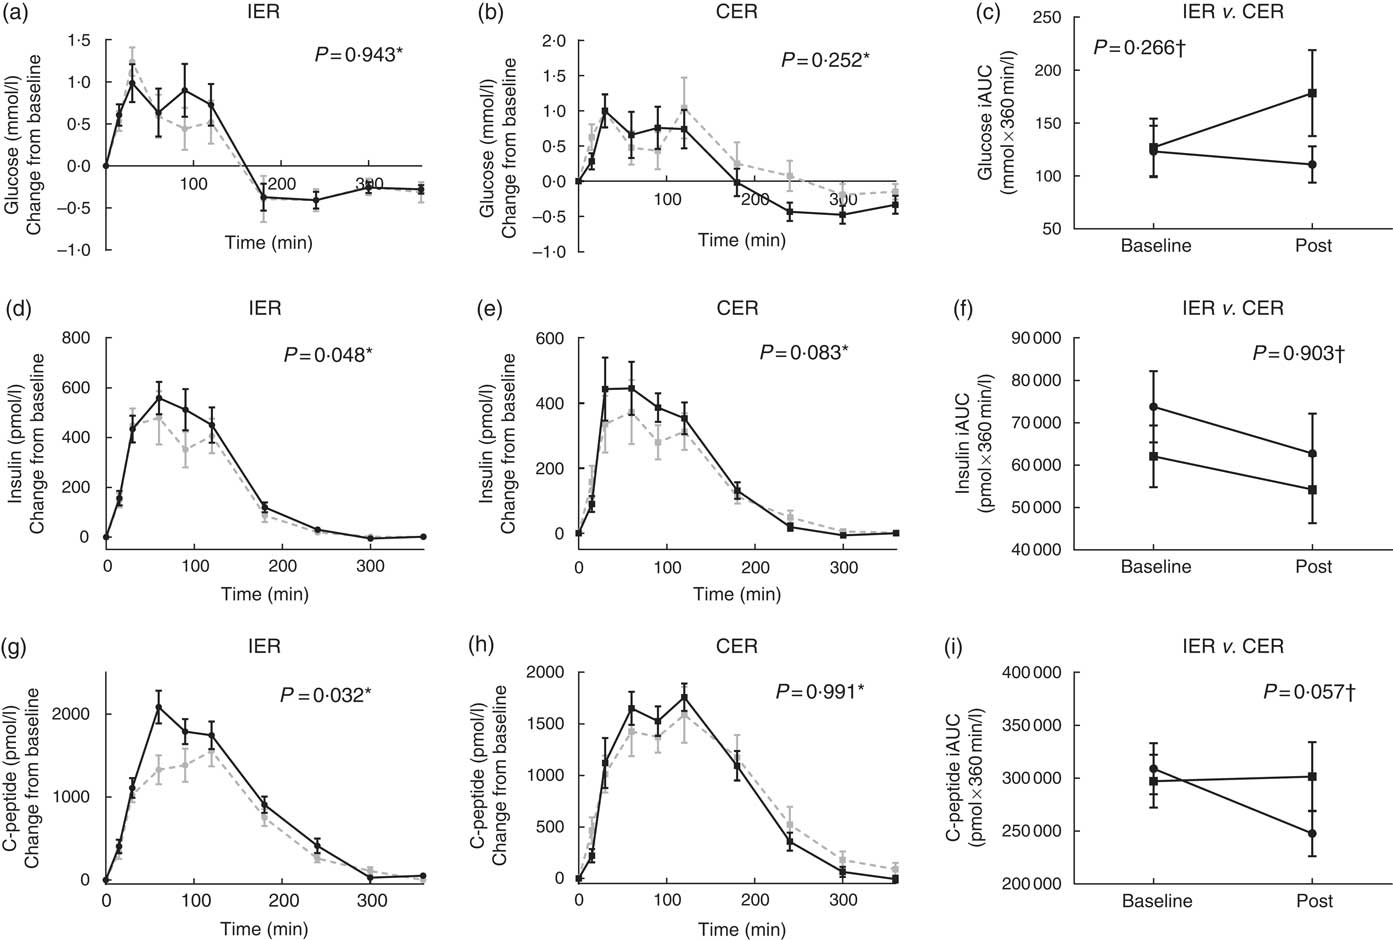
Fig. 3 (a–i) Postprandial glycaemic indices before and after 5 % weight loss via intermittent energy restriction (IER, ![]() ) and continuous energy restriction (CER,
) and continuous energy restriction (CER, ![]() ). For postprandial graphs: baseline (
). For postprandial graphs: baseline (![]() ) and post-treatment (
) and post-treatment (![]() ). Liquid test meal provided: 2510 kJ, 74 g carbohydrate, 24 g protein and 23 g fat. Values are means with their standard errors. n 26 (IER=14, CER=12). Statistical comparisons were conducted on incremental AUC (iAUC) values. * Paired t tests. † ANCOVA.
). Liquid test meal provided: 2510 kJ, 74 g carbohydrate, 24 g protein and 23 g fat. Values are means with their standard errors. n 26 (IER=14, CER=12). Statistical comparisons were conducted on incremental AUC (iAUC) values. * Paired t tests. † ANCOVA.
Discussion
Findings from the present study highlight underlying differences between IER and CER with respect to their effects on postprandial glucose and lipid metabolism following matched 5 % weight loss. These data are novel and as such, there are no directly comparative data in the literature.
In our previous work we have reported that acutely, 1 d of substantial 75 % ER reduced incremental TAG responses by approximately 60 %( Reference Antoni, Johnston and Collins 11 ). Chronically, the present study found approximately 40 % reduction in incremental responses following 5 % weight loss achieved through IER. This finding has the potential to be of clinical importance based on evidence from large prospective cohort studies highlights an independent link between elevated postprandial TAG and CVD risk( Reference Bansal, Buring and Rifai 22 – Reference Lindman, Veierød and Tverdal 24 ). Moreover, postprandial TAG responses have also been shown to predict the presence of coronary artery disease, with one study in adult males finding that the magnitude of lipaemia was approximately 41 % greater among cases v. controls( Reference Patsch, Miesenbock and Hopferwieser 25 ), and has been positively correlated with markers of atherosclerotic progression( Reference Boquist, Ruotolo and Tang 26 ). The mechanisms underlying these associations include the direct interaction between TAG-rich lipoprotein (TRL) remnants and the arterial wall, as well as indirect mechanisms, such as alterations in LDL particle size( Reference Griffin 27 ).
Postprandial assessments were limited to measuring changes in absolute substrate concentrations after a single meal, and which represent the balance but not the rate (or source) of TRL appearance or clearance, and as such their relative contributions cannot be ascertained. There were no significant differences between the dietary groups in changes in postprandial hepatic fatty acid partitioning (3-OHB) or NEFA which might have otherwise explained these findings. Reductions in waist circumference were also comparable between groups, but this cannot differentiate between changes in intra-hepatocellular or visceral stores which can augment postprandial lipaemia by driving increased VLDL–TAG production( Reference Matikainen, Mantta and Westerbacka 28 , Reference Cummins, Watts and Pal 29 ). Interestingly, a within-group increase in whole-body fat oxidation was observed following IER but not CER in the present study, although not statistically different between groups. Nonetheless, it is perhaps not unreasonable to speculate that the repeated substantive periods of ER experienced during IER may have up-regulated pathways associated with fatty acid metabolism and uptake in skeletal muscle and/or adipose tissues, manifesting as changes in basal substrate oxidation and postprandial lipaemia. These preliminary results justify more detailed investigations into the kinetics of TAG metabolism, using targeted methodology.
Although insulin responses to the meal challenge were reduced comparatively following weight loss via both IER and CER, however, using concurrent measurements of both insulin and C-peptide, the study does propose differences between the two weight-loss diets in terms of underlying mechanism. C-peptide undergoes negligible extraction by the liver and constant peripheral clearance, thus making it a more direct marker of insulin secretion than circulating insulin( Reference Castillo, Scheen and Letiexhe 30 ). Following CER, insulinaemia was reduced whereas postprandial C-peptide was unaltered, which suggest an increase in hepatic insulin clearance. By contrast, postprandial C-peptide responses following IER may reveal reduced insulin secretion over the first 2h of the 6-h postprandial period. Although this did not ultimately result in a significant alteration in overall glucose iAUC, the underlying mechanism and biological significance merits further evaluation.
At baseline, approximately half of IER participants were either pre-hypertensive (120–139/80–89 mmHg) or hypertensive (>140–159/90–99 mmHg). Following weight loss, all but one IER participants became normotensive (<120/80 mmHg). In contrast, the proportion of participants who were pre- or hypertensive (approximately 30 %) did not change significantly following the CER diet. The shift observed in the IER group was largely driven by a reduction in systolic blood pressure, which was not significantly altered by CER. A positive relationship was found between the magnitude of the reduction in systolic blood pressure and the degree of ER, which as discussed further in the next paragraph was greater in the IER group. It should be noted that the numerical trends in favour of higher baseline systolic blood pressures within the IER group would have been adjusted for by the ANCOVA statistical method. To date, previously published comparison studies have found no significant differences between the two diets( Reference Harvie, Pegington and Mattson 5 – Reference Trepanowski, Kroeger and Barnosky 7 ); thus, these findings are unexpected and necessitate replication before any conclusions can be drawn and to exclude the possibility of type 1 error.
The time taken to achieve 5 % weight loss was not statistically different between groups, although, the IER group reported greater relative reductions in energy (approximately 1081 kJ/d) driven by under-consumption on ‘feed’ days (where an euenergetic diet was prescribed), which is in accordance with previous research( Reference Harvie, Pegington and Mattson 5 – Reference Trepanowski, Kroeger and Barnosky 7 ). Numerically, IER participants attained their weight-loss target sooner (median 59 v. 73 d). Although type 2 error cannot be disregarded, on the alternate side of the energy balance equation, absolute REE was reduced by approximately 7 % (477 kJ) following IER, but not CER which may have contributed to these discrepancies between the dietary intake data and weight-loss trajectories. Food dietary records are susceptible to under-reporting( Reference Macdiarmid and Blundell 31 ), but this would have affected the validity of dietary records of both groups. These data may also be indicative of subtle alterations in physical activity thermogenesis which could not be captured by the factorial approach implemented by the study. Changes in body composition were comparable between groups, however, when normalised for metabolically active mass, the between-group differences in REE became more pronounced. In the context of the existing literature, our data contrast with Cattenaci’s recent study( Reference Catenacci, Pan and Ostendorf 32 ) which found that weight loss via IER (alternating days of total ER and ad libitum intake) mitigated the adaptive physiological reductions in REE that occur during weight loss. However, the varying dietary protocols do not permit direct comparisons between studies, with one important distinction here being that participants under-consumed on ‘feed’ days so most probably rarely attained energy balance.
There were some important caveats with IER, in that a higher attrition rate was reported among participants who started the intervention. Overall dropout rates were 34 % in the study cohort as a whole, which exceeds that of previous studies utilising analogous 2 ER days per week protocols where rates have ranged from 21 to 23 %( Reference Harvie, Pegington and Mattson 5 , Reference Harvie, Wright and Pegington 6 ). This discrepancy can largely be attributed to the study design, whereby participants were assigned to the diet until a weight-loss target was achieved rather than fixed duration of time. More recently, a study by Trepanowski et al. ( Reference Trepanowski, Kroeger and Barnosky 7 ) of alternate day ER also reported a higher attrition rate among IER participants of 38 v. 29 % among CER participants. Put together, data from ours and Trepanowski’s study do not support the popular notion that IER could prove ‘easier’ to follow than CER, warranting further investigation of the factors that can influence the acceptability of IER amongst the public. Among the twenty-four participants assigned to the CER intervention, only seventeen started. The majority (five) of the seven who did not start either declined to participate or contact was lost. Participants were blinded to the comparison diet which suggests that there was no bias to the IER diet per se, but, the perceived lack of novelty may have contributed to the drop outs in the CER group before commencing the diet.
The main strengths of the study were that weight loss as an independent metabolic confounder, was controlled for, and the study conducted dynamic, concurrent, assessments of postprandial glucose and lipid metabolism in addition to static, steady-state measurements. Limitations include the small sample of both overweight and obese participants which can increase the risk of type 1 and 2 errors, use of bioimpedance, and that postprandial assessments were only conducted following a single meal. Correlation analyses found no relationship between the degree of ER to the degree of change in most outcome measures (with the exception of systolic blood pressure). It should be noted that the absence of a statistical relationship does not rule out the absence of a potential effect of the greater overall ER during IER to study findings. Lastly, physical activity levels were only assessed via the factorial method, which is insensitive to small changes in activity and is unable to differentiate between the various components of energy expenditure.
In summary, our preliminary data suggest that the mode of ER (intermittent but severe v. modest continuous) may have differential cardiometabolic effects, which in turn could be important to long-term disease risk. Differences were observed between the diets, particularly with regards to postprandial lipaemia which was reduced to a greater extent following IER. In addition, these data also reveal distinctions between IER and CER with regards to their effects on insulin secretion dynamics, REE and blood pressure. These data now warrant further investigation utilising targeted methodology, and within distinct population groups such as individuals with morbid obesity and established metabolic disorders. Future studies should implement rigorous controls over energy intake and expenditure to minimise the influence that variances in these factors might have on study outcomes.
Acknowledgements
The authors would like to thank staff at the Surrey Clinical Research Centre for their assistance during the trial, and the participants who completed the trial.
This work was supported by Lighterlife who funded the running costs of the trial and provided the FoodPacks used for the IER intervention. RA was supported by a University of Surrey Prize studentship.
Designed the research: R. A., A. L. C. and M. D. R.; conducted research as study dietitian and analysed the data: R. A.; provided essential materials: K. L. J.; wrote the paper: R. A., K. L. J., A. L. C. and M. D. R.; and primary responsibility for final content: M. D. R.
K. L. J. is Head of Nutrition and Research at Lighterlife.
Supplementary material
For supplementary material/s referred to in this article, please visit https://doi.org/10.1017/S0007114517003890


