


The prevalence of protein–energy wasting (PEW) varies between 18 and 56 % in peritoneal dialysis (PD) patients depending on different assessment tools( Reference Kang, Kang and Choi 1 , Reference Han and Han 2 ). A number of tools are used for the diagnosis of PEW, such as subjective global assessment, analysis of body composition, serum chemistry and body anthropometry( Reference Tennankore and Bargman 3 ). However, the ideal marker of nutritional status in PD patients remains controversial( Reference Kovesdy and Kalantar-Zadeh 4 ).
An expert panel of the International Society of Renal Nutrition and Metabolism suggested the criteria for the clinical diagnosis of PEW in chronic kidney disease patients, which included four categories: serum chemistry; body mass; muscle mass; dietary intake( Reference Fouque, Kalantar-Zadeh and Kopple 5 ). Plasma visceral proteins such as albumin, prealbumin and transferrin have been used to assess the nutritional status separately, and found to be independently associated with mortality in dialysis patients( Reference Kalantar-Zadeh, Ikizler and Block 6 – Reference Bross, Zitterkoph and Pithia 10 ). Serum albumin has been by far the most extensively studied serum protein in the maintenance of dialysis patients. Previous studies have shown that low serum albumin concentration is one of the strongest predictors of outcomes in maintenance dialysis patients( Reference Kalantar-Zadeh, Kilpatrick and Kuwae 11 ). Low serum prealbumin has been shown to be a predictor of mortality even in patients with normal serum albumin concentration, which suggests that it could be used as a bona fide diagnostic tool in conjunction with other biomarkers( Reference Kovesdy and Kalantar-Zadeh 4 , Reference Rambod, Kovesdy and Bross 9 ). Epidemiological studies have indicated the presence of an obesity paradox (i.e. higher BMI is associated with better survival) in dialysis patients( Reference Han and Han 2 ). However, some studies have shown that the protective effects of high BMI are due to higher muscle mass( Reference Beddhu, Pappas and Ramkumar 12 ). Therefore, it has been suggested that it would be better to evaluate BMI and muscle mass simultaneously. Serum creatinine level is used as a surrogate of muscle mass in dialysis patients with poor residual renal function and stable dialysis dose therapy( Reference Patel, Molnar and Tayek 13 ). In addition, total serum cholesterol has been demonstrated as an indicator of malnutrition and associated with mortality in dialysis patients( Reference Kilpatrick, McAllister and Kovesdy 14 ). Although surrogate laboratory measures have a potential prognostic benefit, they should not be used in isolation to diagnose or monitor PEW in PD patients( Reference Tennankore and Bargman 3 ).
The purpose of the present study was to test the hypothesis that combined nutritional parameters, identified by principal components factor analysis, could be a composite nutritional index and associated with mortality in incident continuous ambulatory peritoneal dialysis (CAPD) patients.
Methods
Patients and data collection
This is a retrospective cohort study. Incident CAPD patients at the PD centre of The First Affiliated Hospital, Sun Yat-sen University, Guangzhou, China were enrolled from 1 January 2008 to 31 December 2011. Patients were eligible for entry when they underwent CAPD for at least 90 d and were aged ≥ 18 years at the start of CAPD. Patients who had acute infections at the time of enrolment, had a history of malignancy, transferred from failed renal transplantation or permanent haemodialysis, or had missing data on nutritional indices were excluded from the study. The study was conducted in compliance with the ethical principles of the Declaration of Helsinki (http://www.wma.net/en/30publications/10policies/b3/index.html) and approved by the Human Ethics Committees of Sun Yat-sen University. As part of a larger cohort study, written informed consent was obtained from all the participants.
All data were collected during the first 3 months after initiation of CAPD. Demographic data included age, sex, primary cause of end-stage kidney disease (ESKD) as well as presence of diabetes and CVD (a history of myocardial infarction, angina, congestive heart failure, cerebrovascular event or peripheral vascular disease with or without amputation). Clinical and biochemical data included height, weight, blood pressure, 24 h urine output, albumin, prealbumin, total cholesterol, TAG, creatinine, urea N, Hb, transferrin, high-sensitivity C-reactive protein and measured glomerular filtration rate, which was measured as the mean of urea and creatinine clearance, calculated from 24 h urine collections and indexed for the body surface area. Blood, urine and PD effluent samples were tested in the centre laboratory of The First Affiliated Hospital of Sun Yat-sen University.
Nutritional status was evaluated by BMI and biochemical indices (serum albumin, prealbumin, transferrin, creatinine and total cholesterol). Serum albumin < 38 g/l ( < 3·8 g/dl), serum prealbumin < 300 mg/l ( < 30 mg/dl), total cholesterol < 5·2 mmol/l ( < 200 mg/dl), creatinine < 707 μmol/l ( < 8 mg/dl), transferrin < 2 g/l ( < 200 mg/dl) or BMI < 18·5 kg/m2 was considered as indicative of malnutrition in dialysis patients according to previous studies( Reference Fouque, Kalantar-Zadeh and Kopple 5 , Reference Park, Mehrotra and Rhee 15 – Reference Beberashvili, Azar and Sinuani 18 ).
The primary outcome of the present study was all-cause mortality. All the patients were followed up until cessation of CAPD, death or on 31 December 2013.
Statistical analyses
All data are expressed as means and standard deviations or medians with interquartile ranges. Proportions were calculated for categorical variables. Correlations among variables were analysed using Pearson's correlation test for continuous variables with a normal distribution, or Spearman's correlation test for non-normally distributed variables. The χ2, one-way ANOVA or Kruskal–Wallis test was used to determine the differences in categorical or continuous factors among different categories of factor score. Factor analysis was used to delineate important components that summarise the variation explained by a set of nutritional indicators. Communalities are the part of the variance of the variable that is explained by the factors. Principal components factor analysis was used as the extraction method. The factor analysis retained three uncorrelated factors with eigen values >1. These factors were rotated using a varimax rotation that maintains the statistical independence between the factors (orthogonal rotation), but maximises or minimises factor loadings so as to facilitate the interpretation of the factor. Markers with factor loadings ≥ |0·6| were used to interpret and label the factors. For each subject, factor scores were calculated on each of the three retained factors by summing nutritional indicators of each factor, weighted by their factor loadings. Kaplan–Meier survival analysis and Cox proportional hazards regression analysis were performed to assess the association between the factor scores and mortality. Two-tailed P values < 0·05 were considered statistically significant. All statistical analyses were carried out using SPSS version 16.0 (SPSS, Inc.).
Results
Patient characteristics and outcomes
The recruitment process of the study population is shown in Fig. 1. A total of 885 incident PD patients were included in the present study. The mean age was 47·4 (sd 14·8) years and 59·2 % (n 524) were males. The primary cause of ESKD was chronic glomerulonephritis (59·1 %), followed by diabetic nephropathy (21·8 %) and hypertension (7·1 %). The patients' demographic characteristics, aetiology of ESKD, clinical characteristics and biochemical parameters are summarised in Table 1. All of the patients received the CAPD treatment. Conventional PD solutions (Dianeal: 1·5, 2·5 or 4·25 % dextrose; Baxter Healthcare) were used in almost all of the PD patients with Y sets and twin-bag systems. The median follow-up period was 35 months (interquartile range 24–48 months). During the follow-up period, 131 patients (14·8 %) died of different causes, such as CVD (62·6 %), infection (13·7 %), malignancy (3·1 %), cachexia (3·1 %), other reasons (8·4 %) and unknown causes (9·2 %); 128 patients (14·5 %) received renal transplantation, sixty-seven (7·6 %) were transferred to permanent haemodialysis, seventeen (1·9 %) were lost to follow-up, thirty (3·4 %) were transferred to local PD centres, three (0·3 %) were withdrawn from PD therapy for economic reasons and one for the recovered renal function. By end of the study, 508 patients continued the CAPD treatment.

Fig. 1 Recruitment process of the study population.
Table 1 Baseline characteristics of the study population (Mean values and standard deviations; numbers and percentages; medians and ranges)

mGFR, mean glomerular filtration rate; Kt/V, urea clearance index, used to quantify dialysis treatment adequacy; hs-CRP, high-sensitivity C-reactive protein; iPTH, intact parathyroid hormone.
Nutritional profile and interrelations among the nutritional variables
According to the different assessment indices of malnutrition( Reference Fouque, Kalantar-Zadeh and Kopple 5 , Reference Park, Mehrotra and Rhee 15 – Reference Beberashvili, Azar and Sinuani 18 ), 130 (14·7 %) patients had BMI < 18·5 kg/m2, 439 (49·6 %) had albumin < 38 g/l ( < 3·8 g/dl), 303 (34·2 %) had prealbumin < 300 mg/l ( < 30 mg/dl), 404 (45·6 %) had transferrin < 2 g/l ( < 200 mg/dl), 501 (56·6 %) had total cholesterol < 5·2 mmol/l ( < 200 mg/dl) and 466 (52·7 %) had creatinine < 707 μmol/l ( < 8 mg/dl).
According to Pearson's correlation analysis, albumin was positively correlated with prealbumin (r 0·47, P< 0·01) and transferrin (r 0·41, P< 0·01). Prealbumin was positively correlated with serum creatinine (r 0·39, P< 0·01). Serum cholesterol was negatively correlated with creatinine (r − 0·18, P< 0·01) while positively correlated with transferrin (r 0·14, P< 0·01). BMI was positively correlated with serum creatinine (r 0·09, P< 0·05) and cholesterol (r 0·08, P< 0·05) (see online supplementary Table S1).
The factor analysis identified three factors such as visceral proteins (albumin, prealbumin and transferrin), muscle mass (creatinine) and BMI, which explained 69·95 % of the total variance of the nutritional parameters (Table 2). Communalities ranged from 0·60 to 0·91 for all the nutritional variables, and were highest for BMI (communalities 0·91) and lowest for cholesterol (communalities 0·60).
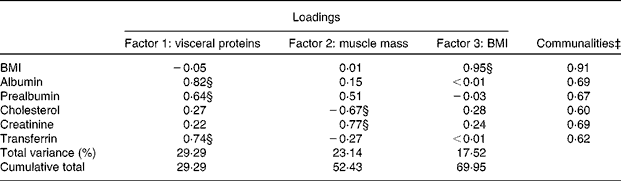
* Extraction method: principal components analysis.
† Rotation method: varimax with Kaiser normalisation.
‡ Proportion of the variance of the specific biomarker explained by the three factors.
§ Loading ≥ |0·60|.
Albumin, prealbumin and transferrin had loadings greater than 0·60 on factor 1, while cholesterol and creatinine showed loadings less than 0·40 on this factor. BMI had a loading of − 0·05 on this factor. Therefore, factor 1 was labelled as ‘visceral proteins’. Serum creatinine had a loading of 0·77, while total cholesterol had a loading of − 0·67 on factor 2. Serum creatinine was a surrogate of body muscle mass, so this factor was labelled as ‘muscle-mass surrogate’. BMI stood apart from these components, had a loading of 0·95 on factor 3, so it was defined as ‘body mass’ factor. Factor scores, which were linear combinations of all the variables weighted by the corresponding factor loadings, were calculated for each subject. The factor score coefficient matrix is presented in online supplementary Table S2.
Distribution and correlates of the ‘visceral proteins’ factor score
Factor scores were standardised variables with a mean value of 0 and a standard deviation of 1. The mean ‘visceral proteins’ factor score was significantly higher with younger age, and among individuals without diabetes (0·189 v. − 0·579 in those with diabetes, P< 0·001), and among individuals without CVD (0·128 v. − 0·178 in those with CVD, P< 0·001). Table 3 presents the distribution of patient characteristics by categories of the ‘visceral proteins’ factor score. The ‘visceral proteins’ factor score were directly related to other parameters of nutritional status, including blood urea N, creatinine, phosphorus and high-sensitivity C-reactive protein.
Table 3 Clinical characteristics by quartiles of the ‘visceral proteins’ factor score (Mean values and standard deviations; numbers and percentages; medians and ranges)

SBP, systolic blood pressure; DBP, diastolic blood pressure; hs-CRP, high-sensitivity C-reactive protein; iPTH, intact parathyroid hormone.
Association of combined nutritional variables with mortality
The associations between the factor scores and mortality are presented in Table 4. In model 1, the higher factor score of ‘visceral proteins’ was significantly associated with decreased mortality (hazard ratio (HR) 0·52, 95 % CI 0·44, 0·61; P< 0·001). The higher factor score of ‘muscle mass’ was associated with lower mortality (HR 0·71, 95 % CI 0·59, 0·87; P= 0·001). In model 2 adjusted for demographic characteristics, co-morbid diseases and variables that were significant in univariate analysis, the lower factor score of ‘visceral proteins’ was associated with higher mortality (HR 0·71, 95 % CI 0·59, 0·87; P= 0·001). In model 3 further adjusted for an inflammation marker, high-sensitivity C-reactive protein, the factor score of ‘visceral proteins’ was still strongly associated with mortality (HR 0·73, 95 % CI 0·60, 0·89; P= 0·002), while there were no significant associations between the other two factors and mortality. According to the quartiles of the ‘visceral proteins’ factor score, the 5-year survival rates were 53·4 % in quartile 1, 71·1 % in quartile 2, 77·3 % in quartile 3 and 85·9 % in quartile 4 (Fig. 2).
Table 4 Associations between the factor scores and mortality (Cox proportional hazards regression analysis) (Hazard ratios and 95 % confidence intervals)
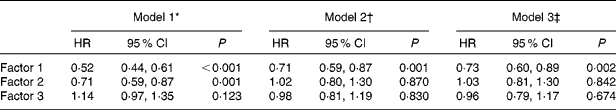
* Model 1 included factor 1, factor 2 and factor 3 scores.
† Model 2 was adjusted for age, sex, presence of diabetes, presence of CVD, 24 h urine output, diastolic pressure, Hb and TAG.
‡ Model 3 was adjusted for variables in model 2 and high-sensitivity C-reactive protein.

Fig. 2 Kaplan–Meier survival curve according to the quartiles of the ‘visceral proteins’ factor score. Log rank 35·058 and P< 0·001.
Discussion
We conducted the principal components factor analysis to delineate important components that summarise the variation explained by a set of nutritional indicators, and to examine their association with mortality. The factor analysis extracted three components such as visceral proteins, muscle-mass surrogate and BMI from the nutritional parameters. The multivariable-adjusted Cox analysis models indicated that the factor score of visceral proteins including albumin, prealbumin and transferrin was independently associated with mortality in incident CAPD patients.
Serum albumin is a 65 000 Da protein with a half-life of 20 d, which functions as a transporter of a variety of circulating molecules and maintains osmotic pressure( Reference Kelman, Saunders and Frith 19 , Reference Rothschild, Oratz and Schreiber 20 ). Prealbumin, also known as transthyretin, is a 54 000 Da protein with a half-life of 2–3 d, which functions as a transporter of thyroxin and a carrier of retinol-binding protein( Reference Spiekerman 21 ). Transferrin is a 90 000 Da β-globulin that combines and transports Fe( Reference Bross, Zitterkoph and Pithia 10 ). These parameters have been demonstrated to be associated with mortality separately in dialysis patients and suggested as the markers of PEW by the International Society of Renal Nutrition and Metabolism consensus committee( Reference Fouque, Kalantar-Zadeh and Kopple 5 , Reference Mehrotra, Duong and Jiwakanon 7 – Reference Bross, Zitterkoph and Pithia 10 ). However, it is well known that these proteins are synthesised in the liver and are also negative acute-phase reactants( Reference Kovesdy and Kalantar-Zadeh 4 ). Thus, it is widely believed that their powerful association with mortality may be secondary to the confounding effects of inflammation status in CAPD patients( Reference de Mutsert, Grootendorst and Indemans 22 – Reference Ooi, Darocy and Pollak 24 ). In the present study, using principal components factor analysis, albumin, prealbumin and transferrin were extracted from the nutritional parameters as a combined visceral protein marker. After excluding patients with acute infection at enrolment and adjusting for high-sensitivity C-reactive protein in the multivariable analysis, which may largely attenuate the confounding effect of inflammation, the ‘visceral proteins’ factor score was still strongly associated with mortality.
As a surrogate of muscle mass( Reference Park, Jin and Molnar 25 ), an elevated serum creatinine concentration may be indicative of good nutritional status. However, it is also a result of the inadequate clearance of small-molecular-weight solutes in ESKD patients( Reference Park, Mehrotra and Rhee 15 , Reference Jager, Merkus and Dekker 26 ). The present results showed a non-significant association between the ‘muscle mass’ factor and mortality existing in an adjusted model, which may be a result confounded by the inadequate clearance of small-molecular-weight solutes due to the loss of renal function and inadequate dialysis( Reference Patel, Molnar and Tayek 13 ). Total serum cholesterol was an indicator of nutritional status. Liu et al. ( Reference Liu, Coresh and Eustace 27 ) reported in their study that the inverse association between the total cholesterol level and mortality in dialysis patients is probably due to systemic inflammation and malnutrition, not to a protective effect of high cholesterol concentrations. In accordance with that study, we did not find a protective effect of high serum cholesterol concentrations due to which it was negatively correlated with creatinine and had a negative impact on the ‘muscle mass’ factor. BMI is an important anthropometric measure used for the assessment of malnutrition. Snyder et al. ( Reference Snyder, Foley and Gilbertson 16 ) found that compared with patients with a normal BMI (18·5–24·9 kg/m2), underweight patients had a higher mortality rate after 3 years of follow-up. However, in the present study, we did not find a significant association between the higher factor score of BMI and better survival. These results may suggest that the obesity paradox should be reconsidered in our CAPD patients. At the same time, we cannot rule out the confounding effects of muscle mass and hydration state.
There are several limitations in the present study. First, as this is a retrospective cohort study, we cannot exclude residual confounding that might dampen or enhance the results presented here. In addition, we did not have other anthropometric measurement data, such as triceps skinfold thickness and mid-arm circumference. Second, we did not include data on the fluid status of patients, which might influence serum albumin concentration and BMI. However, we adjusted for blood pressure and 24 h urine output, which were good indicators of fluid status. Third, we did not use time-varying values that may influence the results. Fourth, as the present data were obtained from a single PD centre, centre-specific effects cannot be excluded.
In conclusion, lower visceral protein concentrations may be independently associated with higher mortality in incident CAPD patients. Simultaneous measurements of serum albumin, prealbumin and transferrin could be helpful in monitoring PEW. The biological mechanisms underlying between ‘visceral proteins’ and mortality need to be further explored.
Supplementary material
To view supplementary material for this article, please visit http://dx.doi.org/10.1017/S0007114514004061
Acknowledgements
The authors thank R. Yang and X. Y. Lin for their assistance in the data collection, all nephrologists and nurses in our PD centre for their excellent management of the PD patients, and L. Y. Hong and X. H. Liu for their assistance in the statistical analyses.
The present study was supported by the Key Clinical Program of the Ministry of Health, China (2010–439), the US Baxter's Renal Discoveries Extramural Grant Program (EGP grant no. 09AP012-OG), the Guangdong Natural Science Foundation of China (9151008901000051, S2011010005077), the National Basic Research Program of China (grant no. 2011CB504000) and the Guangzhou Committee of Science and Technology, China (grant no. 2010U1-E00831). The funders had no role in the design and analysis of the study or in the writing of this article.
The authors' contributions are as follows. R. H. contributed to the study design, data collection, data analysis and in the writing of the manuscript; X. Y. contributed to the study design and reviewing of the manuscript; Y. L. and H. W. participated in the data collection; Q. G., C. Y. and J. L. were involved in the management of the PD patients; Q. Z. performed the data analysis; X. Y. contributed to the editing of the manuscript. All the authors read and approved the manuscript.
There are no financial conflicts of interest to declare.


