


Ageing is associated with physiological and functional declines and an increased risk of malnutrition(Reference Ahmed and Haboubi1, Reference Stuck, Walthert and Nikolaus2). Studies have shown that approximately 25–45 % of community-living elderly are malnourished or at risk of malnutrition(Reference Han, Li and Zheng3, Reference Guigoz4), and up to 80 % of outpatient, hospitalised or nursing home-living elderly are either malnourished or at risk of malnutrition(Reference Guigoz4–Reference Chang, Tsai and Chen7). In older adults, nutritional status has been shown to be associated with functional dependency(Reference Ahmed and Haboubi1, Reference Guigoz4, Reference Saka, Kaya and Ozturk5, Reference Chang, Tsai and Chen7–Reference Zuliani, Romagnoni and Volpato13). Malnourished elderly have increased frequency of hospitalisation, increased length of hospital stay, and increased risk of depression, cognition impairment, poor quality of life or mortality(Reference Guigoz4–Reference Chang, Tsai and Chen7, Reference Chevalier, Saoud and Gray-Donald11, Reference Chan, Lim and Ernest14–Reference Smoliner, Norman and Wagner17).
The Mini-Nutritional Assessment (MNA), a validated and widely used nutritional assessment/screening tool, has been shown to have good sensitivity, specificity and reliability, and is effective for evaluating the nutritional status of the older adults in various living settings(Reference Guigoz4, Reference Guigoz, Lauque and Vellas18, Reference Vellas, Villars and Abellan19). The MNA consists of eighteen items covering four dimensions (anthropometry, dietary assessment, global assessment and self-evaluation)(Reference Guigoz, Vellas, Garry, Vellas, Guigoz, Garry and Albarede20). It has better sensitivity and validity in detecting emerging malnutrition(Reference Guigoz4, Reference Vellas, Guigoz and Garry21) in older adults compared with other single-domain indicators such as BMI, weight loss, energy intake or serum albumin. The MNA has two forms, a long form (or full scale) and a short form. The short form consists only of the first six items of the long form and is intended for pre-screening those who are potentially at risk of malnutrition. Those who are rated ‘at risk’ of malnutrition are further assessed with the rest of the long form. Those who are not rated ‘at risk’ are presumed normal and not further evaluated. The short-form MNA (MNA-SF) generally predicts the long form well under most conditions(Reference Guigoz4, Reference Rubenstein, Harker and Salva22).
The MNA is a multifunctional scale and has been found to have the ability to evaluate the risk of depression, cognition impairment, physical functional decline and mortality in addition to grading the nutritional status of older adults. Several studies have shown that the MNA score is associated with physical functional status(Reference Saka, Kaya and Ozturk5, Reference Wojszel6, Reference Spaccavento, Del Prete and Craca12), and some studies have found that it has a physical functional status-predictive ability(Reference Chang, Tsai and Chen7, Reference Ferdous, Cederholm and Razzaque23, Reference Salvi, Giorgi and Grilli24). However, most of these studies have been conducted in small samples of community-living(Reference Ferdous, Cederholm and Razzaque23), institutionalised(Reference Wojszel6) or hospitalised elderly(Reference Salvi, Giorgi and Grilli24). To our knowledge, no observation has been made in a large population-based sample. Hence, the objective of the present study was to examine the functional status-predictive ability of the MNA in a large population-based, longitudinal study in Taiwan.
Methods
Data and subjects
The study analysed data of the ‘Survey of Health and Living Status of the Elderly in Taiwan’ (SHLSET), a population-based longitudinal cohort study conducted by the Bureau of Health Promotion of Taiwan. The goal of the survey was to gain an understanding of the role of socio-economic, environmental, lifestyle and health care variables on health, well-being and quality of life of older Taiwanese(Reference Chang and Hermalin25, Reference Chang and Hermalin26). The SHLSET employed a three-stage national probability sampling process. Stage 1 was to stratify the Taiwanese population into 361 primary sampling units and, after excluding thirty lightly populated mountainous primary sampling units, randomly selected fifty-six primary sampling units for further sampling. Stage 2 involved proportional-to-size random selection of blocks from the selected primary sampling units and the final stage was to randomly select two eligible persons from each of the selected blocks. A total of 4412 men and women aged 60 years or older were drawn with this process and among them, 4049 completed the first interview (a 91·8 % completion rate) in 1989. Subjects in the cohort were interviewed with a structured questionnaire for eliciting personal data every 3 or 4 years (in 1989, 1993, 1996, 1999, 2003 and 2007). The completion rates ranged from 79·1 to 91·8 %. A second sample of 2462 subjects, 50–66 years old, was drawn from the population with the same procedure in 1996 to extend the cohort to include the young-old. The method and procedure was reviewed and approved by government-appointed representatives. All participants signed an informed consent and subject anonymity was preserved at all times. The detailed sampling process of the survey has been described previously(Reference Tsai, Chang and Wang27).
The 1999 survey had a greater emphasis on diet and nutrition and included data for evaluating subjects' nutritional status and, thus, was chosen as baseline of this analysis. The 2003 survey served as end-point. The present study analysed data of respondents who were ≥ 65 years of age in 1999 and completed both the 1999 and 2003 surveys.
Measurements
We rated the nutritional status of each subject with the long form and short form of a population-specific version (Taiwan version-2) of the MNA, which adopted the Taiwanese-specific anthropometric cut-off points(Reference Guigoz, Vellas, Garry, Vellas, Guigoz, Garry and Albarede20, Reference Tsai, Chang and Wang27) and replaced item R (calf circumference) for item F (BMI)(Reference Tsai, Chang and Wang27). MNA-Taiwan version-2 has been shown to be better or at least equal to MNA-Taiwan version-1 (a normalised version by adopting population-specific anthropometric cut-off points but did not replace item R for F). Data for all items in the long-form MNA (MNA-LF), except items I (pressure sore/skin ulcers) and M (fluid intake), were available in the survey database. So, the MNA was based on fifteen items with a maximum score of 28 points, rather than seventeen items for 30 points. However, the total score was proportionately adjusted on the full-score basis. A final score of 16·5 or less suggests malnourishment; 17–23·5, at risk of malnutrition; and 24 or more, normal. All items in the MNA-SF were available in the questionnaire. The MNA-SF has a maximum score of 14; a score of ≤ 11 suggests at risk of malnutrition and a score ≥ 12 is normal(Reference Guigoz, Vellas, Garry, Vellas, Guigoz, Garry and Albarede20).
Functional status was assessed using a self-reported questionnaire about ADL and IADL adapted from the 1984 National Health Interview Survey Supplement on Aging(Reference Fitti and Kovar28). The following two scores were derived from each scale: one measured difficulty in carrying out the items and the other measured the degree of difficulty on performing the tasks. To assess ADL, participants were asked whether they had difficulty bathing, dressing, transferring, eating, walking or toileting independently. An item that one ‘cannot do independently’ is considered ‘dependent’ for that item. Participants also rated the level of difficulty for performing each of the six items on a scale from 0 to 3 (0, no difficulty; 1, some difficulty; 2, much difficulty; 3, cannot do). Individual scores were summed across each of the six items to yield a total score from 0 to 18, with higher scores reflecting a higher level of ADL difficulty(Reference Johnson, Lui and Yaffe29). To assess IADL, participants were asked whether they had difficulty shopping, handling finances, transporting, housekeeping, using the telephone or doing some heavy housework. As with ADL, two scores were derived from each person.
Statistical analysis
Subjects' baseline characteristics, nutritional status, attrition and the distribution ADL and IADL status were computed with simple statistics. Binary logistic regression analysis was performed to determine the significance of the association of subjects' nutritional scores (both short form and long form) with future ADL and IADL dependency (no ADL or IADL dependency v. ≥ 1 dependency) under two conditions: (1) including all participants (n 2190) regardless of baseline ADL or IADL status and (2) excluding those who were functionally dependent (had ≥ 1 ADL or IADL dependency, respectively) at baseline. All regression models controlled for sex, age, years of formal education, whether living alone, health behaviours (smoking, drinking and physical activity) and whether one had hypertension, heart disease, diabetes, stroke or cancer. All statistical analyses were performed with the SPSS/Windows 15.0 (Statistical Package for the Social Sciences, Chicago, IL, USA) software package. All values were weighting-adjusted according to the study design. Statistical significance for all analyses was accepted at α = 0·05.
Results
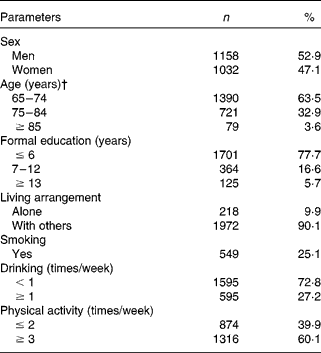
Table 1 shows the characteristics of the subjects at baseline (1999). The study included slightly more men than women. More than half (64 %) were 65–74 years old; only 22 % had ≥ 7 years of formal education; about 10 % were living alone; a quarter were current smokers or drank alcohol; and 60 % had routine exercise ( ≥ 3 times/week). MNA scoring patterns of the subjects are shown in Appendix 1.
Table 1 Characteristics of the subjects at baseline (n 2190)*
(Number of subjects and percentages)
* Values are weighting-adjusted.
† Mean age of the group was 73·36 (SD 5·28) years.
Table 2 shows the mortality rates and functional decline according to baseline nutritional status rated with the MNA and analysed under two conditions, including all subjects or only those who were ADL/IADL-independent. The follow-up 4-year mortality rates were significantly higher for those who were rated malnourished or at risk of malnutrition compared with those who were rated normal. When rated with the MNA-SF, greater proportions of elderly who were rated at risk of malnutrition had ADL/IADL dependency or decline 4 years later compared with those who were nutritionally normal regardless of the regression model. Similarly, greater proportions of those who were rated at risk of malnutrition had higher ADL/IADL scores (greater dependency). When rated with the long form, the results were generally similar to those when rated with the short form, except that the elderly who were malnourished did not have higher scores (or dependency) regardless of the regression model.
Table 2 Distribution of the Activities of Daily Living (ADL) and Instrument Activities of Daily Living (IADL) status of ≥65-year-old Taiwanese at end-point (2003) according to baseline (1999) nutritional status graded with the long-form (LF) and short-form (SF) Mini-Nutritional Assessment (MNA) (Taiwan version-2; T2)†
(Mean values, standard deviations, number of subjects and percentages)

a,b,c Values within the same set with unlike superscript letters were significantly different from each other (P < 0·05; ANOVA and Games–Howell post hoc test, or χ2 and post hoc tests).
*** Values were significantly different from the ‘at risk’ values on the basis of Student's t test or χ2 test (P < 0·001).
† Values are weighting-adjusted.
‡ Defined as having ≥ 1 ADL or IADL dependency, respectively.
§ By excluding those who had ≥ 1 ADL or IADL dependencies, respectively, at baseline.
∥ An update from an earlier report(Reference Tsai, Yang and Wang15).
Table 3 shows the association of baseline nutritional scores rated with the MNA (long form and short form) with the risk of becoming ADL/IADL-dependent 4 years later, adjusted for demographic, socio-economic, lifestyle and health-related variables. Both MNA-LF and MNA-SF significantly predicted functional dependency 4 years later regardless of the conditions examined. The MNA (both forms) did not predict IADL decline (an increase of 3 or more IADL points) in a model including all subjects, but significantly predicted IADL decline in a model that excluded those who had IADL dependency at baseline. The MNA-LF also significantly predicted ADL decline whether the model included all subjects or excluded those who had ADL dependency at baseline. The ability of the MNA-SF to predict ADL decline was marginal.
Table 3 Logistic regression models showing the ability of baseline Mini-Nutritional Assessment (MNA) scores in predicting Activities of Daily Living (ADL) and Instrument Activities of Daily Living (IADL) dependency or functional decline 4 years later*
(Odds ratios and 95 % confidence intervals)

* Values are weighting-adjusted. All models controlled for sex, age, education, alcohol drinking, smoking, physical activity, hypertension, diabetes, heart disease, stroke and cancer status at baseline.
† Defined as having ≥ 1 ADL or IADL dependencies, respectively.
‡ Including all subjects regardless of functional status at baseline (1999). The model also controlled for baseline ADL and IADL status.
§ Excluding subjects who had ≥ 1 ADL or IADL dependencies, respectively.
∥ Defined as an increase in ADL or IADL score ≥ 3 points over baseline.
¶ Excluding those who had ≥ 1 ADL or IADL dependencies, respectively, at baseline.
Discussion
Predicting functional dependency and decline
Previously, we have observed that poor nutritional status (rated with the MNA-LF) is associated with an increased risk of follow-up mortality(Reference Tsai, Yang and Wang15). The present study has further shown that the MNA is able to predict the risk of physical functional dependency or decline (as indicated by ADL and IADL) in older Taiwanese. Numerous cross-sectional studies have observed a strong correlation between the nutritional status and functional status of the elderly in various living settings. Ruiz-López et al. (Reference Ruiz-López, Artacho and Oliva30) observed a correlation between the MNA score and the mobility of institutionalised elderly women rated by the Katz score; and Chevalier et al. (Reference Chevalier, Saoud and Gray-Donald11) observed that malnourishment was correlated with poor physical performance (gait speed) in elderly patients undergoing ambulatory rehabilitation. Poor ADL and IADL status has been found to be correlated with poor nutritional status rated with the MNA in community-living(Reference Ferdous, Cederholm and Razzaque23), institutionalised(Reference Wojszel6, Reference Suominen, Muurinen and Routasalo31) and hospitalised elderly(Reference Oliveira, Fogaça and Leandro-Merhi32).
In several studies involving hospitalised or institutionalised elderly, the MNA has also been observed to have a functional status-predictive ability(Reference Chang, Tsai and Chen7, Reference Ferdous, Cederholm and Razzaque23, Reference Salvi, Giorgi and Grilli24, Reference Cereda, Valzolgher and Pedrolli33). Cereda et al. (Reference Cereda, Valzolgher and Pedrolli33) have shown that the MNA is suitable for grading functional status of institutionalised elderly. Salvi et al. (Reference Salvi, Giorgi and Grilli24) have observed that the MNA-SF is a good and rapid tool for screening the risk of malnutrition in hospitalised, non-surgical older patients, and those who scored ≤ 11 with the MNA-SF had a higher risk of developing functional decline during hospitalisation. Zeyfang et al. (Reference Zeyfang, Rükgauer and Nikolaus34) found that the MNA was able to distinguish healthy and independently living older adults with normal functional status from persons with slightly impaired functions. The present study is the first to observe the future functional status-predictive ability of the MNA in a large population-based sample.
The MNA scale encompasses a relatively large number (eighteen items for the long form and six variables for the short form) of items and the diversity of the items makes the tool multidimensional and multifunctional. The MNA-LF contains items that rate mobility (item C), cognitive status (E) and the ability to live independently (G), self-feed (N), use instrument (Q) and move around (R). In the short-form (Taiwan version-2) version, three (C, E and R) of the six items in the scale evaluate functional ability. These properties contribute to its functional activity-predictive ability and therefore, it can also reflect functional decline.
The MNA seems to predict IADL decline better than ADL decline, perhaps it is because IADL decline generally occurs earlier than ADL decline. The results also suggest that the MNA is a predictor of early functional decline.
The ability of the MNA to predict functional decline is also reflected in ADL and IADL scores. In general, greater proportions of the elderly who were malnourished or at risk of malnutrition at baseline became dependent 4 years later and had significantly higher ADL and IADL scores (poorer status) compared with those who were normal nutritionally. However, it is of interest to note that among those who survived, those who were rated malnourished at baseline did not have higher ADL or IADL scores than those who were rated at risk of malnutrition 4 years later. It is possible that many of those who survived were those who had only temporary illness (the false positives). Their nutritional and functional status would be improved once the condition was treated or corrected.
Short form v. long form in predicting functional decline
The MNA-SF was developed from the MNA-LF as a more time-efficient, nutrition-screening scale. It generally predicts the long form well in rating the risk of malnutrition(Reference Rubenstein, Harker and Salva22). We have also reported that the MNA-LF is quite effective in predicting follow-up mortality(Reference Tsai, Yang and Wang15). The present study has further shown that the short form performed quite favourably compared with the long form in predicting functional decline of the elderly. The short form consists of only six items, one-third of the number of items for the long form, and takes much less time to complete the rating process, especially the Taiwan version-2 (without BMI). Because the short form is more time efficient and easier to execute, it is more likely to be accepted as a routine screening tool in clinical practice and in community geriatric health promotion activities.
Strengths and limitations
The major strength of the present study is that the dataset is from a relatively large population-based longitudinal study, which enables analysing the ability of the MNA to predict functional decline. Also, the results derived from the present study should have good generalisability, applicable to all Chinese populations having similar lifestyle and anthropometric characteristics as the study population. However, there are also limitations. (1) Data are self-reports. Self-reports generally have acceptable quality but error or inaccuracies are inevitable. (2) The number of subjects with dementia, cognitive impairment or mental disability increases with ageing, which may adversely affect the completion rate and the quality of data. (3) Data on pressure sore and fluid intake (two MNA items) are not available and thus may cause a slight under-rating of the risk of malnutrition by the MNA-LF. (4) Results could have been further supported with biomarkers or medical reports. However, no such data are available in the dataset.
Conclusion
Results of the present study suggest that the MNA (both short form and long form), a simple malnutrition screening tool, is also able to predict the risk of functional decline of the elderly. The MNA appears to be a valuable tool for routine screening of the elderly at risk of malnutrition and functional decline, two conditions that occur more frequently during advanced ageing. These two conditions can often have an impact on each other. Routine screening with the MNA might be an effective and efficient way of detecting emerging malnutrition and early signs of functional decline in the elderly.
Acknowledgements
This study is based on the data from the ‘SHLSET’, provided by the Bureau of Health Promotion, Department of Health, ROC (Taiwan). Descriptions or conclusions herein do not represent the viewpoint of the Bureau. The authors declare that they have no competing interests. L.-C. L. performed the analysis and prepared the manuscript. A. C. T. directed the study and reviewed and edited the manuscript.
Appendix 1
Mini-Nutritional Assessment (MNA)-Taiwan version-2 (T2) scoring patterns by elderly Taiwanese (n 2190)*
(Number of subjects and percentages)

* Values are weighting-adjusted.
† In MNA-T2, item R (calf circumference) replaces item F (BMI) in the original MNA and the total score of item Q (mid-arm circumference) is increased from 1 to 2 points, maintaining the same maximum score, 30 points.


