


During the periparturient period, resistance to nematode parasites often breaks down, resulting in increased worm burdens and nematode egg excretion in animals that are immune to parasites when non-reproducing(Reference Barger1). The degree of this periparturient relaxation of immunity (PPRI) to parasites may have a nutritional basis and be sensitive to metabolisable protein (MP) supply(Reference Coop and Kyriazakis2). Periparturient MP supply is often limited due to feeding on low-quality roughage-based feeds or as part of the management system, while at the same time, MP demand is known to increase up to sixfold or more relative to maintenance(Reference Bell, Burhans and Overton3–Reference Jessop5). At times of MP scarcity, expression of acquired immunity to nematode parasites may be penalised because of a prioritised allocation of scarce MP to reproductive functions rather than to immune functions(Reference Coop and Kyriazakis2). Consequently, an increased MP supply would be expected to reduce the degree of PPRI. It has indeed been repeatedly shown that MP supplementation reduces worm burdens and nematode egg excretion in periparturient sheep(Reference Houdijk, Kyriazakis and Jackson6–Reference Kahn, Knox and Walkden-Brown9), although increasing MP supply without overcoming MP scarcity may increase milk yield without reducing worm burdens(Reference Houdijk, Kyriazakis and Jackson10).
The degree of PPRI also varies considerably between small ruminant genotypes with different reproductive outputs (e.g. litter growth) and thus nutrient demands(Reference Houdijk11). For example, under ad libitum feeding on low-quality diets, Scottish Blackface (BF) ewes had a lower degree of PPRI than the more productive cross-bred ewes(Reference Zaralis, Tolkamp and Houdijk12). Likewise, under natural grazing conditions, Horro ewes showed a higher degree of PPRI than less productive Menz ewes(Reference Tembely, Lahlou-Kassi and Rege13, Reference Mukasa-Mugerwa, Lahlou-Kassi and Anindo14). The design of these experiments does not allow to distinguish whether such between-breed differences are due to differences in nutrient scarcity arising from differences in nutrient demand(Reference Houdijk11), or whether they are associated with genetic resistance per se. A lower degree of nutritional demand arising from rearing a smaller number of offspring consistently reduces the degree of PPRI in mammals(Reference Donaldson, van Houtert and Sykes8, Reference Baker, Mwamachi and Audho15–Reference Houdijk, Kyriazakis and Jackson18), and this may account for the above-mentioned between-breed differences. Here, we designed an experiment to test the hypothesis that if the magnitude of PPRI has a nutritional basis only, then the sensitivity of PPRI to MP scarcity would not differ between different levels of reproductive output when feeding is adjusted for associated differences in MP demand. The hypothesis was tested in an experiment using two breeds of sheep with different reproductive outputs and hence nutrient demands, and its outcome could inform on genotype-specific feeding strategies to minimise PPRI.
Materials and methods
Animals and housing
Thirty-six twin-bearing Scottish BF ewes and thirty-six Mule (MU) (Scottish BF × Bluefaced Leicester = MU) ewes, all 4–5 years old, were recruited from a group of pregnant ewes at approximately 56 d before the expected mean parturition date (day0). Their body weight (BW) was 57·6 (sem 0·70) and 69·1 (sem 0·73) kg, respectively, and all had a similar body condition score of 2·65 (sem 0·10) on day− 56. The BF ewes were mated with BF rams, while the MU ewes were mated with Suffolk rams. From day− 56 to day− 25, the ewes were group housed, and they received ad libitum medium-quality hay and 200 g/d per head of commercial ewe nuts (12·5 MJ metabolisable energy (ME)/kg DM and 208 g crude protein/kg DM). From day− 24 until the end of the experiment (day32), the ewes were housed individually in pens sized approximately 1·5 m × 2·0 m. The pens were naturally ventilated and illuminated, with additional low-level lighting at night times during lambing. Fresh wood shavings were used as bedding and added daily, and fresh water was ad libitum available.
The experiment was approved by SAC's Ethical Review Committee (ED AE 25/2007), and was carried under Home Office authorisation (PPL 60/3782).
Feeding treatments
On day− 23, the BF and MU ewes were allocated to one of the two feeding treatment groups (n 18), which were balanced for initial faecal egg count (FEC), BW and condition score. Feeding treatments were calculated to supply 0·8 (low protein (LP)) or 1·3 (high protein (HP)) times the estimated MP requirements (MPr) and 0·9 times ME requirements (MEr) of each breed through restricted feeding. For the estimation of MPr and MEr during pregnancy, we assumed a litter birth weight of 6·6 kg for the BF ewes and 10·3 kg for the MU ewes, as observed in previous studies, no maternal BW gain and 10·2 g MP/d for wool growth(Reference Zaralis, Tolkamp and Houdijk12, Reference Houdijk, Kyriazakis and Jackson19). Expected milk yields were estimated on the basis of previously used or reported values(Reference Houdijk, Kyriazakis and Jackson19–Reference Peart, Doney and Smith21) as 2·4, 2·6, 2·8 and 2·8 kg/d for the BF ewes and 3·0, 3·3, 3·6 and 3·6 kg/d for the MU ewes in weeks 1, 2, 3 and 4 of lactation, respectively. Furthermore, a 10·2 g MP/d for wool growth for both breeds and a BW loss of 80 and 100 g/d were assumed during lactation for the BF and MU ewes, respectively(Reference Houdijk, Jackson and Coop16, Reference Houdijk, Kyriazakis and Jackson18, Reference Houdijk, Kyriazakis and Coop22). BW loss was reduced proportionally to the initial BF:MU BW ratio to obtain expected BW loss for the BF ewes. All MPr and MEr were based on the Agricultural and Food Research Council(4) recommendations. MPr and MEr averaged 85 g/d and 13 MJ/d for the BF ewes and 115 g/d and 18 MJ/d for the MU ewes, respectively, during the last 3 weeks of pregnancy. During the first 4 weeks of lactation, MPr and MEr averaged 237 g/d and 27 MJ/d for the BF ewes and 287 g/d and 32 MJ/d for the MU ewes, respectively.
Daily allowances consisted of approximately one-third of medium-quality hay and approximately two-thirds of concentrates, on as fed basis, during both pregnancy and lactation. The daily feed allowance was gradually increased after parturition over 3 d until the planned lactational allowance was reached. Differences in dietary MP supply were achieved mainly by including xylose-treated soyabean meal at the expense of partially alkali-treated straw in the concentrates, while diets were maintained isoenergetic by varying the barley:fat ratio (for details, see Table 1). Dietary ME content was calculated from the analysed neutral cellulase and gammanase digestibility and acid-hydrolysable ether extract(Reference Thomas, Robertson, Chamberlain, Haresign and Cole23). Dietary MP content was calculated using the Agricultural and Food Research Council(4) recommendations on feeding level effects, and the total diet fermentable ME, effective rumen degradable protein and digestible undegradable protein contents were estimated from feed composition tables. Estimated dietary crude protein content was in agreement with the analysed crude protein content (Table 1), suggesting that targeted dietary MP supply was likely achieved.
Table 1 Ingredient and chemical composition of the diets used during late pregnancy and lactation

LP, low protein; HP, high protein; Soyapass, xylose-treated soyabean meal; DiCal, dicalcium phosphate, 18 % P; CalMAg, calcined magnesite (85 % MgO); Megalac, calcium soap product; NCGD, neutral cellulase and gammanase digestibility; AHEE, acid-hydrolysable ether extract; ME, metabolisable energy; MP, metabolisable protein.
* Hay was offered chopped, while other ingredients were mixed in a mash form.
† Crude protein estimated from Premier Atlas Ingredients Matrix(Reference Hazzledine44).
‡ Metabolisable energy calculated based on NCGD and AHEE values(Reference Thomas, Robertson, Chamberlain, Haresign and Cole23).
§ Metabolisable protein predicted from Premier Atlas Ingredients Matrix(Reference Hazzledine44) using Agricultural and Food Research Council(4) assumptions.
Experimental infection
Because the ewes were 4–5 years old and previously grazed on natural pastures infested predominantly with Teladorsagia circumcincta, they were expected to have substantial prior exposure to this parasite, which is an abomasal nematode of particular concern in temperate regions(Reference Miller and Horohov24). At housing, the backtransformed FEC was 49 (95 % CI 39, 63) and 66 (95 % CI 57, 77) eggs/g for the BF and MU ewes, respectively (P = 0·066). The ewes were treated on day− 56 with levamisole (Levacide, Norbrook, Newry, UK) and ivermectin (Oramec, Merial, Harlow, UK) at the rate of 7·5 and 0·2 mg/kg BW, respectively, to clear any resident worms. The ewes were trickle infected with 10 000 infective T. circumcincta larvae on each infection day. The T. circumcincta strain used was the Moredun Ovine Susceptible Isolate that has been maintained in the laboratory for several years. The infective dose was administered 3 d a week (Monday, Wednesday and Friday) from day− 41 until day32 suspended in water using 10 ml syringes during the morning hours, and this infection model has repeatedly been shown to induce sub-clinical parasitism in periparturient ewes, including in the breeds used in the present experiment(Reference Zaralis, Tolkamp and Houdijk12, Reference Houdijk, Jackson and Coop16, Reference Houdijk, Kyriazakis and Coop22).
Measurements
The ewes were weighed on day− 56 and then weekly from day− 42 onwards, as well as within 12 h of parturition. The lambs were weighed within 12 h of birth and weekly afterwards. Ewe body condition score was measured regularly by lumbar palpation on a zero to five point scale and to an accuracy of a quarter as described by Russel(Reference Russel25).
Since the ewes were fed restrictedly, refusals were not expected. However, whenever refusals did occur, they were collected and weighed twice a week and dried. Average achieved daily DM intakes and associated ME and MP intakes were calculated from the difference between DM offered and refused and the ME and MP yields per kg DM. Furthermore, feed samples were collected every day during the experiment while weighing daily allowances, and were pooled at a treatment group level before chemical analyses.
Faecal egg count and daily nematode egg excretion
FEC, expressed as eggs/g of fresh faeces, was measured at housing and then monitored twice weekly from day− 23 to day32 using a modified floatation method(Reference Christie and Jackson26). Daily nematode egg excretion was assessed during lactation to account for possible effects of breed and feeding treatment on faeces production and thus the potential diluting effect of the latter on FEC(Reference Houdijk11, Reference Vagenas, Bishop and Kyriazakis27). To this effect, faeces production was estimated by using acid-insoluble ash as an internal, indigestible marker. Feed samples were collected every day during lactation while weighing allowances, and were pooled for acid-insoluble ash and DM analyses. Faeces were collected directly from the rectum of all ewes for four consecutive days (day23 to day26), and were pooled per individual ewe and kept frozen at − 20°C before analysis of acid-insoluble ash and DM. Acid-insoluble ash was analysed using the 2 m-HCl procedure as described by van Keulen & Young(Reference van Keulen and Young28), and it was used to calculate total tract DM digestibility (DMd; %). Daily fresh faeces production was calculated using achieved DM intake, faeces DM contents and DMd. Daily nematode egg excretion throughout lactation (eggs/d) was estimated by multiplying FEC (eggs/g) with the calculated fresh faeces production (g/d) for each day. FEC was analysed under the assumption that DMd measured from day23 to day26 can be extrapolated over the whole lactation period, since the ewes were fed the same diet throughout lactation and similar DMd had been observed about day9 and day23 of lactation under similar nutritional protocols(Reference Houdijk, Kyriazakis and Jackson10).
Plasma samples
Blood samples were taken from the jugular vein of the ewes into heparinised vacutainers immediately before infection (day− 41) on two occasions before and two occasions after parturition (for specific dates, see Fig. 5). The plasma was separated by centrifuging for 15 min at 1340 g at 4°C and stored at − 20°C pending analyses. The plasma samples were analysed for plasma urea (mmol/l), plasma pepsinogen (expressed in IU × 1000 per litre as mU/l) and plasma albumin (g/l) concentrations. In addition, the ewes were also monitored for risk of twin lamb disease during late pregnancy with weekly blood sampling to assess β-hydroxybutyrate. Ewes with a β-hydroxybutyrate level above 2 mmol/l were considered at risk for twin lamb disease, and were given propylene glycol as an additional energy source until the β-hydroxybutyrate level was regarded safe.
Statistical analyses
One ewe lost her twins immediately after lambing, and three ewes reared singles because siblings did not survive long after birth. These ewes were excluded from analyses of the lactation part of the experiment.
FEC and nematode egg excretion were log-transformed for statistical analyses, and reported as backtransformed means (with 95 % CI). Data collected during late pregnancy and during lactation were analysed separately because of the distinctness in the quality and quantity of feed offered and the difference in ewe physiological state. Maternal BW loss (g/d) during late pregnancy was estimated as post-parturition BW minus day− 56 BW divided over 56 d. During lactation, average daily gain of ewe and litter (in g/d) was estimated by linear regression. Ewe and litter BW, FEC and nematode egg excretion were analysed using restricted maximum likelihood in repeated-measures ANOVA with power model for correlation within subjects across time, which assumes a tailing-off correlation between repeated measurements as time points between the measurements get wider. Ewe BW measured at the end of pregnancy and immediately post- lambing, litter birth weight, and ewe and litter average daily gain were analysed using a 2 × 2 factorial ANOVA with scaled ewe initial BW being used as a covariate to account for the a priori differences between the BF and MU ewes. Total tract DMd was analysed using a 2 × 2 factorial ANOVA. Plasma constituents taken during late pregnancy (day− 11 and day− 3) and lactation (day7 and day25) were analysed using repeated-measures ANOVA with pre-infection values as covariates. All statistical analyses were performed using GenStat version 11 (Hemel Hempstead, Herts, UK)(29).
Results
During the experiment, all the ewes remained healthy with no signs of clinical parasitism. During the last week of pregnancy, only one ewe had mean plasma β-hydroxybutyrate above 2 mmol/l and was treated with propylene glycol.
DM intake, estimated metabolisable energy and metabolisable protein intakes and faeces production
Achieved DM intake and estimated ME and MP intakes during the experiment are presented in Fig. 1 and Table 2. During both pregnancy and lactation, feeding treatment and the interaction between breed and feeding treatment did not affect achieved DM intake and estimated ME intake (P>0·05). Achieved MP intake differed between the LP and HP ewes, while the interaction with breed indicated that this difference was larger for the MU ewes than for the BF ewes.

Fig. 1 Mean DM intake of twin-bearing and -rearing Blackface (BF) and Mule (MU) ewes, trickle infected with Teladorsagia circumcincta and fed at either 0·8 (low protein, LP) or 1·3 (high protein, HP) times their assumed metabolisable protein requirements during late pregnancy and lactation (sem is very small and cannot be seen on the graph). - -○- -, LP-MU; –○–, HP-MU; - -●- -, LP-BF; –●–, HP-BF.
Table 2 Daily intake of DM, metabolisable energy (ME) and metabolisable protein (MP), and total tract DM digestibility (DMd) of twin-bearing and -rearing Blackface (BF) and Mule (MU) ewes, trickle infected with Teladorsagia circumcincta and fed at either 0·8 (low protein, LP) or 1·3 (high protein, HP) times their assumed MP requirement during late pregnancy and early lactation
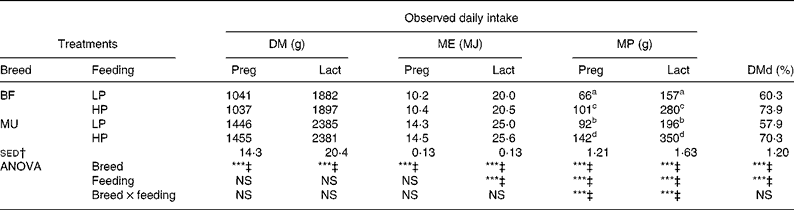
Preg, late pregnancy (day− 23 to day0); Lact, lactation (day1 to day32).
a,b,c,d Mean values within a column with unlike superscript letters are significantly different (P < 0·05).
*** Mean values were significantly different (P < 0·001).
† sed of the interaction term from ANOVA.
‡ NS at P = 0·05.
Faeces DM content was higher for the BF ewes than for the MU ewes (299 v. 283 g/kg; sed 6·10 g/kg; P = 0·01). However, the effect of feeding treatment on faeces DM content was NS (P = 0·714). DMd was higher for the BF ewes than for the MU ewes (67·1 v. 64·1 %; sed 0·82 %; P < 0·001). In addition, the HP ewes had a higher DMd than the LP ewes (72·0 v. 59·0 %; sed 0·82 %; P < 0·001). Estimated fresh faeces production was significantly higher for the MU ewes than for the BF ewes (2797 v. 2024 g/d; sed 96 g/d; P < 0·001) and for the LP ewes than for the HP ewes (3010 v. 2051 g/d; sed 96 g/d; P < 0·001). The breed × feeding treatment interaction was NS for faeces DM contents (P = 0·30), DMd (P = 0·48) and daily fresh faeces production (P = 0·18).
Animal performance
Mean BW of the ewes and their litter is presented in Fig. 2. Ewe BW increased over time for both breeds (P < 0·001), and this increase was higher for the HP ewes than for the LP ewes (P = 0·015). As a result, the HP ewes were heavier than the LP ewes (P = 0·001) at the end of pregnancy, and this increment tended to be higher for the MU ewes than for the BF ewes (breed × feeding treatment interaction; P = 0·070).

Fig. 2 Ewe (a) and litter (b) body weight of twin-bearing and -rearing Blackface (BF) and Mule (MU) ewes, trickle infected with Teladorsagia circumcincta and fed at either 0·8 (low protein, LP) or 1·3 (high protein, HP) times their assumed metabolisable protein requirement during late pregnancy and lactation. - -○- -, LP-MU; –○–, HP-MU; - -●- -, LP-BF; –●–, HP-BF.
Feeding treatment and breed did not interact for post-parturition ewe BW (P = 0·268) and maternal BW loss during late pregnancy (P = 0·258). However, the HP ewes were heavier than the LP ewes (58·7 v. 57·1 kg; sed 0·68 kg; P = 0·025). In addition, during this period, maternal BW loss averaged 82, 39, 147 and 132 g/d for the LP-MU, HP-MU, LP-BF and HP-BF ewes, respectively (sed 18·0 g/d; P < 0·001), with the BF ewes losing more BW than the MU ewes (P < 0·001) and the LP ewes losing more BW than the HP ewes (P < 0·05).
During lactation, the effects of feeding treatment (P = 0·78), breed × feeding treatment (P = 0·53), time and feeding treatment (P = 0·83) and time × breed × feeding treatment (P = 0·65) on ewe BW were NS. However, time interacted with breed (P < 0·001) on ewe BW development. This was reflected in the rate of ewe BW change ( − 174 v. − 111 g/d; sed 18·6 g/d; P = 0·001; for the MU and BF ewes, respectively). Although time did not interact with feeding treatment on BW, the rate of ewe BW change was higher for the HP ewes than for the LP ewes ( − 165 v. − 121 g/d; sed 18·6 g/d; P = 0·023). The interaction between breed and feeding treatment on ewe daily BW loss was NS (P = 0·692). However, expressed per kg post-lambing BW, the difference in daily BW loss between the MU and BF ewes, was reduced and was no longer significant (2·64 v. 2·19 g/kg per d; sed 0·313 g/kg per d; P = 0·154), although the difference between the HP and LP ewes was still significant (2·74 v. 2·09 g/kg per d; sed 0·310 g/kg per d; P = 0·042).
The ewes of both breeds had similar body condition scores on day− 28 (2·43 (sem 0·07)). However, on day− 14, condition scores tended to be lower for the LP ewes than for the HP ewes (2·35 v. 2·46; sed 0·07; P = 0·09), and were higher for the MU ewes than for the BF ewes (2·48 v. 2·3 l; sed 0·064; P = 0·024). Breed and feeding treatment did not interact on ewe body condition scores. During lactation, body condition scores decreased with time (P < 0·001) and were lower for the LP ewes than for the HP ewes (2·08 v. 2·21; sed 0·047; P = 0·008). Furthermore, the MU ewes tended to have higher condition scores than the BF ewes (mean 2·18 v. 2·10; sed 0·048; P = 0·09). The interaction effects of breed and feeding treatment (P = 0·52), time and breed (P = 0·79), time and feeding treatment (P = 0·70) and the three-way interaction of time, breed and feeding treatment (P = 0·181) on ewe condition score were NS.
Feeding treatment and breed interacted for litter birth weight (P = 0·008). Litters from the HP ewes were significantly heavier at birth than litter from the LP ewes in MU only (mean 9·60 v. 8·20 kg; sed 0·266 kg; P < 0·001). The corresponding values for the BF litter were 6·90 v. 6·51 kg (sed 0·215 kg; P = 0·09). The interaction effects of breed × feeding treatment (P = 0·842) and time × breed × feeding treatment (P = 0·94) on litter BW during lactation were NS. However, time and breed (P < 0·001) and time and feeding treatment (P < 0·001) interacted on litter BW. This was reflected in differences in daily litter weight gain; MU litters grew faster than BF litters (615 v. 444 g/d; sed 15·1 g/d; P < 0·001), and HP litters grew faster than LP litters (616 v. 453 g/d; sed 15·1 g/d; P < 0·001). However, the interaction effect of breed and feeding treatment on litter average daily gain was NS (P = 0·93).
Faecal egg count and nematode egg excretion
Fig. 3 shows backtransformed FEC (with 95 % CI). During late pregnancy, the interaction effect of time and breed (P = 0·36), time and feeding treatment (P = 0·34), breed and feeding treatment (P = 0·98) and the three-way interaction effect of time × breed × feeding treatment (P = 0·28) on ewe FEC were NS. However, FEC increased over time (P < 0·001) for all treatment combinations, while on average, the BF ewes had lower FEC than the MU ewes (P = 0·018), and the LP ewes tended to have higher FEC than the HP ewes (P = 0·08).

Fig. 3 Backtransformed faecal egg count (FEC, in eggs/g (epg) faeces) with 95 % CI of twin-bearing and -rearing Blackface (BF) and Mule (MU) ewes, trickle infected with Teladorsagia circumcincta and fed at either 0·8 (low protein, LP) or 1·3 (high protein, HP) times their assumed metabolisable protein requirement during late pregnancy and lactation. - -○- -, LP-MU; –○–, HP-MU; - -●- -, LP-BF; –●–, HP-BF.
During lactation, breed and feeding treatment interactions significantly affected FEC (P = 0·05). The LP feeding treatment increased FEC in the MU ewes (P < 0·001), but not in the BF ewes (P = 0·58). In combination with the aforementioned difference in faeces production, estimated nematode egg excretion during lactation (Fig. 4) was affected by time (P = 0·015), breed (P < 0·001), feeding treatment (P < 0·001) and breed × feeding treatment interaction (P = 0·042). The latter showed that effects of feeding treatment were stronger for the MU ewes (P < 0·001) than for the BF ewes (P = 0·182), as evident in Fig. 4. The interaction effects of time and breed (P = 0·87), time and feeding treatment (P = 0·400) and the three-way interaction effect of time × breed × feeding treatment (P = 0·120) were NS.

Fig. 4 Daily nematode egg excretion (eggs/d with 95 % CI) of twin-rearing Blackface (BF) and Mule (MU) ewes, trickle infected with Teladorsagia circumcincta and fed at either 0·8 (low protein, LP) or 1·3 (high protein, HP) times their assumed metabolisable protein requirement during late pregnancy and lactation. - -○- -, LP-MU; –○–, HP-MU; - -●- -, LP-BF; –●–, HP-BF.
Plasma constituents
Plasma albumin, urea and pepsinogen concentrations are presented in Fig. 5. Pre-infection urea concentration was significantly higher (P = 0·014) for the BF ewes than for the MU ewes, while pre-infection albumin concentration was significantly higher for the MU ewes than for the BF ewes (P = 0·029). Following 2 weeks of trickle infection and immediately before supplementation, albumin concentration had reduced (P < 0·001) and urea concentration had increased by day− 26 (P < 0·001), while these parameters did not differ between breeds when adjusted for the pre-infection values.

Fig. 5 (a) Plasma albumin, (b) urea and (c) pepsinogen concentrations of twin-bearing and -rearing Blackface (BF) and Mule (MU) ewes, trickle infected with Teladorsagia circumcincta and fed at either 0·8 (low protein, LP) or 1·3 (high protein, HP) times their assumed metabolisable protein requirement during late pregnancy and lactation. - -○- -, LP-MU; –○–, HP-MU; - -●- -, LP-BF; –●–, HP-BF.
During the last 2 weeks of pregnancy, albumin concentration was higher for the HP ewes than for the LP ewes (P < 0·001), and this difference diverged over the measurement period with significant time and feeding treatment interaction (P = 0·040). During this period, all other effects including that of breed were NS (P>0·11) on albumin concentration.
During the last 2 weeks of pregnancy, urea concentration was higher for the HP ewes than for the LP ewes (P < 0·001). The MU ewes tended to have higher urea concentration than the BF ewes (P = 0·079). The urea concentration decreased over time (P < 0·001), but none of the interaction effects with time was significant.
During lactation, albumin and plasma urea concentrations were not affected by breed (P>0·27) and breed × feeding treatment interaction (P>0·10). Over time, urea concentration significantly increased (P < 0·001), whereas albumin concentration did not change (P = 0·59). However, feeding treatment significantly affected both albumin and plasma urea concentrations (P < 0·001). Compared with their LP counterparts, the HP ewes had higher albumin concentration (34·1 v. 30·4 g/l; sed 0·50 g/l) and urea concentration (13·4 v. 8·8 mmol/l; sed 0·32 mmol/l).
Mean pre-infection pepsinogen concentration was higher for the MU ewes than for the BF ewes (383 v. 319; sed 29·4 mU/l; P = 0·033). After 2 weeks of trickle infection (on day− 26), pepsinogen concentration increased for both breeds to an overall mean of 1133 (sem 116) mU/l (P < 0·001). In the last 2 weeks of pregnancy, however, pepsinogen concentration was higher for the BF ewes than for the MU ewes (1466 v. 1140 mU/l; sed 166 mU/l; P = 0·023). During this time, the effects of feeding treatment (P = 0·319) and its interaction effect with breed (P = 0·56) on pepsinogen concentration were NS.
During lactation, breed and feeding treatment interacted for pepsinogen concentration (P = 0·025). The LP feeding treatment resulted in a higher pepsinogen concentration compared with HP feeding in the MU ewes only, while the BF ewes fed LP and HP diets had pepsinogen concentrations that were similar to those of the MU-HP ewes. None of the interaction effects of time was significant for pepsinogen concentration (P>0·4).
Discussion
The present experiment was designed to test the hypothesis that if the magnitude in PPRI has a nutritional basis only, then its sensitivity to MP scarcity would not differ between the ewes of breeds with different levels of reproductive output when their feeding is adjusted for differences in MP demand. There were no interactions between breed and feeding treatment on the reproductive performance of the T. circumcincta-infected ewes during lactation. However, the parasitological outcomes rejected our null hypothesis, as we observed significant breed and feeding treatment interactions for worm egg output and plasma pepsinogen during lactation, suggesting that sensitivity of PPRI to MP scarcity was greater for the more productive ewes.
The present experiment was designed to attain, within breed, different levels of MP intake at similar levels of DM and ME intakes, assuming additivity of ME contents from individual diet ingredients. The latter was confirmed by the estimates of ME content based on neutral cellulase and gammanase digestibility and acid-hydrolysable ether extract values that were determined in pooled diet samples collected daily during lactation (Table 1). In addition, the marker-assisted DMd of the LP diet was in good agreement with its estimated ME content, but there was a discrepancy for the HP diet. Its higher observed DMd would be expected to result in approximately 20 % more ME from the HP diet than from the LP diet, which contrasts sharply with estimated ME contents. On the one hand, it might be argued that the in vitro assessment underestimated the in vivo ME yield from the HP diet, as it would not be able to take into account interactions between e.g. diet components, feed intake and metabolic status. However, on the other hand, the observed higher rate of BW change (loss) of the HP ewes compared with the LP ewes would not necessarily be consistent with a considerably higher ME supply from the HP diet compared with the LP diet (see also discussion below). This suggests that achieved ME supply from the HP diets may have been higher than reported, and/or that DMd of the HP diet was overestimated, and as a result, faeces production during lactation of the HP ewes was probably slightly underestimated. However, moderate ME scarcity is unlikely to affect the degree of PPRI(Reference Donaldson, van Houtert and Sykes8), and in view of the very large effects of feeding treatment on FEC and daily egg excretion in the MU ewes (Figs. 3 and 4), it is unlikely that a slightly lower faeces production on HP diets would have affected the outcome of the experiment.
The experiment was also designed to attain a similar degree of MP scarcity for both levels of reproductive output in the two breeds through restricted feeding relative to their respective nutrient demands. This condition was achieved during lactation in both breeds (see below), although during late pregnancy, this was the case for the MU ewes only. Achieved mean litter birth weight was lower and maternal BW loss was higher for the LP-MU ewes than the for HP-MU ewes, while litter birth weight of the HP-MU ewes was lower than the assumed litter birth weight under non-limiting conditions. However, observed litter birth weight of the HP-MU ewes was higher than expected from the degree of dietary ME scarcity imposed. Therefore, additional ME was likely to have been derived from maternal BW loss of the HP-MU ewes, but this did not completely meet the assumed MEr under non-limiting conditions, even taking into account the aforementioned higher digestibility of the HP diet. In contrast, achieved mean litter birth weight and maternal BW loss for the LP-BF and HP-BF ewes did not differ significantly, while mean litter birth weight was not different from the assumed litter birth weight. This occurred with higher rates of maternal BW loss than that observed in the MU ewes, which indicates that ME supply to the BF ewes was likely more than adequate. Consequently, the poorer litter birth weight of the LP-MU ewes compared with the litter birth weight of the LP-BF ewes may have been due to scarcity of both ME and MP. Thus, our hypothesis cannot be tested during the pregnancy phase of the present experiment. In addition, the realisation that breed effects during late pregnancy were at least to some extent confounded with effects of both MP and ME scarcity may explain the limited effect of MP supply on FEC during this stage of reproduction.
The lower litter weight gain in both the LP-MU and LP-BF ewes relative to their HP counterparts indicates that the LP feeding treatment resulted, as intended, in a higher degree of MP scarcity for milk production compared with the HP feeding treatment. The absence of a feeding treatment × breed interaction effect on litter weight gain and ewe daily BW loss along with similar feeding treatment effects on plasma urea and albumin in both the MU and BF ewes supports the view that the degree of MP scarcity achieved for both breeds during lactation was similar. Moreover, the MU and BF ewes had similar rates of relative BW loss during lactation, while for both groups of ewes, the higher rate of relative BW loss was observed on the HP diet. The latter has also been observed in an earlier study(Reference Houdijk, Kyriazakis and Jackson6), and may have arisen from a higher degree of body (fat) reserve mobilisation to sustain a higher level of milk production in the HP ewes than in the LP ewes at the restricted levels of ME intake. Mean litter BW gain of our LP-BF and LP-MU ewes was 78 and 75 %, respectively, of litter BW gain from ad libitum fed, protein-supplemented, non-infected ewes of the same breeds kept under comparable conditions(Reference Zaralis, Tolkamp and Houdijk12). This further supports the view that similar degrees of MP scarcity were achieved for the current BF and MU ewes fed LP diets during lactation, and allowed for our hypothesis to be tested.
Differences in parasitological measurements during lactation were observed only in the MU ewes. The strongly elevated FEC, daily nematode egg excretion and pepsinogen levels for the LP-MU ewes during lactation compared with the HP-MU ewes are consistent with a large body of evidence supporting the view that the degree of PPRI is sensitive to MP scarcity, as reviewed recently(Reference Sykes, Kyriazakis, Ming, Ren and Gao30, Reference Kyriazakis and Houdijk31). FEC is sensitive to dilution by the volume of faeces produced(Reference Houdijk11, Reference Vagenas, Bishop and Kyriazakis27), which in turn depends on variation in daily DM intake, faeces DM content and total tract DMd. Expressing the results in terms of daily nematode egg excretion can account for the effects of the feeding treatments on these parameters. Consequently, although faeces production of the HP ewes may have been slightly underestimated, the effect of MP scarcity on worm egg excretion in the MU ewes was more pronounced than those on FEC (Fig. 4).
The concentration of plasma pepsinogen generally increases at times of expression of immunity to infective T. circumcincta larvae(Reference Zaralis, Tolkamp and Houdijk12, Reference Yakoob, Holmes and Parkins32), and this was also observed here following the start of the trickle infection in both the MU and BF ewes. The rise in plasma pepsinogen concentration is mediated through an increased mucosal permeability, resulting from proteolytic action of mast cell proteases on the tight junctions between the abomasal mucosa cells(Reference Huntley, Gibson and Brown33). Since it has been suggested that abomasal permeability may also correlate with worm burdens(Reference Simpson34), the rise of plasma pepsinogen during pregnancy in both the BF and MU ewes suggests a build-up of infection in both groups of ewes. In addition, the further increased levels of plasma pepsinogen during lactation in the LP-MU ewes may indicate a larger worm burden compared with their HP counterparts, while their MP scarcity may have led to a reduced ability to restore mucosal integrity(Reference Houdijk, Kyriazakis and Jackson10). The reason for the BF ewes to express an elevated level of plasma pepsinogen with low FEC during the last week of pregnancy while the MU ewes showed a temporal change (see Fig. 5) after the feeding treatments were introduced is unclear, but it may be related to stronger response and hypersensitivity to incoming larvae(Reference Huntley, Gibson and Brown33, Reference Smith, Jackson and Jackson35).
The results from the present experiment suggest that MP scarcity may not reduce resistance to parasites in a breed with lower production output. These findings are consistent with those reported by Wallace et al. (Reference Wallace, Bairden and Duncan36, Reference Wallace, Bairden and Duncan37), who observed reduced parasite resistance at times of MP scarcity in Hampshire lambs but not in the slower growing BF lambs, and by Houdijk et al. (Reference Houdijk, Kyriazakis and Jackson18), who noted lack of response to MP scarcity on PPRI in single-rearing ewes but not in twin-rearing ewes. Similarly, under grazing conditions, without any additional supplementation, the less productive Manx Loaghtan and Shetland breeds had very low FEC compared with the heavier and faster growing Southdown breed(Reference Golding and Small38).
The aforementioned pronounced effects of MP scarcity during lactation on plasma pepsinogen, FEC and daily nematode egg excretion for the MU ewes were virtually absent for the BF ewes. Zaralis et al. (Reference Zaralis, Tolkamp and Houdijk12) observed similar effects when assessing the effects of protein supplementation on parasitism in ad libitum fed ewes of the same breeds. However, because both breeds in that study displayed a similar intake of a low-protein basal food, the degree of MP scarcity was calculated to be smaller in the less productive breed used(Reference Zaralis, Tolkamp and Houdijk12). The latter could have explained at least to some extent the lower degree of PPRI observed(Reference Coop and Kyriazakis2, Reference Houdijk, Kyriazakis and Jackson10). In the present experiment, such a confounding effect of breed and MP scarcity was removed through restricted feeding relative to breed-dependent MPr. Since this resulted in the same degree of MP scarcity between the BF and MU ewes, the lower level of FEC, daily nematode egg excretion and plasma pepsinogen concentration during lactation in the LP-BF ewes compared with the LP-MU ewes suggest that resistance to parasites is less sensitive to MP scarcity in the more resistant breed. The aforementioned results reported by Wallace et al. (Reference Wallace, Bairden and Duncan36, Reference Wallace, Bairden and Duncan37) are consistent with this view, while it has also been observed that MP scarcity did not increase periparturient FEC in the ewes genetically selected for low FEC in contrast to their randomly bred counterparts(Reference Kahn, Knox and Gray39).
The BF ewes had lower levels of DM intake than the MU ewes, because feeding level was adjusted for the level of productivity and BW. During lactation, the BF ewes also had faeces with higher DM content and higher total tract DMd than the MU ewes, even though the latter may have been slightly overestimated for the HP ewes of both breeds (see Table 2). With everything else being equal, these factors were expected to put a certain degree of magnification to the FEC of the LP-BF ewes compared with the LP-MU ewes, because of its sensitivity to faecal dilution, as described earlier. The opposite effects observed (Fig. 3) further suggest that the elevated degree of PPRI in the LP-MU ewes is unlikely to be entirely due to the higher level of productivity of the MU ewes per se. Their observed lower resistance could be partly explained by a higher emphasis of allocation of scarce resources to reproductive functions as a correlated response of selection for improved productivity(Reference Rauw, Luiting and Beilharz40, Reference Rauw, Kanis and Noordhuizen-Stassen41). Several levels of scarce MP supply, instead of the single level used here, would be needed to explore this hypothesis further(Reference Houdijk, Kyriazakis and Jackson10). However, it cannot be excluded that the differences observed arise to some extent from genetic differences in immune response per se, as recently demonstrated through micro-array studies on several sheep breeds(Reference MacKinnon, Burton and Zajac42, Reference MacKinnon, Mullarky and Notter43).
The results from the present experiment support the view that differences in periparturient resistance to parasites between breeds with different reproductive outputs may not be completely explained by differences in nutrient demand. Protein scarcity reduced periparturient resistance to parasites only in the more productive breed used. This suggests that using protein supplementation in parasite control strategies that aim to reduce reliance on chemoprophylaxis would be especially relevant for the more productive genotypes.
Acknowledgements
The authors are grateful to Terry McHale, Mairi Mitchell and Dave Anderson for care of the animals and the sampling; Jo Donbavand for body condition scoring and Ian Nevison (Biomathematics and Statistics Scotland) for statistical advice. A. K. is grateful to the Quality Meat Scotland, Meat Promotion Wales (Hybu Cig Cymru) and English Beef and Lamb Executive for funding the postgraduate scholarship. The Scottish Agricultural College receives support from the Scottish Government (Rural and Environmental Research and Analysis Directorate). The original strain of the T. circumcincta larvae used was kindly provided by the Moredun Research Institute. The present paper has resulted from the postgraduate study of A. K. and is part of his PhD thesis. All other authors have contributed equally to the paper. None of the authors has a conflict of interest in relation to the present study.


