


Feeding patterns of children influence their nutritional status, which determines their potential for growth and development. The practice of breast-feeding provides infants with adequate nutrients and immunity from a large number of infections and allergies( Reference Hamosh 1 , Reference Dewey 2 ). Breast-feeding habits are closely related to the risk of illness and death in children under the age of 2 years; they reduce the incidence of common infections such as diarrhoea, otitis media and pneumonia( Reference Heinig 3 ), and are frequently associated with a decrease in the incidence of childhood diabetes, coeliac disease, Crohn’s disease and other pathologies( Reference Davis 4 ). The WHO recommends exclusive breast-feeding of children for the first 6 months of life, and continued breast-feeding for up to 2 years( 5 ).
Data on breast-feeding habits are usually subjective and based on information reported by the mother. The traditional method for evaluation of the quantity of human milk consumed by breast-fed infants is test weighing, where the infant is weighed before and after each feed for several days, but this method is difficult to perform, and can disturb the normal feeding pattern. In 1979, Coward et al. introduced the deuterium oxide dose-to-mother technique, a non-invasive isotope method that does not disturb the normal feeding pattern, and has the advantage in field studies of providing information on the exclusivity of breast-feeding, as well as the volume of milk consumed by breast-fed infants( Reference Butte, Wong and Patterson 6 ). In this method, the mother consumes a known amount of deuterium oxide: water labelled with 2H, a stable isotope of H. The 2H equilibrates with her body water within a few hours. The infant consumes 2H during breast-feeding. If saliva samples are collected from the mother and her infant over a 2-week period, the quantity of human milk ingested by the infant can be calculated and also the amount of water derived from sources other than human milk (i.e. other fluids and complementary foods)( Reference Coward, Whitehead and Sawyer 7 – Reference Haisma, Coward and Albernaz 9 ).
The lipid content of human milk is an important contributor to the energy content, and the most variable macronutrient component. The lipid concentration can be quickly and easily estimated in low-resource settings by measuring the creamatocrit( Reference Lucas, Gibbs and Lyster 10 ). The linear relationship between the calculated energy value and the creamatocrit is owing to the relative constancy of the energy contribution of protein and lactose in human milk( Reference Lucas, Gibbs and Lyster 10 , Reference Ballard and Morrow 11 ).
In Bolivia, 60 % of infants are exclusively breast-fed for 6 months as reported by the National Demographic Health Survey( 12 ), which reports exclusive breast-feeding based in a questionnaire applied to the mother with respect to the last baby born in the previous 5 years. This is one of the highest rates of exclusive breast-feeding in Latin America( Reference Lutter 13 ). At 1 year of age, at least 84 % of infants are breast-feeding with complementary feeding. At 6 months of age, 3·9 % of infants are stunted, but this increases to 16 % by the end of the 1st year, and to 25 % by the child’s second birthday( 12 ). In a systematic review of energy consumption of exclusively breast-fed infants aged 3–6 months, Reilly et al., in longitudinal studies, found that breast milk transfer from mother to baby in exclusively breast-fed infants does not change with age from 3 to 6 months, and most described the pattern of change in intake over time as a ‘plateau’ in milk transfer after 3 months( Reference Reilly, Ashworth and Wells 14 ). Recommendations based on energy expenditure plus energy needs for growth assume that the energy intake of infants is self-regulated and matches energy needs( 15 ).
The aim of this study was to evaluate the relationship between infants’ nutritional status and the volume, and lipid content of human milk consumed by breast-fed infants in Bolivia.
Methods
A quantitative, observational, cross-sectional study was conducted including mothers and their infants between 2 and 6 months of age, living in peri-urban areas of La Paz city, Bolivia. This study was reviewed and approved by the Research Ethic Commission of National Bioethical Committee (CEI-CNB) of Bolivia. All study participants provided individual informed consent. Exclusively breast-fed infants born at term with appropriate weight for gestational age were included. Exclusion criteria included mothers with lactation difficulties (e.g. mastitis), taking medications and acute illness of the mother or child during the period of the protocol.
A convenience sample was recruited from mothers attending educational meetings at the Center for Popular Culture (CCP). A total of eighteen mother/baby pairs were evaluated. The infants were divided into two groups for assessment of growth faltering: infants in group 1 were under 120 d old and those in group 2 over 120 d old, according to Simondon et al.( Reference Simondon, Gartner and Berger 16 ) and Victora et al.( Reference Victora, de Onis and Hallal 17 ) considerations.
Anthropometry
Infants were weighed without clothes to the nearest ±0·01 kg using a paediatric electronic scale (Seca 745; SECA Deutschland). The length of the child was measured to the nearest ±0·2 cm using a calibrated mobile baby measuring mat (Seca 417; SECA Deutschland). z Scores were calculated using the WHO ANTHRO 3.0 software.
Mothers were weighed without shoes but with minimal clothes using an electronic scale accurate to 0·1 kg (Seca 882; SECA Deutschland). Maternal height was measured to the nearest mm using a portable stadiometer (Seca 217; SECA Deutschland).
Measurements of human milk intake
Human milk intake was measured using the dose-to-the-mother deuterium-oxide turnover technique (protocol International Atomic Energy Agency (IAEA), 2010)( 8 ). On the 1st day of the study (day 0), mothers and their infants came to the institute for anthropometry measurements and administration of the dose of deuterium oxide to the mothers. The weight of the mother and her infant was measured before the dose of deuterium oxide was given to the mother. The infant was also weighed at the end of the protocol at the institute (day 14).
2H dose administration and collection of saliva samples
Deuterium oxide (99·8 %, sterility tested) was obtained from Sercon Ltd. Each mother received an accurately weighed dose of 30 g of deuterium oxide.
Baseline samples of saliva were collected from the mother and her baby before administration of the dose. A researcher (N. U.) visited the mothers’ home to collect further saliva samples from mothers and babies 1, 2, 3, 4, 13 and 14 d after dose administration. Saliva samples were collected at least 30 min after the last meal in the mothers, and at least 15 min after the last feed in the infants. All samples were transported to the laboratory and stored −20°C until analysis.
Analysis of 2H enrichment and calculation of human milk intake
The 2H enrichment of saliva samples was determined using a Fourier transform infrared (FTIR) spectrometer (model 4100; JASCO International Co. Ltd.), as described in the protocol provided by IAEA( 8 ).
Data were fitted to the model described by Haisma et al., using a spreadsheet template that was downloaded from the IAEA Human Health Campus (https://nucleus.iaea.org/HHW/Nutrition/MilkIntake/index.html). The spreadsheet uses the ‘Solver’ add-in of Microsoft Excel to fit the model to the data using the method of least squares (Fig. 1). The total error is a measure of how well the modelled curves fit the data, and is the square root of the total mean square error for the mother and her infant. A total error of <60 is considered acceptable, when 2H enrichment is measured by FTIR spectrometry( Reference Slater 18 ).
Lipid content of human milk
Freshly expressed small mid-feed samples (5–10 ml) of human milk were collected by mothers at home, 3–5 min after the onset of nursing from one breast( Reference Neville 19 ), three times in 1 d (morning, afternoon and night). Each milk sample was mixed well and divided into two aliquots. The first aliquot was analysed, and a second aliquot was mixed with the other two samples before analysis. All samples were analysed within 24 h of collection.
A micro-centrifuge (model CH 24; Rolco SRL), glass capillary tubes and a microhematocrit reader were used. Milk was drawn by capillarity into microhaematocrit tubes from a well-mixed sample. The tubes were sealed at one end with clay (Critoseal) and centrifuged at 12 000 rpm for 15 min. The cream column separated from milk by centrifugation was measured with the microhematocrit reader. The creamatocrit was determined from the length of this cream column and expressed as a percentage of the length of the total milk column. All creamatocrit measurements were recorded three times and the averaged values were used for data analysis. Lipid content was calculated from the creamatocrit using the following equation( Reference Lucas, Gibbs and Lyster 10 ):
 $${\rm Milk}\,{\rm fat}\,\left( {{\rm g}\,/\,{\rm l}} \right)\,{\equals}\,\left( {\,\%\,\,{\rm cream}-0\!\cdot\!59} \right)\,\,/\,0\!\cdot\!\!146.$$
The energy content of human milk was estimated using the following equation( Reference Lucas, Gibbs and Lyster 10 ):
 $${\rm kcal}\,{\equals}\,\left( {290{\plus}668} \right)\,{\times}\,\%\,\,{\rm cream}{\rm .}$$
Statistical analysis
Statistical analysis was performed using SPSS 18.5 for windows (SPSS Inc.). The results are quoted as means and standard deviations. A Shapiro–Wilk W normality test was performed. Independent two-sample t tests were used to assess the significance of the difference between means. Significance was determined at the 95 % confidence level (P<0·05). Mann–Whitney U test and Wilcoxon’s tests were used to determine difference between two independent small samples that were not normally distributed. The linear correlation between variables was determined using Pearson’s correlation coefficient (r).
Results
All variables, except length-for-age z score (LAZ), were normally distributed based on the Shapiro–Wilk W normality test (>0·90). A total of eighteen mother/baby pairs were included in the analysis; the maternal age was 28·8 (sd 5·9) years and infant’s age was 3·1 (sd 1·6) months, and in the younger group the mean age was 2·2 (sd 0·4) and in the older group it was 5 (sd 0·8) months.
Anthropometric characteristics
The anthropometric characteristics of the mothers and infants are summarised in Table 1. Mothers’ BMI was 25·7 (sd 4·5) (19·7 to 35·8). According to the WHO classification( 20 ), the nutritional status of 50 % of mothers is considered adequate: 17 % were overweight and 33 % obese.
Table 1 Mother/baby pairs anthropometric characteristics (Mean values and standard deviations)
Infants’ weight-for-length z score was 0·2 (sd 0·7) (17/18 between −1 and +1, 1/18>+1) and BMI-for-age z score was 0·04 (sd 0·7), and thus none of the infants were malnourished. The mean LAZ was −0·6 (sd 0·9) (7/18 between −2 and −1, 10/18 between −1 and +1 and 1/18>+1) for all infants.
In infants younger than 120 d, LAZ was −0·3 (sd 0·7) (1/9<−1, 4/9 between −1 and 0, 4/9 between 0 and +1), and in infants older than 120 d it was −0·8 (sd 1·1) (6/9 between −2 and −1, 2/9 between −1 and 0 and 1/9>+1). This is illustrated in the box plot in Fig. 2. In the younger group, one infant was mildly stunted (LAZ <−1), but in the older group 6 infants had LAZ <−1. Because of the small group size, LAZ was not normally distributed, and thus we decided to use non-parametric statistics, finding a significant difference (P=0·009), with the older group showing signs of growth faltering.
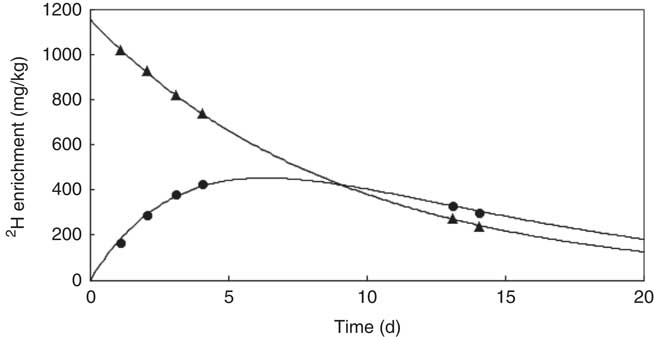
Fig. 1 z Score length/age by age groups.
Human milk intake
Fig. 1 shows an example of the enrichment of 2H in the saliva of a mother and her infant. The 2H gradually disappears from the mother’s body and appears in the infant’s saliva after breast-feeding, reaching a maximum after about 5 d before returning to the background levels. The mean amount of human milk consumed by the infants was 888 (sd 149) g/d (656–1211 g/d). The intake of water from other sources (non-human milk liquids and complementary foods) was 24·3 (sd 29·8) g/d, showing that the infants were exclusively or predominantly breast-fed according to the Haisma study( Reference Haisma, Coward and Albernaz 9 ), in which exclusively breast-fed infants received 0–24 g/d of non-breast milk water, and predominantly breast-fed infants received 53–216 g non-breast milk water per d. Studies in Guatemala( Reference Mazariegos, Slater and Ramirez-Zea 21 ) and Cameroon( Reference Medoua 22 ) used 52 g/d of non-breast milk water as the cut-off for exclusive breast-feeding. There were no significant differences between age groups and sex (Table 2).
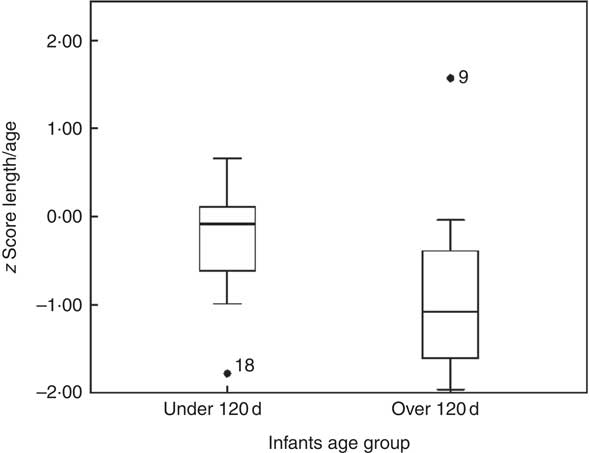
Fig. 2 Example of curves of 2H enrichment in saliva from a mother–infant pair.
Table 2 Human milk intake and non-breast-milk liquid intake (Mean values and standard deviations)
A moderate positive association was found between human milk intake and weight-for-length z score, r 0·58 (P=0·01), BMI-for-age z score, r 0·56 (P=0·01), and weight-for-age z score, r 0·45 (P=0·05) as shown in Fig. 3. There was no correlation between human milk intake and LAZ, as shown in Fig. 2–3. No associations were found between infant size and intake of water from non-human milk sources.
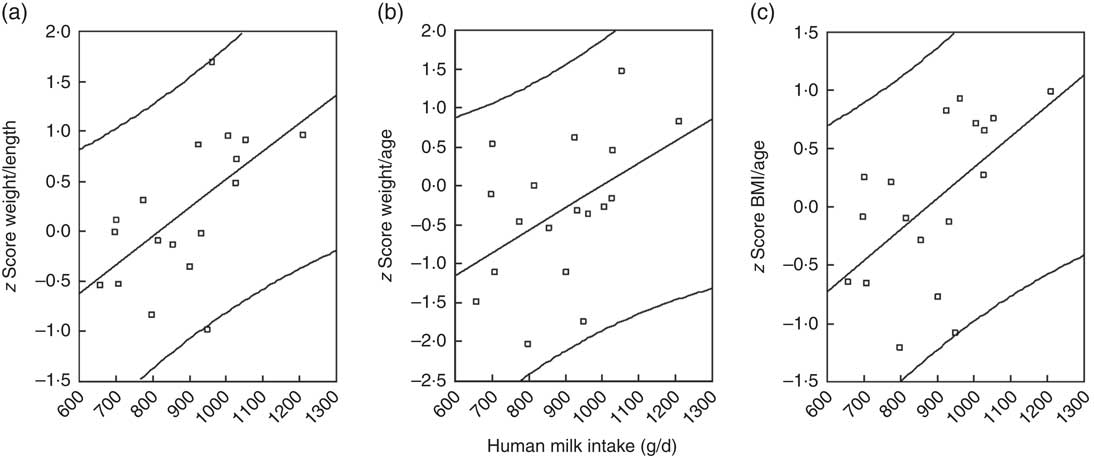
Fig. 3 Scatter plots to illustrate the relationships between nutritional indicators and human milk intake. (a) Weight-for-length z score, (b) weight-for-age z score and (c) BMI-for-age z score.
Lipid content of human milk
The lipid content in human milk measured by creamatocrit was 41 (sd 12) g/l. There was no significant difference between age groups and sex. No associations were found between infant size and lipid content of human milk.
The energy content of human milk by creamatocrit was 3053·48 (SD 524·25) kJ/l (729·8 (sd 125·3) kcal/l). Considering the average milk intake was 888 ml/d, the energy intake from human milk was 2681·94 (SD 464·42) kJ/d (641 (sd 111) kcal/d), which is adequate for infants of this age( 15 ).
Discussion
The inability to assess human milk intake directly has long been a challenge for nutrition researchers. Estimated nutrient requirements are based on human milk intakes combined with human milk composition, yet objective data on actual human milk intake remain sparse( Reference da Costa, Haisma and Wells 23 ).
Human milk intake was evaluated for the first time in breast-fed infants between 2 and 6 months of age in Bolivia at 3600 m above sea level. The intake of human milk in the present study is within the ranges published at the 9th International Breastfeeding Symposium (478–1356 ml/d)( Reference Kent 24 ), and similar to the WHO estimation for developing countries( Reference Butte, Lopez-Alarcon and Garza 25 ).
A positive relationship was found between the amount of human milk consumed and the infants’ size, based on weight-related indices, which is comparable with other studies. Similar to Brazil, Malawi and Senegal, we found positive associations between the human milk intake and infant’s anthropometric indices, with weight-for-length z score and weight-for-age z score, but no association with LAZ( Reference Haisma, Coward and Albernaz 9 , Reference Galpin, Thakwalakwa and Phuka 26 , Reference Agne-Djigo, Kwadjode and Idohou-Dossou 27 ).
An approximation of energy content and lipid content can be performed by creamatocrit( Reference Lucas, Gibbs and Lyster 10 , Reference Agne-Djigo, Kwadjode and Idohou-Dossou 27 – Reference Mitoulas, Kent and Cox 30 ). In this study, the range of lipid content is between 20 and 67 g/l, mainly owing to the variations during the day and during lactation( Reference Mitoulas, Kent and Cox 30 – Reference McClellan, Miller and Hartmann 32 ); we tried to minimise this effect by taking the samples at three times of the day, analysing samples twice and by mixing samples to obtain averages over 24 h. Our results are close to the ‘normal’ lipid content ranges reported from 35 to 45 g/l( Reference García-López 33 – Reference Koletzko 35 ). The mean is similar to Lucas’ study average of 40 (sd 4·2) g/l( Reference Lucas, Gibbs and Lyster 10 ). According to the WHO (2002), the energy content of human milk varies between 2514·58 and 3242·6 kJ/l (601 and 775 kcal/l), with a mean of 2715·42 kJ/l (649 kcal/l)( Reference Butte, Lopez-Alarcon and Garza 25 ). Our results are within this range, but taking the average human milk intake from this study (888 ml/d) together with the WHO mean energy content, the energy intake would be 2409·98 kJ/d (576 kcal/d). The energy requirement for breast-fed infants aged 3 months is 376·56 kJ/kg per d (90 kcal/kg per d)( 15 ). For an infant weighing 6·5 kg (the mean in this study), the daily energy requirement is 2447·64 kJ/d (585 kcal/d). The energy content estimated using the creamatocrit, in average, would be sufficient to meet the infant’s requirements recommended by the FAO. The energy requirements of infants living in less than ideal conditions in low- and middle-income countries need further investigation( 15 ).
In this study, linear growth faltering was apparent in the older infants (>120 d). This tendency has been described earlier in infants from Bolivia; in a retrospective study using data from infant growth charts, infants at 4 months of age showed signs of stunting( Reference Tapia, San Miguel and Urteaga 36 ). In the 1990s, a randomised trial in developing countries evaluated early complementary food intake by 4-month-old breast-fed infants. In Bolivia, there was no effect on stunting. Even in the control group, the LAZ went from −1·0 at 4 months to −1·5 at 7 months( Reference Simondon, Gartner and Berger 16 ). Stunting is a sign of cumulative deficiencies in health and nutrition of a child long term.
Globally, massive growth faltering is observed in all five regions, although its magnitude differs by region. In Europe and Central Asia, mean LAZ values are close to the standard until 12 months, drop by −0·05 z score per month in the 2nd year and remain nearly stable thereafter. In Latin America and the Caribbean, very similar faltering patterns have been observed with average declines of −0·04 and −0·06 z score per month, respectively, in the 1st year of life, and of −0·05 and −0·07 in the 2nd year. Children in both regions remain practically stable from ages 2 to 4 years. In Bolivia, these variations are remarkable( Reference Victora, de Onis and Hallal 17 ).
We hypothesise that growth faltering in Bolivian infants older than 4 months, who are receiving adequate human milk intake, is related to adverse living conditions, and exposure to environmental stressors. It has been shown that all known nutritional interventions combined, at 90 % coverage, only amount to partial (one-third) reduction in stunting rates( Reference Bhutta, Ahmed and Black 37 ). The influence of environmental factors, including living in unsanitary conditions, exposure to persistent organic pollutants, heavy metals and microbial toxins, is yet to be fully understood, but may induce environmental enteric dysfunction, which is a topic requiring further research( Reference Keusch, Rosenberg and Denno 38 , Reference Mbuya and Humphrey 39 ).
Conclusion
The amount and energy content of human milk is sufficient for the requirements of exclusively breast-fed infants in Bolivia in the first 4 months, but growth faltering that started to appear after this age suggests exposure to stressors that requires further investigation.
Acknowledgements
The authors thank the women who participated in the study, the valuable contributions of Instituto de Investigación en Salud y Desarrollo’s (IINSAD) staff and the Division of Human Health, and Technical Cooperation Programme of the International Atomic Energy Agency, for the training courses and expert support to develop the isotopic technique.
This research received no specific grant from any funding agency, commercial or not-for-profit sectors. This research receives contributions of IINSAD’s staff and the International Atomic Energy Agency for the training courses and expert support to develop the isotopic technique.
The authors’ contributions were as follows: N. U. and J. L. S. M. formulated the research question and designed the study; N. U., J. L. S. M. and A. M. A. performed data collection; N. U. and M. M. performed 2H dose-to-mother technique and enrichment analysis on FTIR; C. S. provided technical guidance on the use of the stable isotope technique and made corrections to the English language; N. U. performed statistical analysis, and wrote the first drafts of the manuscript. All of the authors contributed substantially, reviewed the manuscript and approved the final manuscript.
There are no competing financial interests in relation to the work described.


