


The prevalence of obesity is rising rapidly in most Asian countries, especially in Japan with an increase of 46 % from 1976–80 to 2000( 1 ). Specifically, the overall prevalence of overweight and obese adult men in Japan has increased gradually over the past 20 years, whereas the prevalence of overweight and obese adult women has not changed( Reference Yoshiike, Seino and Tajima 2 ). Obesity is commonly caused by an energy imbalance, with low total energy expenditure (TEE) possibly being a contributing factor in this process. While a negative relationship between obesity and daily physical activity has been reported( Reference Schoeller 3 , Reference Yoshioka, Doucet and St-Pierre 4 ), the majority of studies have not observed this relationship( Reference Goran 5 , Reference Luke, Dugas and Ebersole 6 ). Therefore, the relationship between BMI (body weight (BW, kg) divided by height squared (m2)) and daily physical activity still remains unclear.
In studies using the doubly labelled water (DLW) method, the most accurate method for measuring TEE in free-living conditions( Reference Schoeller 7 , Reference Schoeller 8 ), the majority of Western adult populations showed no relationship between BMI and physical activity level (PAL, the ratio of TEE:RMR)( Reference Prentice, Black and Coward 9 – Reference Das, Saltzman and McCrory 11 ).
On the other hand, we have recently reported that Japanese adult women with higher fat deposition had higher body fat percentage (%BF) with an apparent lower PAL compared with those with lower fat deposition( Reference Park, Ishikawa-Takata and Tanaka 12 ). However, this association was not observed when women were categorised using BMI. In addition, step counts or time spent in moderate- or vigorous-intensity physical activity assessed by an accelerometer (i.e. the part composed of PAL) was also found to be lower in women with higher fat deposition( Reference Park, Ishikawa-Takata and Tanaka 12 ).
However, Westerterp & Goran( Reference Westerterp and Goran 13 ) using a meta-analysis of data of 290 adults from twenty-two DLW studies reported that a higher PAL was related to a lower fat mass (FM) only in men but not in women. This indicates that the relationship between physical activity and fat deposition may be different between the sexes. However, this relationship was not observed if data were stratified according to BMI.
The main aim of the present study was to examine whether the negative relationship that we observed between %BF and daily physical activity in our previous cross-sectional study in Japanese adult women( Reference Park, Ishikawa-Takata and Tanaka 12 ) was also apparent in Japanese adult men. Information from the present study will help to understand the role of daily physical activity in the increased prevalence of obesity in adult males.
Methods
Subjects
Participants were recruited through health-care centres or at workplaces in three urban districts in central and western Japan, as described previously( Reference Park, Ishikawa-Takata and Tanaka 12 ). In each location, subjects were included for the study according to the following criteria: (1) in good health; (2) not involved in hard physical labour such as farming or athletics; (3) BMI >18·5 kg/m2; (4) living in their home prefecture 2 weeks before and during the study; (5) not on a weight-loss or treatment diet; (6) alcohol consumption < 40 g/d. The occupations of the participants were mainly salesmen, teachers, clerks and desk jobs, and some were unemployed. Overall, eighty-five male subjects aged 30–69 years were selected for the study. Over the entire assessment period, subjects were instructed to carefully maintain their normal daily activities and eating patterns and to make no conscious effort to lose or gain weight. The present study was conducted according to the guidelines laid down in the Declaration of Helsinki, and all procedures involving human subjects were approved by the Ethical Committee of the National Institute of Health and Nutrition in Japan. Written informed consent was obtained from all subjects.
Experimental procedures
The experimental design has been described in detail in our previous study( Reference Park, Ishikawa-Takata and Tanaka 12 ). Briefly, urine samples were collected and BW and height measured on the day before the assessment of physical activity (day 0). RMR was measured in the supine position using a Douglas bag in the early morning 12 h or longer after the last meal. A single dose of DLW was then given orally to each subject. After administration of this dose, the participants were instructed to collect urine samples on the following day and at eight additional times at the same time of the day during the 2-week study period. On day 15, BW and height were measured again to examine changes in BW during the study period. The subjects were then provided with an accelerometer and a self-administered diet history questionnaire. Daily physical activity was estimated over the same 2-week study period under free-living conditions using the DLW method and accelerometer.
Measurement of energy expenditure and body composition
We measured TEE using the DLW method, as described previously( Reference Park, Ishikawa-Takata and Tanaka 12 ). Briefly, the single dose of DLW consisted of approximately 0·06 g/kg BW of 2H2O (99·8 atom%; Cambridge Isotope Laboratories) and 1·4 g/kg BW of H2 18O (10·0 atom%; Taiyo Nippon Sanso). Isotopic enrichment of urine samples was measured using an isotope ratio mass spectrometer (model DELTA Plus; Thermo Electron Corporation). The 2H and 18O zero-time intercepts and elimination rates (k H and k O) were calculated using least-squares linear regression of the natural logarithm of the isotope concentration as a function of the elapsed time from dose administration. The zero-time intercepts were used to determine isotope pool sizes. Total body water was calculated as the mean value of the isotope pool size of 2H divided by 1·041 and that of 18O divided by 1·007. Fat-free mass (FFM) was calculated by assuming a hydration of 0·732(14). FM was calculated as BW minus FFM, while %BF was computed from BW and FFM. Calculation of TEE (kJ/d) was performed using the modified Weir formula( Reference Weir 15 ) based on the CO2 production rate and respiratory quotient. Food quotient calculated from the diet history questionnaire was used instead of the respiratory quotient. This assumes that under conditions of perfect nutrient balance, the food quotient must equal the respiratory quotient( Reference Kumahara, Schutz and Ayabe 16 , Reference Sasaki, Yanagibori and Amano 17 ). PAL was estimated by dividing TEE by RMR. Physical activity-related energy expenditure (PAEE) was calculated as 0·9 × TEE − RMR, assuming that the thermic effect of food was 10 % of TEE( Reference Reed and Hill 18 ).
Other measurements
Measurements of anthropometry, accelerometry and the diet history questionnaire have been described in detail in our previous study( Reference Park, Ishikawa-Takata and Tanaka 12 ). Briefly, a uniaxial accelerometer (Lifecorder EX; Suzuken Company Limited) was used for measuring the intensity of physical activity and step counts. The intensity of physical activity every 2 min was classified as either light ( < 3 metabolic equivalents), moderate (3 to < 6 metabolic equivalents) or vigorous ( ≥ 6 metabolic equivalents)( Reference Kumahara, Schutz and Ayabe 16 ). The validation and methodology of the diet history questionnaire have been described in detail elsewhere( Reference Sasaki, Yanagibori and Amano 17 ).
Statistical analysis
Data are presented as means and standard deviations. BMI was calculated as BW (measured before the DLW dose) divided by height squared (kg/m2). The associations between physical activity and BMI or %BF, expressed as continuous variables, were examined by the linear regression analysis with or without adjustment for covariates. Subjects were then grouped according to quartiles of BMI and %BF. A one-way ANOVA or ANCOVA was used to compare the variables in the quartiles, with Fisher's least-square difference used as a post hoc test for multiple comparisons. Differences were considered statistically significant when the P value was < 0·05. All statistical analyses were carried out using SPSS for Windows (version 16.0 J; SPSS, Inc.).
Results
Of the total eighty-five men studied, the proportion of normal-weight (BMI 18·5 to < 25 kg/m2), overweight (BMI ≥ 25 to < 30 kg/m2) and obese participants (BMI ≥ 30 kg/m2) was 54·1, 35·3 and 10·6 %, respectively. The mean age of the subjects was 47·5 (sd 11·0, range 30–69) years. The mean BW, height and BMI were 73·5 (sd 14·0, range 51·1–116·3) kg, 1·70 (sd 0·07, range, 1·51–1·88) m and 25·3 (sd 3·9, range 18·7–39·1) kg/m2, respectively. BW did not change during the study (change in BW: − 0·13 (sd 0·04) kg, P= 0·987). The range of PAL was 1·46–2·51 with a mean value of 1·98.
The relationships between BMI and energy expenditure or physical activity variables are shown in Table 1 and Fig. 1. Both FM (r 0·824) and FFM (r 0·714) showed a linear correlation with BMI. TEE increased linearly with BMI, whereas PAEE/BW, step counts and moderate-intensity physical activity showed a negative correlation. PAL and PAEE adjusted for BW did not correlate with BMI (Fig. 1).
Table 1 Participants' characteristics, energy expenditure components and physical activity variables, grouped according to BMI∥ (Mean values and standard deviations)
TEE, total energy expenditure; PAL, physical activity level (TEE/RMR); PAEE, physical activity-related energy expenditure (0·9 × TEE − RMR); BW, body weight; MET, metabolic equivalents.
There was a significant correlation with BMI: * P< 0·05, ** P< 0·01.
Mean values were significantly different from those of the first quartile: † P< 0·05, †† P< 0·01.
Mean values were significantly different from those of the second quartile: ‡ P< 0·05.
Mean values were significantly different from those of the third quartile: § P< 0·05.
∥ The subjects were categorised by quartile. The number of subjects in each quartile was twenty-five. In the nine intensity levels (1–9) of physical activity assessed by using an accelerometer, 1–3 indicates light intensity, 4–6 moderate intensity and 7–9 vigorous intensity.
¶ The associations between BMI and physical activity variables and energy expenditure components, expressed as continuous variables, were examined by the linear regression analysis.
∥∥ A statistical significance in TEE among the quartiles was still found even after adjustment for BW using ANCOVA (P= 0·026).
¶¶ There was no significant difference in PAEE among the quartiles after adjustment for BW using ANCOVA (P= 0·155).
∥∥∥ There was no significant difference between BMI and PAEE after adjustment for BW (partial r − 0·046, P= 0·677).
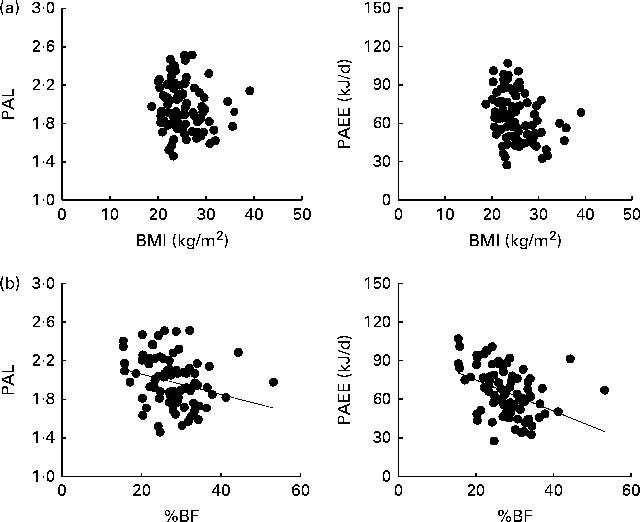
Fig. 1 Relationships between (a) BMI and physical activity level (PAL) or physical activity-related energy expenditure (PAEE) and (b) between body fat percentage (%BF) and PAL or PAEE. PAL = TEE/RMR, where TEE is the total energy expenditure; PAEE = 0·9 × TEE − RMR. %BF was negatively associated with PAL or PAEE, after adjustment for body weight, although this relationship was not observed between BMI and PAL or PAEE even after adjustment for body weight. (a) PAL: r − 0·17; PAEE: partial r − 0·05 (adjusted for body weight). (b) PAL: r − 0·26, P< 0·05; PAEE: partial r − 0·27 (adjusted for body weight), P< 0·05.
Energy expenditure and physical activity variables were also compared between the BMI quartiles. Age and height were not significantly different between the quartiles. TEE, step counts and moderate-intensity physical activity were significantly different between the quartiles. The fourth quartile had significantly smaller PAEE/BW, step counts and moderate-intensity PAL compared with the other three quartiles. A statistically significant decrease in TEE between the BMI quartiles was still observed after adjustment for BW using ANCOVA (P =0·026). However, PAEE did not show any significant difference between the BMI quartiles after adjustment for BW using ANCOVA (P= 0·155).
PAL, PAEE/BW and moderate-intensity physical activity negatively correlated with %BF (Table 2; Fig. 1). FM increased with %BF (r 0·876), whereas FFM did not (r 0·008). As shown in Fig. 1, after PAEE was adjusted for BW, a negative correlation was still observed between PAEE and %BF. A statistically significant difference was found between the %BF quartiles for PAL, PAEE/BW, step counts and moderate- and vigorous-intensity physical activities. A significant difference in TEE and PAEE was still found between the %BF quartiles after adjustment for BW using ANCOVA (P =0·001 and 0·002). PAEE was lower in the second and fourth quartiles than in the first quartile when it was adjusted for BW using ANCOVA. PAL was lower in the second and fourth quartiles than in the first quartile, whereas there was no significant difference between the second and fourth quartiles.
Table 2 Participants' characteristics, energy expenditure components and physical activity variables grouped according to body fat percentage (%BF)∥ (Mean values and standard deviations)
TEE, total energy expenditure; PAL, physical activity level (TEE/RMR); PAEE, physical activity-related energy expenditure (0·9 × TEE − RMR); BW, body weight; MET, metabolic equivalents.
There was a significant correlation with BMI: * P< 0·05, ** P< 0·01.
Mean values were significantly different from those of the first quartile: † P< 0·05, †† P< 0·01.
Mean values were significantly different from those of second quartile: ‡ P< 0·05.
Mean values were significantly different from those of the third quartile: § P< 0·05.
∥ Subjects were categorised by quartile. The number of subjects in each quartile was twenty-five. In the nine intensity levels (1–9) of physical activity assessed by an accelerometer, 1–3 indicates light intensity, 4–6 moderate intensity and 7–9 vigorous intensity.
¶ The associations between BMI and physical activity variables and energy expenditure components, expressed as continuous variables, were examined by the linear regression analysis.
∥∥ A statistical significance in TEE among the quartiles was still found even after adjustment for BW using ANCOVA (P= 0·001).
¶¶ A statistical significance in PAEE among the quartiles was still found even after adjustment for BW using ANCOVA (P= 0·002).
∥∥∥ A statistical significance between %BF and PAEE was still found even after controlling for BW (partial r − 0·266, P= 0·015).
Discussion
The present study aimed at comparing the relationship of BMI and %BF with various aspects of daily physical activity between Japanese adult men investigated in the present study and Japanese adult women that we have reported previously( Reference Park, Ishikawa-Takata and Tanaka 12 ). The common finding in both studies was that BMI was negatively related to the number of steps and time spent in moderate-intensity physical activity, whereas %BF was negatively related to PAEE/BW and PAL.
No significant correlation was observed between BMI and PAL in Japanese adult men, a finding consistent with previous studies in Japanese women( Reference Park, Ishikawa-Takata and Tanaka 12 ) and Western populations( Reference Prentice, Black and Coward 9 – Reference Das, Saltzman and McCrory 11 ). On the other hand, Tooze et al. ( Reference Tooze, Schoeller and Subar 19 ) reported that normal (BMI < 25 kg/m2) and overweight (BMI 25 to < 30 kg/m2) women had a higher PAL compared with obese women (BMI ≥ 30 kg/m2). This relationship was not observed in adult men in their study.
However, grossly obese subjects often showed a lower PAL. Prentice et al. ( Reference Prentice, Black and Coward 9 ) reported that grossly obese men (BMI ≥ 35 kg/m2) tended to have a lower PAL (mean 1·52) compared with normal-weight and obese men (BMI 18·5 to < 35 kg/m2) whose mean PAL values ranged between 1·80 and 1·86. In the present study, the number of grossly obese men was three and their PAL values were 1·77, 1·94 and 2·14, respectively. Therefore, the lower mean PAL value of 1·52 reported by Prentice et al. ( Reference Prentice, Black and Coward 9 ) was not observed in grossly obese men in the present study. Similarly, Das et al. ( Reference Das, Saltzman and McCrory 11 ) reported that PAL did not differ in grossly obese women within the BMI range of 37·5–77 kg/m2.
In contrast to the lack of the relationship between BMI and PAL, we showed that PAEE/BW was significantly lower in the highest quartile of BMI in Japanese adult men, a result similar to that observed in Japanese women( Reference Park, Ishikawa-Takata and Tanaka 12 ). This result is also in agreement with the study by Schoeller( Reference Schoeller 20 ), which reported that obese Western populations had a lower PAEE/BW compared with non-obese populations. However, the present study revealed that there was no significant relationship between BMI and PAEE, following adjustment for BW as a covariate. Despite the convenience of correcting for body size, dividing PAEE by BW should be interpreted with caution, as this may be subject to artifacts due to problems with a zero intercept or the requirement of proportionality.
Although no significant relationship was observed between BMI and PAEE after correction for body size, %BF negatively correlated with both PAL and PAEE/BW. In particular, a significant relationship was still found between %BF and PAEE even after adjustment for BW as a covariate. The present study also showed a similar relationship between PAEE/BW and %BF to that observed in women( Reference Park, Ishikawa-Takata and Tanaka 12 ), Chinese adults( Reference Schulz and Schoeller 21 ) and Western men( Reference Yao, McCrory and Ma 22 ). Therefore, it is not necessary to consider ethnic differences in this relationship. Moreover, when the data were analysed using the %BF quartiles (Table 2), PAEE/BW decreased from the second quartile in which BMI was < 25 kg/m2. These results are similar to those observed in Japanese women( Reference Park, Ishikawa-Takata and Tanaka 12 ), and suggested that daily physical activity differed according to the level of fat deposition, even in the normal-weight adult population. However, it is also important to note that PAEE corrected for BW has the limitation of assuming that all physical activities are weight-dependent.
The present study showed the negative relationship between BMI and step counts or moderate-intensity physical activity, which is likely to that observed in Japanese women. However, Mitsui et al. ( Reference Mitsui, Shimaoka and Tsuzuku 23 ) reported that there was a significant relationship between step counts and BMI in Japanese adult women, but not in men. This discrepancy in the relationship between BMI and step counts in Japanese subjects may be attributable to lower BW, BMI and step counts in the study by Mitsui et al. ( Reference Mitsui, Shimaoka and Tsuzuku 23 ). Thus, physical activity variables assessed by an accelerometer may be useful for understanding daily physical activity in obese adult populations in large epidemiological studies.
On the other hand, time spent in moderate-intensity physical activity was significantly related to %BF in men, although this relationship was not observed in women( Reference Park, Ishikawa-Takata and Tanaka 12 ). Conversely, the number of steps was related to %BF not in men but in women. The reason for this discrepancy between the sexes was not clear, although it is possible that %BF may be related to the total energy expended in daily physical activity rather than to the part composed of PAEE or PAL that included the number of steps and exercise intensity.
The present study is limited by the cross-sectional study design, which makes it difficult to clarify the causality between obesity and physical inactivity. Therefore, we cannot exclude the possibility of reverse causality that obesity may cause physical inactivity. For example, obese subjects fatigue after taking a few steps because they have to propel a larger mass; as a result, the lowered physical activity may cause obesity( Reference Levine, Lanningham-Foster and McCrady 24 ). In line with this, men in the fourth quartile, almost obese, may have had less volitional movement during physical activity due to their excess weight. The possibility of reversal causality is in agreement with the longitudinal study by Luke et al. ( Reference Luke, Dugas and Ebersole 25 ) demonstrating that physical inactivity on the basis of energy expenditure does not predict weight change.
The present study also has the following limitations. First, FFM hydration was assumed to be equal in all participants at a value of 0·732( Reference Pace and Rathbun 14 ); therefore, some errors in estimating FM obtained from FFM may have resulted from differences in the levels of obesity and sex. Second, PAL in the study was higher than 1·75, the value reported in the general population of Eastern and Western countries( Reference Schulz and Schoeller 21 , Reference Black, Prentice and Coward 26 – Reference Ishikawa-Takata, Tabata and Sasaki 28 ). The average daily number of steps of about 9564 observed in the participants of the present study was also higher than that reported for Japanese adult men in another study, who generally walk an average of 7893 steps/d( 29 ). This indicates that the individuals included in the present study may have been more physically active than adult men in the general Japanese population. However, the ranges of PAL were similar between men and women (1·46–2·51 and 1·36-2·52, respectively)( Reference Park, Ishikawa-Takata and Tanaka 12 ), which were within the PAL of the general population( Reference Westerterp 30 ).
In conclusion, the present cross-sectional study in Japanese adult men showed a negative relationship between BMI and the number of steps and time spent in moderate-intensity physical activity. It also showed that men with higher fat deposition were less active on the basis of PAEE adjusted for BW and PAL. These observations are very similar to those reported in our previous study in adult Japanese women( Reference Park, Ishikawa-Takata and Tanaka 12 ). These cross-sectional studies cannot prove causality, and that obesity causes physical inactivity may be the case. Despite these limitations, the present study did provide information regarding which physical activity variables are appropriate for use in a longitudinal study. Additional research using a longitudinal study design is required to examine the cause–effect relationships between obesity and physical inactivity including factors of dietary intake.
Acknowledgements
The present study was performed as part of Health and Labor Sciences Research Grants (Comprehensive Research on Cardiovascular and Life-Style Related Diseases) from the Ministry of Health, Labor and Welfare of Japan. The study was supported by the SMART Research Professor Program of Konkuk University. We thank the staff of the National Institute of Health and Nutrition for their kind cooperation. J. P. analysed and interpreted the data and wrote the manuscript. K. I.-T. interpreted the data, wrote the manuscript and had primary responsibility for the final content. S. T., Y. H. and K. O. interpreted the data. S. W., M. M., A. M. and N. A. managed the field study. I. T. managed the study. All authors approved the final version of the manuscript. The authors declare that they have no conflicts of interest. The authors have no relevant financial interest in this article.


