


In many developed countries, a large proportion of children and adolescents are overweight (OW) or obese (more than one-third in the USA( Reference Ogden, Carroll and Curtin 1 )), with a higher prevalence frequently being observed among those from more disadvantaged socio-economic backgrounds( Reference McLaren 2 , Reference Shrewsbury and Wardle 3 ). Beyond any genetic predisposition with regard to weight gain, the rapid increase in the prevalence of obesity over the past three decades underscores the negative impact of unhealthy eating, low physical activity and increased sedentariness. Each of these factors is strongly influenced by sociocultural( Reference Ball, Crawford, Crawford, Jeffery, Ball and Brug 4 ) and environmental factors( Reference Linde, Jeffery, Crawford, Jeffery, Ball and Brug 5 ). In particular, children's diet – the focus of the present study – has been shown to be of lower quality in population groups experiencing disadvantage, with higher intakes of energy-dense and nutrient-poor foods and beverages( Reference Darmon and Drewnowski 6 , Reference Cameron, Ball and Pearson 7 ).
Findings from research that has assessed the influence of dietary factors on child obesity have been equivocal( Reference Newby 8 , Reference Mesas, Munoz-Pareja and Lopez-Garcia 9 ). Differences in study methods may partly explain these inconsistencies. For instance, a large variety of measures have been used to define dietary intakes, with some studies focusing on specific nutrients or specific foods and others addressing the diet as a whole, through dietary patterns or eating behaviours( Reference Newby 8 , Reference Mesas, Munoz-Pareja and Lopez-Garcia 9 ). Differential misreporting of dietary intakes by OW status may attenuate or even reverse the associations observed( Reference Livingstone and Robson 10 ), and residual confounding may be important where analyses have not accounted for major covariates such as physical activity and sedentary behaviour( Reference Newby 8 , Reference Mesas, Munoz-Pareja and Lopez-Garcia 9 ). It is also likely that the impact of diet on the development of adiposity is influenced by BMI category( Reference Newby 8 , Reference Leibel, Rosenbaum and Hirsch 11 , Reference Flock, Green and Kris-Etherton 12 ). Most existing studies linking dietary intakes and child obesity are limited by their cross-sectional designs( Reference Newby 8 , Reference Mesas, Munoz-Pareja and Lopez-Garcia 9 ), and even in prospective studies, a true longitudinal perspective has frequently been lacking with either diet or obesity being measured only at a single time point( Reference Maffeis, Talamini and Tato 13 – Reference Johnson, Mander and Jones 17 ). Studies that have examined the dynamic relationship between changing dietary intakes and adiposity in children are scarce( Reference Ludwig, Peterson and Gortmaker 18 – Reference Ambrosini, Emmett and Northstone 21 ). Their importance is obvious from the substantial dietary changes that occur across childhood with both physiological development and the growing independence from parents( Reference Livingstone and Robson 10 , Reference Savage, Fisher and Birch 22 ).
Dietary pattern analysis has increasingly been used over the past decade to describe the total diet, accounting for the interactions between dietary components( Reference Newby and Tucker 23 , Reference McNaughton 24 ). The methods most often used include empirical a posteriori statistical approaches such as cluster and factor analyses and the a priori dietary index approach. The latter ranks various dietary items reflecting current nutrition guidelines and provides a score of overall diet quality. This construct is useful for assessing longitudinal changes in diet quality as it is based on external criteria. Diet quality indices (DQI) have been rarely used to assess relationships between diet and obesity in children, with all studies having been cross-sectional and all showing null or weak inverse associations( Reference Lazarou and Newby 25 ).
The present study addressed diet as a whole and aimed to test the hypothesis that a positive change in diet quality is associated with favourable changes in BMI z-scores (zBMI) in schoolchildren from low socio-economic backgrounds. It also aimed to test whether this effect would be modified by BMI category at baseline. These objectives were investigated using longitudinal data and accounting for children's physical activity, sedentary behaviour and socio-economic status (with maternal education level used as a proxy), with the latter being potential covariates as described previously.
Subjects and methods
Subjects
The present study utilised data from the Resilience for Eating and Activity Despite Inequality (READI) study, a 3-year longitudinal cohort study with data collected at two time points (T1, 2007–8; T2, 2010–11) examining resilience to obesity in 4349 socio-economically disadvantaged women (18–45 years at baseline) and 684 children (5–12 years at baseline). Methods – including sample selection – have been described in detail elsewhere( Reference Ball, Cleland and Salmon 26 ). Briefly, forty urban areas and forty rural areas (suburbs) from the bottom third of the Australian Bureau of Statistics' 2001 Socioeconomic Indexes for Areas( 27 ) were randomly selected in Victoria. Within each of these eighty areas, the Australian electoral roll was used to randomly select 150 women aged 18–45 years. Of the 11 940 women selected, 4938 (41 %) responded to a postal invitation to complete written questionnaires. Data were excluded for 589 respondents (571 who had moved from the sampled suburb before survey completion, three who completed the survey but were not the intended participants, two who withdrew their data after completing the survey, and thirteen who were aged under 17 or over 46 years). Of the 4349 eligible respondents, those with a child aged 5–12 years (n 1457) were invited to complete a questionnaire about their child, with 771 (53 %) agreeing to let their child participate and 684 (89 %) de facto completing questionnaires regarding their child in this age group. We excluded 317 (46 %) children lost to follow-up and 151 who had missing data for any of the variables included in the main analysis (BMI, diet, physical activity, sedentary behaviour and maternal education level), yielding a final sample of 216 children. The flow chart of study participant selection is shown in Fig. 1. The READI cohort study was conducted according to the guidelines laid down in the Declaration of Helsinki, and all procedures involving human subjects were approved by the Deakin University Human Research Ethics Committee (EC 91-2006). Written informed consent was obtained from all subjects.
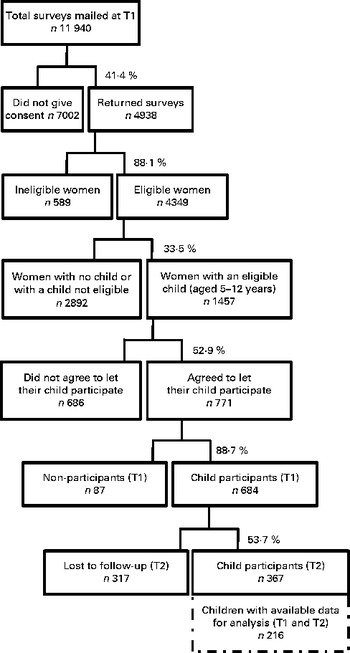
Fig. 1 Flow chart of study participant selection. T1, baseline; T2, follow-up.
Measures
Women completed two questionnaires at both baseline (T1) and follow-up (T2), one concerning the mother and the other concerning the child. These included questions on children's diet and sedentary behaviour, maternal weight and height, and a range of sociodemographic and socio-economic factors.
BMI status
Children's height (to the nearest 0·1 cm) and weight (to the nearest 0·1 kg) were measured by trained research assistants at both T1 and T2, without shoes and in light clothing, using a portable stadiometer and digital scales. Both BMI (kg/m2) and age- and sex-adjusted zBMI were calculated, the latter based on the Centers for Disease Control reference population( Reference Kuczmarski, Ogden and Grummer-Strawn 28 ). Additionally, children's BMI category (underweight, healthy weight, OW or obese) was defined using cut-off points established by Cole et al. ( Reference Cole, Bellizzi and Flegal 29 ). Mothers' self-reported height and weight were also used to calculate BMI (kg/m2).
A priori derived diet quality index
Children's food intake was measured at both T1 and T2 using a questionnaire based on several validated short questions( Reference Marks, Rutishauser and Webb 30 – Reference Hodge, Patterson and Brown 35 ). Mothers reported how often in the past month did their child consume seventeen types of foods/drinks using nine answer alternatives, i.e. ‘never or less than once/month’, ‘1–3 times/month’, ‘once/week’, ‘2–4 times/week, ‘5–6 times/week’, ‘once a day’, ‘2–3 times a day’, ‘4–5 times a day’ and ‘6 or more times a day’. The questionnaire also included thirteen additional questions related to the type and amount of milk usually consumed (number of servings per d), the type and amount of bread usually consumed (number of slices per d), and the usual frequency of consumption of other items, i.e. vegetables (excluding potatoes, hot chips and fried potatoes), hot chips, potatoes, fruit, trimmed fat, flavoured milk, water and fruit juice. These data were then converted into daily equivalent frequencies. When < 10 % of these questions had missing values (found for twenty-two children), missing values for the frequency of consumption were set to 0 and missing food type was set to ‘unknown’, as is standard practice( Reference Willett 36 ).
Children's diet quality was assessed at both baseline (DQIT1) and follow-up (DQIT2) using a DQI( Reference McNaughton, Ball and Crawford 37 – Reference Golley, Hendrie and McNaughton 39 ) reflecting adherence to the 2003 Australian Dietary Guidelines for Children and Adolescents( Reference Health and Council 40 ) based on an index validated in Australian children and adolescents( Reference McNaughton, Ball and Crawford 37 – Reference Golley, Hendrie and McNaughton 39 ). The DQI was slightly modified, as a measure related to dietary variety could not be assessed with the FFQ used in the present study. However, the impact on validity is likely to be minor, given the small absolute differences in this component of the score compared with other indicators observed in our previous work( Reference Golley, Hendrie and McNaughton 39 ). The index included ten components (Table 1) with age- and sex-specific cut-offs based on the Australian Guide to Healthy Eating( Reference Kellett, Smith and Schmerlaib 41 ). Points were awarded (0–10) for each component met, with 10 indicating that the participant was meeting the recommendation or had an optimal intake. Participants with intakes between the minimum and maximum amounts were assigned scores proportionately. Points were summed to give an overall dietary score ranging from 0 to 100, with a higher score indicating higher compliance with the dietary guidelines.
Table 1 Components of the dietary guideline index
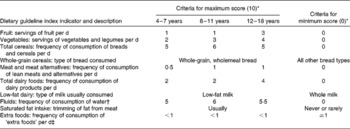
* Based on the recommendations of the Australian Guide to Healthy Eating. Values represent servings unless otherwise indicated. Participants with intakes between the maximum and minimum amounts were assigned scores proportionately. The diet quality score was adapted to reflect obesity-risk behaviours and to account for the fact that an indicator of dietary variety could not be calculated based on the FFQ used in the present study.
† Age groups for which fluids are recommended are as follows: 4–8 years; 9–13 years; >14 years.
‡ Guidelines concerning ‘extra foods’ are presented as an upper limit. Extra foods are defined as potatoes cooked in fat, crisps, confectioneries, cakes and sweet biscuits, savoury pastries, fast foods, pizzas, meat products, flavoured milks, soft drinks and fruit juices.
Change in diet quality between baseline and follow-up was calculated as DQIT2 − T1= DQIT2− DQIT1, and this continuous variable was then categorised into three groups. Participants with a negative change in diet quality were split into two categories based on the median, i.e. larger negative change ( ≤ − 7·7) and smaller negative change ( − 7·7 to 0). Participants with a positive change in diet quality formed the third group. The categories defined in this variable corresponded approximately to tertiles, with 34·5 % of the children exhibiting a large negative change in DQIT2 − T1, 34·5 % a smaller negative change and 31·0 % a positive change.
Moderate and vigorous physical activity
Children's physical activity was objectively measured at T1 using an Actigrpah GTH1 uniaxial accelerometer (Actigraph Model AM7164-2.2C). The accelerometers were set to record movement counts in 1 min epochs. Children were instructed on how to use the accelerometer at school by trained data collectors and asked to wear the accelerometer for an 8 d period during waking hours, except during bathing and aquatic activities. This method has been shown to be a valid objective measure of children's physical activity( Reference Gordon-Larsen, McMurray and Popkin 42 , Reference Trost, Ward and Moorehead 43 ). Non-wearing periods (where 20 min or more of consecutive zeros were recorded) were excluded from the total possible wear time. For children with valid data, i.e. at least 8 h( Reference Rowlands, Pilgrim and Eston 44 ) and no more than 18 h (to exclude children who wore the device to bed) of wear time for at least three weekdays and one weekend day, average time (min/d) spent on physical activity and sedentary pursuits was calculated. Using an established age-adjusted regression equation( Reference Trost, Pate and Sallis 45 ), moderate and vigorous physical activity (MVPA) was calculated as the time during which >4 metabolic equivalent units were achieved between 06.00 and 21.00 hours. This continuous variable was categorised into tertiles. Therefore, three levels were defined, i.e. ‘low’ (9·3–59·7 min/d), ‘intermediate’ (59·7–95·6 min/d) and ‘high’ (95·6–255·6 min/d).
Screen time
In the T1 questionnaire, mothers reported the usual time their child spent watching television/videos/DVD, Playstation©/Nintendo©/computer games, and computer/Internet (excluding games) on both weekdays and weekend days. Total screen time (a proxy for sedentary behaviour) was calculated for both weekdays and weekend days and truncated at 40 h (5 d × 8 h per d) and 32 h (2 d × 16 h per d), respectively. Average screen time per d was then calculated and categorised into tertiles. Therefore, three levels were defined, i.e. ‘low’ (0–1·6 h/d), ‘intermediate’ (1·6–2·6 h/d) and ‘high’ (2·6–9·3 h/d).
Sociodemographic and socio-economic factors
Sociodemographic variables included children's age and sex and mothers’ age, marital status, country of birth, employment status and education level. Maternal education level was divided into three categories, low (no formal qualifications/year 10 or equivalent), intermediate (year 12 or equivalent, trade, apprenticeship, certificate or diploma) and high (university undergraduate or postgraduate degree), and used as a proxy for socio-economic status.
Statistical analyses
Two-sided χ2 and Fisher's exact tests (categorical variables) and linear regression analyses (continuous variables) were used to compare children's characteristics at T1 according to their BMI category, i.e. non-OW (including underweight) v. OW (including obese). Multivariable regression analysis was carried out to investigate the longitudinal relationships between change in diet quality (DQIT2 − T1) and change in zBMI, adjusting for children's age, sex and DQIT1 (model 1). Change in zBMI was assessed in models where zBMIT2 was the outcome and zBMIT1 was included as a covariate( Reference Twisk 46 ). In model 2, we also controlled for children's MVPA, accelerometer wearing time, and screen time and maternal education level (all measured at T1). To assess moderation by zBMI at baseline, an additional multivariable model containing terms for zBMIT1 and DQIT2 − T1 and a term for the interaction between these two variables was used. For the purpose of hypothesis generation, stratified analyses by OW status (i.e. non-OWT1 and OWT1) were conducted regardless of the interaction tests being significant, as such tests are highly sensitive to both sample size and sample distribution( Reference Whisman and McClelland 47 ). Adjusted parameter estimates and 95 % CI were calculated. Clustering by suburb was accounted for in all the models. The significance level was set at 0·05. Analyses were conducted using Stata software (release 10; StataCorpLP).
Results
Sample characteristics
At baseline, none of the children were underweight, 77·3 (95 % CI 72·5, 82·1) % were in the healthy BMI category, 16·2 (95 % CI 11·9; 20·5) % were OW (but not obese) and 6·5 (95 % CI 3·3; 9·7) % were obese. Further characteristics of the sample are summarised in Table 2. Mothers of children who were OW at baseline had a higher BMI and were more likely to be obese than those of children with a healthy BMI. The other maternal sociodemographic characteristics did not differ significantly between these two groups. OW children at T1 were slightly older, spent more time on screen sedentary behaviours (30 min, on average), and devoted less time to MVPA than their non-OW counterparts. Among the OW children at T1, 80 % were still OW at T2. Mean DQI scores were low at baseline and change in DQI between T1 and T2 was overall negative, without significant differences being observed between OW and non-OW children.
Table 2 Characteristics of the study sample (Mean values and standard deviations; percentages and 95 % confidence intervals)
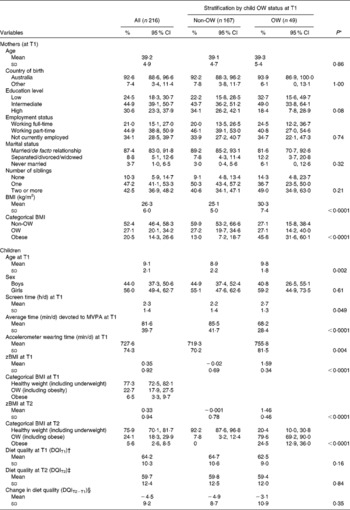
OW, overweight; T1, baseline; MVPA, moderate and vigorous physical activity; zBMI, BMI z-scores; T2, follow-up; DQI, diet quality index.
* Two-sided χ2 and Fisher's exact tests (categorical variables) and linear regression analyses (continuous variables) were carried out to compare children's characteristics at T1 and T2 according to their weight status, i.e. non-OW (including underweight) v. OW (including obese).
† Minimum 36·9 and maximum 92·6.
‡ Minimum 31·0 and maximum 94·0.
§ Minimum − 33·1 and maximum 25·6.
Previously, study participants at baseline have been found to more likely be Australian born (89 v. 73 %) and be married or living as married (65 v. 49 %) and less likely be in full-time employment (37 v. 58 %) when compared with the general population of women living in the eighty neighbourhoods (2006 Census)( Reference Ball, Cleland and Salmon 26 ). In addition, compared with children included in the analytical sample, those excluded due to loss to follow-up (n 317) or missing data (n 151) came from families where, on average, mothers were significantly slightly younger (38·1 (sd 5·3) v. 39·2 (sd 4·9) years) and less likely to be married/or in a de facto relationship (76·5 v. 87·4 %). Children excluded from the analyses were significantly slightly older (9·5 (sd 2·2) v. 9·1 (sd 2·1) years), had higher zBMI at T1 (0·62 (sd 0·92) v. 0·35 (sd 0·92)) and had higher prevalence of OW at T1 (33·0 v. 24·1 %).
Relationships between change in BMI z-scores and change in diet quality
In the whole sample (n 216), neither diet quality at baseline (DQIT1) nor change in diet quality (DQIT2 − T1) was significantly associated with changes in zBMI after accounting for potential confounders (Table 3). In stratified analyses, an inverse relationship between improvement in diet quality and zBMI at T2 was observed in the group identified as being OW at baseline after accounting for zBMIT1 (model 1, P for trend = 0·078), while this longitudinal association was not observed in non-OW children. This association was stronger after further adjustment for MVPA, screen sedentary behaviour and maternal education (model 2, P for trend = 0·035).
Table 3 Results of the multivariable linear regression analyses*, with BMI z-scores at follow-up (zBMIT2) as the outcome (Linear regression coefficients and 95 % confidence intervals)
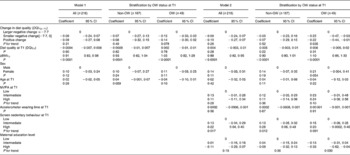
OW, overweight; T1, baseline; DQI, diet quality index; MVPA, moderate and vigorous physical activity.
* Multivariable regression analyses were carried out to investigate the longitudinal relationships between zBMIT2 (as the outcome) and change in diet quality between T1 and T2 (DQIT2 − T1, categorical variable), adjusting for zBMIT1, DQIT1, and children's age and sex (model 1). In model 2, we also controlled for children's MVPA, accelerometer wearing time, and screen time and maternal education (all measured at T1). Both models accounted for clustering by suburb.
Discussion
The present study supports the hypothesis of an association between improvement in diet quality and corresponding decrease in zBMI over 3 years, but only in schoolchildren who were OW at baseline. To our knowledge, no previous study in children has considered the effect of a change in total diet quality on zBMI change, accounting for physical activity, sedentary behaviour and maternal education.
Although we did not observe an overall relationship between change in diet quality and change in zBMI, our findings suggest that this longitudinal association may differ according to children's BMI category at baseline. Despite the test for moderation failing to reach statistical significance, which may be due to a relatively small sample size for this type of test( Reference Whisman and McClelland 47 ), stratified analyses according to OW status did suggest that among children who were OW at baseline, there was a relationship between improvement in diet quality and reduced zBMI. Similar conclusions were drawn in two other studies, one carried out in women( Reference Newby, Weismayer and Akesson 48 ) and the other in children( Reference Oellingrath, Svendsen and Brantsaeter 20 ). Both these studies also investigated the relationship between change in diet (assessed using a posteriori factor analysis) and change in BMI prospectively. Newby et al. ( Reference Newby, Weismayer and Akesson 48 ) observed a stronger association between an improvement in diet (i.e. positive changes in the ‘healthy pattern’ scores) and a reduction in adiposity among OW and obese women in comparison with their non-OW counterparts. Similarly, the study carried out by Oellingrath et al. ( Reference Oellingrath, Svendsen and Brantsaeter 20 ) suggested that Norwegian schoolchildren scoring high in a ‘varied Norwegian’ eating pattern over time had a lower risk of remaining OW than did children with declining adherence to this pattern. The latter was characterised by food items typical of a traditional Norwegian diet (such as fish and meat for dinner, brown bread, regular white or brown cheese, lean meat, fish spread, and fruit and vegetables), close to what is recommended by the health authorities. The moderation of the relationship between diet and zBMI by baseline OW status observed here might be due to metabolic differences. Excessive adiposity is often associated with greater insulin resistance and greater vulnerability to weight gain upon exposure to a diet of low quality (e.g. rich in sugars and fats)( Reference Leibel, Rosenbaum and Hirsch 11 , Reference Flock, Green and Kris-Etherton 12 ). In the group of OW children in particular, it may be that maintaining or improving diet quality may help prevent or reduce zBMI.
Although several indices measuring compliance with dietary guidelines have been developed for adults over the past decade( Reference Kant 49 , Reference Waijers, Feskens and Ocke 50 ), fewer have been developed for children( Reference Lazarou and Newby 25 ). Few studies, all of which were cross-sectional, examined diet quality and child obesity, showing null or weak inverse associations( Reference Lazarou and Newby 25 ). The assessment of diet quality according to established guidelines is useful for measuring changes over time and is a technique that leads to greater comparability between studies. In fact, contrary to a posteriori statistical approaches that are data driven, such as cluster and factor analyses, the dietary index approach is an a priori technique based on external nutritional criteria. Provided that variables are available in a given study, the construction of this DQI score is thus transposable to any other dataset. Our prospective findings confirmed that diet quality decreases with age, as has been suggested in previous cross-sectional studies in populations spanning a range of age groups( Reference Lazarou and Newby 25 , Reference Golley, Hendrie and McNaughton 39 ). The DQI used in the present study has the advantage of being based on Australian dietary guidelines and based on an index previously validated in a national sample of Australian children( Reference Golley, Hendrie and McNaughton 39 ). Higher scores of this index have been shown to reflect diets of higher nutrient density and both lower energy intake and energy density. Therefore, this DQI is easily translatable into public health messages related to the whole diet.
It is important to recognise the limitations of the present study. The modest participation rate means that the final sample should not be considered representative of children living in the sampled areas, reflecting the difficulty of both reaching and following up socio-economically disadvantaged groups. We also acknowledge that parents might not be aware of what children eat outside the home and that differential misreporting of dietary intake by OW status is possible( Reference Livingstone and Robson 10 ), both leading to potential over-reporting of healthy products and under-reporting of unhealthy foods or beverages due to social desirability. Given that the reported diets are still poor, this potential bias is, however, likely to be limited. In addition, any bias would be expected to affect the same children at both time points( Reference Black and Cole 51 ) and therefore have little influence on the prospective findings. Longitudinal assessment of screen time and physical activity was not undertaken due to the additional missing values that would have resulted. Although screen time has been shown to track throughout childhood( Reference Biddle, Pearson and Ross 52 , Reference Pearson, Salmon and Campbell 53 ), residual confounding involving changes in MVPA and changes in screen time cannot be excluded.
The objective measurement of anthropometric variables and physical activity is an important strength of the present study. From an analytical point of view, showing that change in diet quality is associated with change in zBMI provides stronger evidence for a causal relationship than using models involving measurement at only a single time point. The adjustment for patterns of sedentariness and physical activity is a further analytical strength.
A novel aspect of the present study is also the recruitment of women and children living in socio-economically disadvantaged areas and, as such, more likely to be at a high risk of poor diet and obesity. Although our findings suggest that a relationship exists between change in diet quality and change in BMI in OW and obese children, further studies among larger samples of children and incorporating more sensitive measurements of fat mass and body composition would be valuable to address our hypothesis more comprehensively.
Conclusion
Investigation of the dynamic relationship between diet and zBMI throughout childhood provides a valuable perspective on the way that diet and zBMI change together over time. Our findings support the hypothesis that improvement in diet quality is associated with a concurrent improvement in zBMI, however, only among already OW children. The identification of modifiable behaviours such as diet quality that affect zBMI longitudinally is valuable to inform future weight gain prevention interventions in vulnerable groups.
Acknowledgements
The READI study is funded by the National Health and Medical Research Council Strategic Award, ID 374241. S. L. was supported by a Deakin University Alfred Deakin Postdoctoral Fellowship. S. A. M. was supported by an Australian Research Council Future Fellowship (FT100100581). A. J. C., V. J. C. and K. B. were supported by fellowships from the Australian National Health and Medical Research Council.
The authors' contributions are as follows: S. L. led the study group, conducted the statistical analyses, drafted the manuscript and had primary responsibility for the final content; S. A. M., A. J. C., D. C., K. J. C., V. J. C. and K. B. contributed to the analytical approach and interpretation of the results and revised each draft; D. C., V. J. C. and K. B. designed the READI study and led the study group. All authors read and approved the final manuscript.
None of the authors has any conflicts of interest to declare.


