


The historically low prevalence of type 2 diabetes (T2D) in populations with high consumption of soya, legumes and whole grains has raised interest in the potential protective role of these foods in the development of T2D( Reference Kwon, Daily and Kim 1 , Reference Talaei and Pan 2 ). Phyto-oestrogens, with isoflavones and lignans as the major types, are among the potentially active components in these food groups( Reference Cederroth and Nef 3 ). Isoflavones are concentrated in soyabeans and soya products( Reference Cederroth and Nef 3 ), whereas lignans are mainly concentrated in flaxseed, sesame seeds, whole-grain and other plant-based foods( Reference Adolphe, Whiting and Juurlink 4 ). It has been hypothesised that these compounds could impose anti-diabetic effect through several mechanisms including pathways that are dependent or independent of their oestrogenic properties( Reference Cederroth and Nef 3 – Reference Gilbert and Liu 6 ).
Despite promising results from experimental studies on the potentially beneficial effects of isoflavones and lignans on glucose metabolism( Reference Cederroth and Nef 3 – Reference Gilbert and Liu 6 ), findings from human observational studies are contradictory regarding the association between their dietary intakes and risk of T2D( Reference Villegas, Gao and Yang 7 – Reference Zamora-Ros, Forouhi and Sharp 11 ). The inconsistent findings might be due to the difficulty in accurately measuring dietary intakes of isoflavones and lignans in epidemiological studies. The lack of comprehensive, accurate and up-to-date food composition databases is the major shortcoming due to the large variability of these compounds in diverse food items, which are influenced by farming conditions, post-harvest processing, storage conditions and cooking methods( Reference Bredsdorff, Obel and Dethlefsen 12 ). Moreover, dietary isoflavones and lignans need to undergo substantial metabolism by intestinal microbiota to produce the bioactive forms( Reference Cederroth and Nef 3 , Reference Adolphe, Whiting and Juurlink 4 ). The inter-individual variations in the metabolism of these compounds add further complexity to accurately quantify the biological effects of phyto-oestrogens on human health.
A recent study in US women found that higher urine concentrations of lignan metabolites were associated with a 30 % lower risk of T2D for each standard deviation increase( Reference Sun, Wedick and Pan 13 ); however, this relation has not been evaluated in Asian populations where high consumption of isoflavones from soya and soya products are common. To the best of our knowledge, evidences about the relationship between urine metabolites of phyto-oestrogens and risk of T2D are scarce. Therefore, in the present study, we aimed to measure urine metabolites of isoflavones and lignans as biomarkers of dietary intake of phyto-oestrogens and to examine their relations with risk of T2D among Chinese adults residing in Singapore.
Methods
Study population
The design of the Singapore Chinese Health Study (SCHS) has been described in detail previously( Reference Hankin, Stram and Arakawa 14 ). In brief, the SCHS is a prospective cohort study that was established between 1993 and 1998. The study recruited 63 257 Chinese men and women, between 45 and 74 years of age, from two major dialect groups (Cantonese and Hokkiens) of Chinese in Singapore. All participants were citizens and permanent residents who lived in government-built housing estates (86 % of Singapore residents lived in such estates at that time). The present study has been approved by the Institutional Review Boards at the National University of Singapore, and informed consent was provided with completion of the baseline interview.
At recruitment between 1993 and 1998, trained interviewers administered structured questionnaires for each study participant through face-to-face interviews at home, and collected information on usual diet, demographics, height and weight, smoking and drinking habits, usual physical activity, menopausal status and medical history including physician-diagnosed diabetes, hypertension, CHD and stroke. History of diagnosed cancer was assessed via linkage with the nationwide Singapore Cancer Registry. A validated 165-item, semi-quantitative FFQ was used to assess habitual dietary habits over the previous year( Reference Hankin, Stram and Arakawa 14 ), and the Singapore Food Composition Table was developed based on raw and cooked foods consumed in this population to compute intakes of nutritive/non-nutritive dietary components. The food groups were adjusted for energy intake using the energy-density method, and food intakes were expressed as g/(1000 kcal×d) (1 kcal=4·2 kJ).
Between 1999 and 2004, a total of 52 325 participants were re-contacted via telephone to update certain lifestyle practices (e.g. smoking habits and alcohol consumption), body weight and medical history (e.g. diabetes, hypertension, CHD and stroke) during the follow-up I interview. They were also invited to donate their biospecimen samples, and 32 535 participants agreed and gave their morning blood and spot urine samples. Details of the biospecimen collection, processing and storage procedures are explained elsewhere( Reference Koh, Yuan and Sun 15 ). Spot urine samples were obtained at subjects’ home in the morning. The urine was first collected in 250-ml plastic jars and immediately kept on ice. Within 1 h, 100 ml urine was acidified with 2 g of ascorbic acid in a conical flask. Subsequently, it was aliquoted into five vials (20 ml) and stored at −70°C until analysis( Reference Seow, Shi and Franke 16 ). Participants (n 39 528) were re-contacted again in 2006–2010 (follow-up II interview) to update selected lifestyle habits and health status.
Assessment of diabetes
In all the interviews at recruitment, follow-up I and II, participants were asked ‘Have you been told by a doctor that you have diabetes (high blood sugar)?’, and in case of a positive answer, they were additionally enquired the age of first diagnosis. A validation study of the incident diabetes cases was reported in detail previously( Reference Odegaard, Koh and Arakawa 17 ). On the basis of a hospital-based discharge summary database and a supplementary questionnaire regarding symptoms, diagnostic tests and hyperglycaemic therapy during a telephone interview, we observed a positive predictive value of 99 %( Reference Odegaard, Koh and Arakawa 17 ). Thus, the self-reported history of diabetes is a highly reliable measure of diagnosed diabetes status in this population.
Case and control selection
The present study samples were chosen from a case–control genome-wide association study of T2D nested within the SCHS( Reference Chen, Pereira and Seielstad 18 ). All participants without a diagnosis of T2D at baseline and follow-up I (before biospecimen collection), and who subsequently provided urine samples for research were eligible for the present study. We excluded participants with reported CHD, stroke or those who had cancer at the time of biospecimen collection. We further excluded those who reported CHD or stroke or had cancer diagnosed before the diagnosis of diabetes for the selection of cases, and at follow-up II visits for the selection of controls. Cases were those who reported to have physician-diagnosed diabetes during the follow-up II visit – that is, they were diagnosed between follow-up I and follow-up II interviews. Controls were free of physician-diagnosed T2D at recruitment and all follow-up interviews, and were matched for age (±3 years) and date (±6 months) of biospecimen collection, sex and dialect group to their index cases. In addition, controls were also screened for the presence of undiagnosed T2D by ensuring a HbA1c level <6·0 % (42 mmol/mol) at the time of biospecimen collection (online Supplementary Fig. S1). Finally, a total of 564 diabetes cases and 564 matched controls were chosen for this investigation.
Laboratory measurements
Case–control pairs of urine samples were analysed in the same batch. One senior technician with one assistant handled all assays under identical conditions without knowing the case–control sequences. Concentrations of six urine metabolites including isoflavones (daidzein, genistein, glycitein, and equol) and lignans (enterodiol and enterolactone) were measured through HPLC (Thermo Scientific Dionex UltiMate 3000 LC system) modified from an established LC-MS/MS method( Reference Parker, Rybak and Pfeiffer 19 ) (online Supplementary Material). The within-day and between-day CV were <15 % for all metabolites except for the between-day CV of genistein (16·8 %). Urine creatinine was measured according to the Jaffe’s method (reaction with alkaline picrate using an auto-analyser). Urine concentrations of phyto-oestrogen metabolites were expressed as nmol/mg creatinine.
Frozen plasma aliquots were used to simultaneously quantify high-sensitivity C-reactive protein (CRP) and lipids (total cholesterol, TAG and HDL-cholesterol) using the colorimetric method on a chemistry analyzer (AU5800 Analyzer; Beckman Coulter) at the National University Hospital Reference Laboratory. Erythrocyte HbA1c was measured by HPLC method using Bio-Rad Variant II™ System (Bio-Rad Laboratories). The blood samples of index cases and matched controls were assayed in the same laboratory batch.
Statistical analysis
Characteristics were compared between T2D cases and their matched controls using paired Student’s t test for continuous variables and the χ 2 test for categorical variables. Owing to skewness, natural logarithm transformation was performed for TAG, CRP, total energy intake, vegetable intake, fruits and related juices intake, soya protein and isoflavone intake, and urine isoflavones, lignans and creatinine concentrations. Back-transformed values are shown in the form of geometric mean and 95 % CI. Conditional logistic regression was used to assess the relationship of quartiles of creatinine-adjusted urine phyto-oestrogens (total, isoflavones and lignans), isoflavones subclasses (daidzein, genistein, glycitein and equol) and lignans components (enterodiol and enterolactone) with the risk of incident T2D. Quartiles were defined based on the distribution of urine concentrations of isoflavones and lignans in the control group. Statistical significance of linear trends was tested by modelling the median of each quartile as a continuous variable.
In the multivariate analysis, we first adjusted for age at biospecimen collection (continuous) and fasting status (≥6 or <6 h after meal); we then further adjusted for education level (no, primary school and less, secondary school and above), BMI (<20·0, 20·0–23·9, 24·0–27·9 and ≥28·0 kg/m2), physical activity (<0·5, 0·5–3·9 and ≥4·0 h/week), smoking (never, former and current), alcohol use (no/occasionally, weekly and daily), history of hypertension (yes/no) and total energy intake (continuous). In the sex-specific analysis, we also adjusted for menopausal status (yes/no) in women. In the final model, we additionally adjusted for other dietary variables including quartiles of total vegetables, total fruits and related juices, SFA and n-3 fatty acids. The information on education level, physical activity and dietary intake was obtained from baseline interviews (1993–1998), and the other variables were from follow-up I visits (1999–2004), which were close to the urine sample collection. In a sensitivity analysis, we further adjusted for sweetened soya items as well as plasma CRP, TAG and HDL-cholesterol. We also used restricted cubic spline regression with 4 knots to detect potential non-linear association, and we used the likelihood ratio test to assess non-linearity by comparing models with and without the cubic spline term.
An HbA1c level higher than 6·5 % (47·5 mmol/mol) was first proposed as diabetes diagnostic criteria in 2009 by the International Expert Committee( 20 ) and was later adapted by the American Diabetes Association (ADA)( 21 ) as a diagnostic criterion. Therefore, HbA1c was not used as a diagnostic criterion of diabetes at the time of biospecimen collection (2000–2004). However, some of the incident T2D cases already had HbA1c≥6·5 % (47·5 mmol/mol) at the time of biospecimen collection, and could thus be classified as undiagnosed diabetes based on the current ADA diagnostic criteria. To account for this definition development, a sensitivity analysis was carried out by stratifying case–control pairs based on HbA1c<6·5 % or ≥6·5 % in the case groups at the time of biospecimen collection. Statistical analyses were carried out by Stata Release 11.2 (StataCorp LP). For all analyses, statistical significance was assessed at a level of 0·05 (two-tailed).
Results
The mean time between urine collection and diabetes diagnosis was 4·0 years (range 1–9 years). Table 1 shows the characteristics of cases and controls at biospecimen collection (while some variables were from baseline interviews). The mean age of the participants was 59·8 years at biospecimen collection. As expected, cases had a high-risk profile except for the matching factors. They were heavier and more likely to have hypertension, had higher blood levels of TAG and CRP, but lower HDL-cholesterol. In terms of soya food intake, diabetes cases consumed significantly lower soya protein and isoflavones compared with the controls. However, no significant differences were found with respect to urine isoflavones or lignans. In the controls, the mean concentration of urine isoflavones was 4·01 nmol/mg creatinine, and daidzein and genistein were the major forms; the mean concentration of urine lignans was 1·39 nmol/mg creatinine, and enterolactone was the major form.
Table 1 Characteristics of the study participants in diabetes cases and control group (Numbers and percentages; mean values and standard deviations; geometric means and 95 % confidence intervals)

The cases and controls were matched for age (±3 years) and date (±6 months) of blood collection, sex and dialect group.
* P values for case–control differences were calculated using paired Student’s t test for continuous variables and the χ 2 test for categorical variables.
† A total of twelve pairs did not have data for the following dietary variables: total energy intake, all vegetables, all fruits and related juices, SFA, n-3 fatty acid, soya isoflavone and soya protein.
‡ 1 kcal=4·2 kJ.
Among the control subjects, no significant associations were found between the covariates and total urine isoflavones (data not shown). However, those with higher total urine lignan concentrations were more likely to be female, had higher physical activity and SFA intake, but a lower prevalence of hypertension and daily alcohol consumption (data not shown).
We also tested the association between dietary soya intake at the baseline interview from 1993 to 1998 and urine isoflavone metabolites in urine samples collected from 1999 to 2004. The average time between the baseline dietary assessment and biospecimen collection was 6·5 (sd 1·6) years. A dose-dependent positive relation was observed between soya protein intake and total urine isoflavones. The same trend was observed for soya isoflavone intake (Table 2).
Table 2 Urinary isoflavones according to dietary intakesFootnote * of soya in all subjects (Medians and interquartile ranges (IQR))
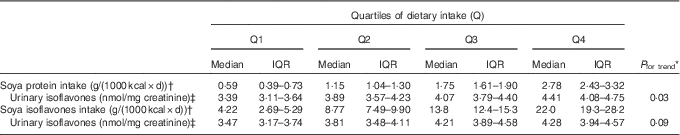
* Linear trend was tested by treating the median of quartiles of intake as a continuous variable in a linear regression model adjusted for education level, BMI, physical activity, smoking status, alcohol use, hypertension history, total energy intake, vegetable intake, fruits and related juices intake, SFA and n-3 fatty acid to estimate log-transformed values of total isoflavone.
† Dietary intake data were derived from FFQ at baseline interviews (1993–1998), whereas urine samples were collected during follow-up I visits (1999–2004).
‡ Values are adjusted for variables described in Footnote *.
Table 3 presents the relationships of total urine phyto-oestrogens, isoflavones and lignans with T2D risk. No statistically significant association or trend was observed for any of the exposures. The results were not materially changed after further adjustment for sweetened soya items, blood lipids (HDL-cholesterol and TAG) and CRP (data not shown). Introducing creatinine variable to the statistical models as a confounder rather than adjusting creatinine concentration for individual phyto-oestrogen metabolites did not materially change the results (data not shown). Neither urine isoflavones nor lignans showed a statistically significant association with T2D risk when separately examined in men or women (online Supplementary Table S1). When we stratified the analysis by baseline HbA1c levels (<6·5 or ≥6·5 %) in the diabetes cases, no significant trend was observed in either stratum (Table 4).
Table 3 Incident type 2 diabetes according to urine phyto-oestrogen metabolites (Odds ratios and 95 % confidence intervals; medians and interquartile ranges (IQR))

* Linear trend was tested by treating the median of quartiles as a continuous variable.
† the values are expressed as nmol/mg creatinine.
‡ Multivariate model 1: adjusted for age at biospecimen collection (continuous) and fasting duration (≤6 and >6 h).
§ Multivariate model 2: further adjusted for education level, BMI, physical activity, smoking status, alcohol use, hypertension history and total energy intake.
|| Multivariate model 3: further adjusted for vegetable intake, fruits and related juices, SFA and n-3 fatty acid.
Table 4 Incident type 2 diabetes according to total urine isoflavone and lignan metabolites: stratified by HbA1c level (Odds ratios and 95 % confidence intervals; medians and interquartile ranges (IQR))

* Linear trend was tested by treating the median of quartiles as a continuous variable.
† The values are expressed as nmol/mg creatinine; HbA1c of 6·5 % equals 47·5 mmol/mol.
‡ Multivariate model 1: adjusted for age at biospecimen collection (continuous) and fasting duration (≤6 and >6 h).
§ Multivariate model 2: further adjusted for education level, BMI, physical activity, smoking status, alcohol use, hypertension history and total energy intake.
|| Multivariate model 3: further adjusted for vegetable intake, fruits and related juices, SFA and n-3 fatty acid.
Table 3 suggests that the association between urine isoflavones and T2D risk was similar across the second to fourth quartiles; thus, we conducted a sensitivity analysis of non-linear association. Although no significant non-linearity was found (P=0·37), the T2D risk was reduced at low concentrations and reached plateau afterwards (online Supplementary Fig. S2). This was particularly evident in the subgroup of cases with HbA1c≥6·5 %, but not in those with HbA1c<6·5 %. When the second to fourth quartiles were combined, the OR comparing with Q1 was 0·77 (95 % CI 0·56, 1·06; P=0·11) in the total study sample, 0·89 (95 % CI 0·56, 1·41; P=0·62) in the subgroup with HbA1c<6·5 % at baseline and 0·53 (95 % CI 0·32, 0·88; P=0·01) in the subgroup of cases with HbA1c≥6·5 % (data not shown).
The associations between subclasses of urine metabolites of isoflavones and lignans and T2D risk are presented in online Supplementary Table S2. Although no statistically significant trend was observed, the second quartile of daidzein and third quartile of genistein were significantly associated with a lower risk of T2D compared with the corresponding first quartile. No statistically significant trend was observed in the strata of cases with high or low HbA1c levels (data not shown).
Discussion
In this prospective investigation among middle-aged and elderly Chinese, we found no significant associations between urine phyto-oestrogen metabolites, either isoflavones or lignans, and risk of T2D. However, some intermediate concentrations of daidzein and genistein were associated with lower risk. In subjects with HbA1c≥6·5 % at baseline, higher levels of urinary isoflavone metabolites were associated with a reduced risk, although no dose–response relationship was observed.
The association between dietary soya food intake (major sources of isoflavones) and T2D was assessed in a few longitudinal studies with contradictory findings( Reference Villegas, Gao and Yang 7 , Reference Morimoto, Steinbrecher and Kolonel 9 ) or null associations( Reference Nanri, Mizoue and Takahashi 8 , Reference Zamora-Ros, Forouhi and Sharp 11 ) in different populations. In the previous report from SCHS, we also found an inverse association between unsweetened soya product intake and T2D risk( Reference Mueller, Odegaard and Gross 10 ). These inconsistent findings from those studies may be due to the methodology challenges of accurately measuring dietary intakes( Reference Cermak, Durazzo and Maiani 22 ) or wide inter-individual variations in phyto-oestrogen metabolism( Reference Franke, Halm and Kakazu 23 ). In contrast, urine concentration of phyto-oestrogen metabolites has been preferred as an integrated measure of intake, absorption and metabolism.
In contrast to the null association in our study, a nested case–control study in a Korean population has recently reported an inverse association between serum genistein and T2D in women (316 cases) but not in men (377 cases)( Reference Ko, Kim and Ahn 24 ); however, no significant association was found for dietary isoflavone intake( Reference Ko, Kim and Ahn 24 ). Overnight urine was suggested to perform better than morning serum in estimating long-term soya intake( Reference Yamamoto, Sobue and Sasaki 25 , Reference Fraser, Franke and Jaceldo-Siegl 26 ). This is possibly because the dynamic changes of serum concentrations of isoflavones are minimised in urine assessments with longer half-life( Reference Setchell and Cole 27 ) and stable content of isoflavones( Reference Lee, Wen and Xiang 28 ). However, it is unclear whether use of serum rather than urine samples can explain the inconsistent findings between the two studies. In addition, HbA1c status of participants was not considered in the Korean study( Reference Ko, Kim and Ahn 24 ).
A marginally significant inverse association was previously reported between dietary isoflavones and diabetes risk in SCHS, but it emerged only after adjustment for sweetened soya items( Reference Mueller, Odegaard and Gross 10 ), indicating the importance of food context and preparation method. In our present analysis, the results did not change after further adjustment for sweetened soya items (data not shown). The null association between urine isoflavones and T2D risk also suggests that other components of soya, rather than the isoflavones per se, may account for the potential anti-diabetic effects. In a meta-analysis of clinical trials, fasting glucose reduction was observed in the subgroup of trials that used whole soya foods rather than isoflavone extracts or isolated soya protein( Reference Liu, Chen and Ho 29 ). However, another meta-analysis of clinical trials using high-dose isoflavone supplementation in non-Asian postmenopausal women found a moderate reduction in fasting glucose and insulin( Reference Zhang, Chen and Guo 30 ). It is widely acknowledged that Asian populations consume much higher levels of soya foods as compared with non-Asian populations( Reference Cederroth and Nef 3 , Reference Behloul and Wu 5 ). Therefore, it is possible that soya isoflavone supplements may benefit populations with traditionally very low soya intake, but not in populations where soya foods are commonly consumed – a hypothesis that requires further testing. Moreover, it is also unclear whether the short-term glucose-lowering effect in those clinical trials( Reference Zhang, Chen and Guo 30 ) could be extended to the long-term reduction of diabetes incidence in populations.
A nested case–control study within the Nurse’s Health Study (NHS) has recently reported that urine concentrations of lignan metabolites were inversely associated with incident T2D( Reference Sun, Wedick and Pan 13 ). We found no significant dose–dependent association in this Asian population. However, in the NHS study, the inverse association was only evident in the younger NHS II cohort with a mean age of 45·4 years, but not in the older NHS cohort with a mean age of 65·5 years( Reference Sun, Wedick and Pan 13 ). In our study, the mean age of the participants at the time of urine sample collection was 59·8 years. Therefore, it is possible that lignans may have an effect on early-onset but not late-onset of diabetes. Furthermore, no statistically significant association was observed between dietary lignan intake and T2D risk in European populations( Reference Zamora-Ros, Forouhi and Sharp 11 ). The effects of lignan supplementation on glucose homoeostasis have been examined in a number of clinical trials, and the results have also been inconsistent( Reference Zhang, Wang and Liu 31 , Reference Billinsky, Glew and Cornish 32 ).
It has been widely acknowledged that various types of tofu and soyabean milk are the major sources of dietary isoflavone in Chinese populations( Reference Chan, Ho and Kreiger 33 ). In a previous report from the SCHS( Reference Seow, Shi and Franke 16 ), soya intake frequency was associated with urine isoflavone in a dose–dependent manner; this has been confirmed in our current analysis as well. On the other hand, lignans are ubiquitously present in many plant-based foods with flaxseed having the highest concentration (but flaxseed is not commonly consumed). Studies in European countries have found that cereals and grain products, vegetables, fruit and berries, and beverages are the major source of total lignan intake( Reference Zamora-Ros, Knaze and Lujan-Barroso 34 , Reference Tetens, Turrini and Tapanainen 35 ). Limited studies in Chinese populations have suggested that tea consumption might be a potential dietary source( Reference Huang, Norris and Han 36 , Reference Wu, Cai and Gao 37 ), but the major food sources remain unclear. The urine concentration of isoflavones in our study (geometric mean 4·01 nmol/mg creatinine) was slightly lower compared with a study in Shanghai men and women (14·8–18·2 nmol/mg creatinine)( Reference Zhang, Gao and Yang 38 ). This might be because dietary soya consumption levels were generally higher in Shanghai (average 30·5 mg/d soya isoflavone intake)( Reference Wu, Cai and Gao 37 ) compared with our population (average 15·8 mg/d)( Reference Talaei, Koh and van Dam 39 ), and they had measured a few more low-abundance isoflavone metabolites. Urine total lignan concentrations in our study (1·71 nmol/mg creatinine) were comparable with the NHS cohort (2·32 nmol/mg creatinine)( Reference Sun, Wedick and Pan 13 ), although slightly higher than the Shanghai women (about 0·60 nmol/mg creatinine)( Reference Franke, Hebshi and Pagano 40 ).
There are several potential limitations to our study that we should acknowledge. First, we only collected morning spot urine samples, and this might not be representative of phyto-oestrogen concentrations in individuals compared with 24-h samples. Collecting 24-h urine samples was not feasible in our study, as in other large epidemiological studies( Reference Bredsdorff, Obel and Dethlefsen 12 , Reference Sun, Wedick and Pan 13 , Reference Zhang, Gao and Yang 38 ). However, a high correlation was seen between overnight spot urine and 24-h urine samples for enterolactone recovery( Reference Krogholm, Bysted and Brantsaeter 41 ), and spot urine had high agreement with overnight urine for isoflavone levels( Reference Franke, Hebshi and Pagano 40 ). Several studies have also confirmed a reasonably good correlation between dietary soya intakes and urine concentrations of isoflavone metabolites( Reference Seow, Shi and Franke 16 , Reference Jaceldo-Siegl, Fraser and Chan 42 , Reference Tseng, Olufade and Kurzer 43 ). Second, we only obtained a single measurement of urine isoflavones and lignans, and this may not reflect long-term exposure status. The plasma elimination half-lives of isoflavones( Reference Manach, Williamson and Morand 44 ) and lignans( Reference Kuijsten, Arts and Vree 45 ) are almost half a day or less. The within-person stability of urine lignan metabolites were in the acceptable range in Caucasians over 1–2 years( Reference Sun, Wedick and Pan 13 ), but such data for isoflavones are scarce, particularly in Chinese populations with high intake levels. Future studies may consider multiple assessments over time to get more accurate information about phyto-oestrogen exposure. Altogether, the measurement errors of isoflavones and lignans are more likely to be non-differential in our prospective investigation, and thus may attenuate our results towards null. Third, at the time of urine collection, a group of cases already had high HbA1c levels that met the current diabetes diagnosis criteria, even though they did not report a diagnosis of T2D. Although we have stratified the analysis by baseline HbA1c levels, the sample size in each stratum was substantially reduced and that analysis might have been underpowered. Finally, selection bias by loss to follow-up in the cohort is possible but may have minimal impact on our findings because the differences between groups with and without loss to follow-up were generally small (data not shown).
In conclusion, our prospective nested case–control study in a Chinese population provides little evidence of an association between urine isoflavones and lignans measured using a single collected specimen and risk of T2D in either women or men. Further studies are needed to confirm our results in other populations and to investigate the effects of different food sources of isoflavones and lignans on risk of T2D.
Acknowledgements
The authors thank Siew-Hong Low of the National University of Singapore for supervising the field work of the SCHS. Finally, the authors acknowledge the founding, long-standing principal investigator of the SCHS, Mimi C. Yu.
The SCHS was supported by the National Institutes of Health, USA (NCI R01 CA144034 and UM1 CA182876). This project was supported by Singapore MOE Tier 1 grant and MOH NMRC grant (CIRG/1354/2013).
A. P., W. P. K. and C. N. O.: designed and conducted the research; M. T. and B. L. L.: performed laboratory measurements; M. T.: analysed data and wrote the first draft; A. P.: critically revised the manuscript; W. P. K., R. M. v. D. and J. M. Y.: assisted in interpreting the data and edited the manuscript; A. P. had primary responsibility for the final content. All authors read and approved the final version of the manuscript.
The authors declare that there are no conflicts of interest.
Supplementary Material
For supplementary material/s referred to in this article, please visit http://dx.doi.org/doi:10.1017/S0007114516000581


