


Humans obtain vitamin D from exposure to sunlight, diet and dietary supplements( Reference Holick 1 , Reference Trehan, Afonso and Levine 2 ). Although there is no consensus on optimal 25-hydroxyvitamin D (25(OH)D) concentrations as measured in serum, vitamin D deficiency (VDD) is commonly defined as a 25(OH)D concentration of <50 nmol/l (20 ng/ml)( Reference Holick 1 – Reference Lee, O’Keefe and Bell 4 ). This cut-off is the point where parathyroid hormone (PTH) starts to rise, which is the physiological definition of VDD( Reference Holick 1 ), although vitamin D supplementation (e.g. >1000 IU/d) does not always decrease PTH concentrations and the inverse vitamin D–PTH relationship is not strictly linear. Potential factors that may cause lower 25(OH)D concentrations include skin colour, BMI, season, region, vitamin supplements and others( Reference Hirani, Mosdol and Mishra 5 ).
Vitamin D has been traditionally associated with skeletal health, and VDD leads to rickets in children and osteomalacia and osteoporosis in adults( Reference Holick 1 ). However, accumulating evidence reveals that vitamin D has beneficial effects on optimal function of extraskeletal organs and tissues throughout the human body( Reference Holick 1 , Reference Holick 3 , Reference Lee, O’Keefe and Bell 4 ). VDD has been linked to the increased risk of cardiovascular events( Reference Judd and Tangpricha 6 – Reference Dobnig, Pilz and Scharnagl 8 ). Higher vitamin D concentrations are associated with reduced cancer incidence and decreased cancer-related mortality( Reference Freedman, Looker and Chang 9 – Reference Zhao and Feldman 11 ). Furthermore, VDD has also been linked to the development of hypertension( Reference Rostand 12 ), type I diabetes( Reference Casteels, Waer and Bouillon 13 ), multiple sclerosis( Reference Munger, Zhang and O’Reilly 14 ), rheumatoid arthritis( Reference Merlino, Curtis and Mikuls 15 ) and other autoimmune conditions( Reference Holick 16 ).
In the past few years, reports of VDD have increased in non-equatorial locations worldwide( Reference Cashman, Dowling and Sˇkraba ́kova 17 – Reference Gozdzik, Barta and Wu 20 ). Although comparisons among studies are difficult because of diversity of the populations and controversy about what cut-offs should be used( Reference Ross, Manson and Abrams 21 , Reference Holick, Binkley and Bischoff-Ferrari 22 ), it is clear that blood 25(OH)D concentrations are often below recommended ranges for the general population( Reference Cashman, Dowling and Sˇkraba ́kova 17 , Reference Holick 23 ). VDD has been investigated in infants and toddlers, healthy adolescents, obese children and African Americans( Reference Catherine, Gordon and Feldman 24 – Reference Freishtat, Iqbal and Pillai 27 ), yet limited information is available on the prevalence and predictors of VDD and vitamin D insufficiency (VDI) among US adults. Several studies have reported vitamin D status and changes in serum 25(OH)D concentrations in the general US population( Reference Looker, Johnson and Lacher 28 , Reference Looker, Pfeiffer and Lacher 29 ). However, they have used conservative cut-offs for the definitions of VDD (25(OH)D<30 nmol/l or even lower)( Reference Ross, Manson and Abrams 21 , Reference Gordon, DePeter and Feldman 25 ), which may not be clinically informative, and have focused on mean 25(OH)D concentrations, instead of VDD prevalence( Reference Looker, Pfeiffer and Lacher 29 ).
It is of public health importance to evaluate VDD and VDI status defined by clinically adopted criteria, and to identify groups at high risk of VDD and VDI along with factors associated with these conditions among US adults in a large nationally representative population. Although the Institute of Medicine (IOM) recommended a threshold of 50 nmol/l for bone health, recent studies have shown that a threshold of 50 nmol/l (20 ng/ml) is insufficient for fracture or fall reduction, and bone density increases with higher 25(OH)D concentrations far beyond 50 nmol/l (20 ng/ml) in adults, suggesting that the IOM threshold recommendation may be too low for optimal bone health in adults( Reference Bischoff-Ferrari, Willett and Wong 30 , Reference Bischoff-Ferrari, Dietrich and Orav 31 ). Accordingly, we adopted the criteria recommended by the Endocrinology Society to define VDD (25(OH)D<50 nmol/l) and VDI (50≤25(OH)D<75 nmol/l). The objectives of the study were to examine the prevalence in the subgroups defined by age, sex, race/ethnicity and other variables, and to identify socio-demographic, behavioural and dietary factors associated with a higher prevalence of VDD and VDI using data from the National Health and Nutrition Examination Survey (NHANES).
Methods
Study sample
The continuous NHANES is designed to assess the health and nutrition status among children and adults in the US civilian non-institutionalised population. It includes a series of 2-year cross-sectional surveys conducted by the National Center for Health Statistics (NCHS) in the Center for Disease Control and Prevention (CDC)( 32 ). NHANES participants are selected through the use of stratified multi-stage clustered probability sampling design. The surveys integrate interview and examination components. Face-to-face interviews were performed at the volunteer’s house to collect demographic, socio-economic, dietary and health-related information. Examinations are conducted in the mobile examination centres to obtain medical, physiological and laboratory measurements. All adults provided written informed consent, and the study was approved by the NCHS Institutional/Ethics Review Board. The detailed information has been described in the NHANES website and the previous studies( 32 , Reference Liu and Duan 33 ).
Vitamin D data were selected from the continuous NHANES 2001–2010 for this study. A total of 64 994 individuals were screened in 2001–2010. Among them, 52 195 (80·3 %) participated in the interview and 50 085 (77·1 %) were involved in the examination. The individuals aged<18 years, who participated in interview or examination but not both and who had missing values on 25(OH)D concentration were excluded from the present study. After these exclusions, a final sample of 26 010 subjects with complete data on 25(OH)D were included for further analysis. We removed missing measurements from the study for two considerations: (1) the included data without missing values were quite large and could ensure the analysis power to detect the significance difference; and (2) excluded missing values could be reasonably thought to have no significant impact on the final results because there were no significant differences in characteristics between included data and excluded missing data.
Assessment of vitamin D deficiency and insufficiency
VDD and VDI were determined based on the serum 25(OH)D concentration that was measured at the Division of Laboratory Sciences in the CDC National Center for Environmental Health. In 2007–2010, serum 25(OH)D metabolites were assayed using a standardised liquid chromatography-tandem MS (LC-MS/MS) method traceable to the National Institute of Standards and Technology reference materials( Reference Schleicher, Sternberg and Lacher 34 , Reference Al-khalidi, Kimball and Rotondi 35 ). The total concentrations of serum 25(OH)D were calculated as the sum of 25(OH)D2 and 25(OH)D3. For 2001–2006, total 25(OH)D concentrations were initially measured using a DiaSorin RIA kit. Because of the concern about imprecision and bias in the method, RIA measurements of 25(OH)D concentration in 2001–2006 were adjusted for assay drifts and converted to LC-MS/MS method equivalent measurements( Reference Schleicher, Sternberg and Lacher 34 ). (For details on vitamin D adjustment from survey to survey, see the online Supplementary materials.) This standardisation was conducted so that we could use the LC-MS/MS-equivalent data for NHANES 2001–2006 to compare with 25(OH)D data from NHANES 2007–2010. VDD and VDI were determined from the standardised 25(OH)D data. For purposes of this analysis, a participant was defined as VDD if his/her concentration of serum 25(OH)D was <50 nmol/l, and VDI if the serum 25(OH)D concentration was ≥50 and <75 nmol/l.
Socio-demographic, behavioural and dietary factors
Factors that have potential to cause lower 25(OH)D concentrations were chosen according to the previous studies( Reference Hirani, Mosdol and Mishra 5 , Reference Forrest and Stuhldreher 36 ). Participants were classified into three groups in terms of age: young adults (18–39 years), middle-aged adults (40–59 years) and old adults (60 year or above). Race/ethnicity was determined by self-report and included non-Hispanic white, non-Hispanic black, Hispanic and other race (combined from American Indian, Alaskan Native, Asian or Pacific Islander and other race not specified for sufficient number of individuals and meaningful analyses). Education levels were categorised as high school or below and college or above in terms of years in school. The family’s poverty income ratio was calculated by dividing total family income by the poverty threshold, which was a guideline specific to family size, as well as the appropriate year and state, as issued annually by the Department of Health and Human Services.
Participant’s standing height was measured by a fixed stadiometer and body weight was taken on a Toledo digital scale. BMI was calculated as weight in kg divided by the square of height in m. A participant was determined to have obesity if BMI≥30 kg/m2. History of smoking was obtained from household interview for participants aged ≥20 years and from the examination centre for participants aged 18–19 years. Smokers were defined as subjects aged ≥20 years who smoked ≥100 cigarettes in their lives or subjects aged 18–19 years who had ever tried smoking a whole cigarette. Current smokers included those smokers aged ≥20 years who reported current smoking and those aged 18–19 years who reported smoking in the past 5 d; former smokers included smokers who did not report current smoking. Alcohol use was determined by response to the question ‘Had at least 12 alcohol drinks per year?’.
Milk in the USA is routinely fortified with vitamin D, and therefore it is an important source of vitamin D( Reference Calvo, Whiting and Barton 37 ). Participant’s milk consumption was obtained from the diet, behaviour and nutrition data of the Questionnaire and was categorised as rarely (less than once a week or never), sometimes (more than once a week but less than daily) and frequent (once a day or more). In terms of the time period when the examination was performed, participating season was categorised into winter (sampled on 1 November to 30 April) and summer (sampled on 1 May to 31 October). Information for physical activity was collected from the NHANES Sample Person Questionnaire 2001–2010. Physical inactivity was defined as not participating in either vigorous or moderate-intensity exercises in the past 30 d before the interview.
Statistical analysis
The NHANES uses a complex stratified multi-stage sampling design to select participants. We performed survey procedures to account for the complex design, estimate mean values and percentages and provide 95 % CI by considering strata, cluster and sampling techniques. The NHANES Analytic and Reporting Guidelines 2001–2010 were followed for the data analysis( 32 ). Standard errors were estimated with Taylor series linearisation. Sampling weights were recalculated to extend the results to the general US population by dividing 2-year sampling weights from each cycle of the NHANES by the number of cycles we used in the study.
We calculated means with 95 % CI for continuous variables and percentages/rates with 95 % CI for categorical variables. The Wald F test was used to compare means of continuous variables and the χ 2 test was used to compare percentages of categorical variables for the significance of difference in means or percentages/rates over vitamin D status. The prevalences of VDD and VDI were estimated, respectively, by dividing the weighted frequency of VDD and the weighted frequency of VDI by the weighted total population represented by the study sample. The prevalence estimates with 95 % CI were derived from survey frequency procedures. Prevalence ratios (PR) and 95 % CI were estimated by conducting weighted log-Binomial regression models, and were used to reflect the associations of socio-demographic (age, sex, race/ethnicity, education and family income ratio), behavioural (obesity status, smoking, alcohol use and physical activity) and dietary (milk drinking) factors with the prevalences of VDD and VDI. The Wald χ 2 test was used to determine the P value and the significance of associations. Weighted multiple linear regression models were conducted to examine the associations of the above factors with the concentration of 25(OH)D. Three basic assumptions were checked using q-q plot for normality and residual plots for independence and equal variances. All the analyses were performed using SAS statistical software (SAS version 9.4; SAS Institute Inc.).
Results
A total of 26 010 subjects aged ≥18 years were included in the study sample. They represented 199 487 260 non-institutionalised adults in the USA. Average age of the study population was 45·6 years. Females were 51·7 %, non-Hispanic blacks were 10·7 % and Hispanics were 12·7 %. Current smoking rate was 30·1 % and current drinking rate was 74·2 % (Table 1). Among adults aged ≥18 years, the prevalence of VDD (25(OH)D<50 nmol/l) was 28·9 (se 1·01) % and the prevalence of VDI (50≤25(OH)D<75 nmol/l) was 41·4 (se 0·63) %. The prevalences of VDD and VDI did not change significantly over time during 2001–2010 (P=0·18 for linear trend of VDD; P=0·15 for linear trend of VDI) (Fig. 1). Additional analysis showed that (1) the prevalence of 25(OH)D <30 nmol/l was 6·4 (se 0·40) %, and did not change over time (Fig. 2), and that (2) the percentage of participants with 25(OH)D>125 nmol/l was 1·7 % and that with 25(OH)D>150 nmol/l was 0·38 % (high levels considered by IOM (North America) and the European Food Safety Authority (Europe) to have potential adverse effects on health).
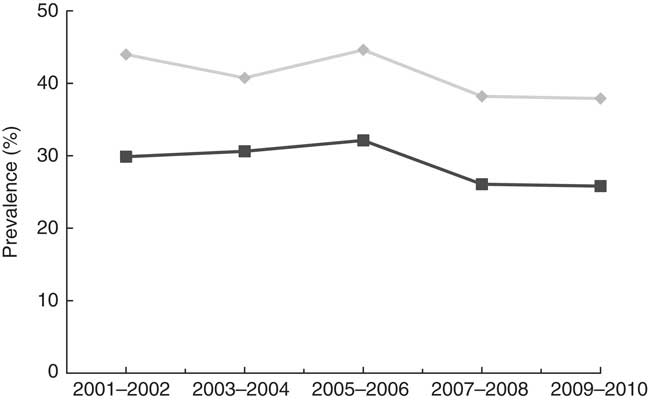
Fig. 1 Trends in the prevalence of vitamin D deficiency (![]() ) and insufficiency (
) and insufficiency (![]() ) among adults ≥18 years in the National Health and Nutrition Examination Survey 2001–2010 (vitamin D deficiency was defined as 25-hydroxyvitamin D (25(OH)D)<50 nmol/l and vitamin D insufficiency was defined as 50≤25(OH)D<75 nmol/l).
) among adults ≥18 years in the National Health and Nutrition Examination Survey 2001–2010 (vitamin D deficiency was defined as 25-hydroxyvitamin D (25(OH)D)<50 nmol/l and vitamin D insufficiency was defined as 50≤25(OH)D<75 nmol/l).
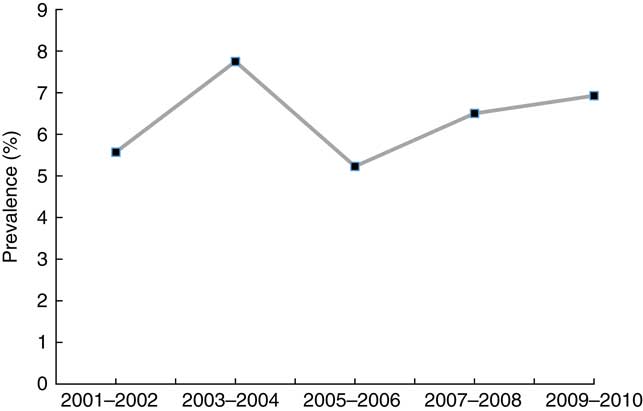
Fig. 2 Trends in the prevalence of 25-hydroxyvitamin D (25(OH)D)<30 nmol/l among adults ≥18 years in the National Health and Nutrition Examination Survey 2001–2010.
Table 1 Characteristics of subjects by vitamin D status among adults ≥18 years in the National Health and Nutrition Examination Survey 2001–2010 (Mean values and 95 % confidence intervals; percentages)
25(OH)D, 25-hydroxyvitamin D.
* P<0·001 for the significance of overall difference in means or percentages of characteristics across vitamin D groups.
Adults with VDD (v. normal vitamin D) were more likely to be poor, less educated, non-Hispanic black and Hispanic, obese, physically inactive and infrequent to consume milk (Table 1). However, adults with VDD were less likely to be current alcohol drinkers or former smokers. Adults who had VDI (v. normal vitamin D) were more likely to be poor, non-Hispanic black and Hispanic, obese and inactive, but were less likely to be women and current alcohol drinkers.
Prevalence estimates of VDD and VDI among US adults in NHANES 2001–2010 are presented in Table 2. From this table, we can see that non-Hispanic blacks had the highest prevalence of VDD (71·9 %) among racial groups. The prevalence of VDD was higher in adults who received high school education or below compared with those with college education or above (35·0 v. 27·5 %), and higher in poor v. non-poor adults (40·5 v. 26·8 %). Adults who were obese, current smokers, sampled in the winter, physically inactive and rare consumers of milk had higher prevalence of VDD than those who were non-obese (38·5 v. 24·0 %), former smokers (31·9 v. 22·8 %), sampled in the summer (39·3 v. 22·1 %), active (38·9 v. 24·3 %) and frequent consumers of milk (38·0 v. 21·0 %), respectively. Current alcohol drinkers had lower prevalence of VDD compared with non-drinkers (25·3 v. 36·8 %).
Table 2 Prevalence estimates of vitamin D deficiency and insufficiency among adults ≥18 years in the National Health and Nutrition Examination Survey 2001–2010 (Prevalence estimates and 95 % confidence intervals)
25(OH)D, 25-hydroxyvitamin D.
Table 3 lists adjusted PR with 95 % CI of VDD and VDI associated with socio-demographic, behavioural and dietary factors in NHANES 2001–2006. After adjustment for other potential factors, old adults were 63 % more likely to have VDD and 46 % more likely to have VDI than young adults. Among the independent predictors, being a minority was the strongest indicator for VDD and VDI; compared with non-Hispanic whites, non-Hispanic blacks had 24·58 and 3·70 times and Hispanics had 4·30 and 2·33 times higher prevalence of VDD and VDI, respectively. Obese adults had 3·09 times higher prevalence of VDD and 1·88 times higher prevalence of VDI than non-obese adults. Adults had 2·42 times higher prevalence of VDD and 1·46 times higher prevalence of VDI in winter than in summer. Physically inactive adults showed 2·00 and 1·36 times higher prevalences of VDD and VDI than active peers. Rare consumption of milk was associated with 2·44 and 1·25 times higher prevalences of VDD and VDI, and consuming milk sometimes was associated with 83 and 19 % higher prevalence. Current smokers had 26 % higher prevalence than never-smokers. However, current alcohol drinkers had 38 % lower prevalence of VDD compared with non-drinkers.
Table 3 Adjusted prevalence ratios of vitamin D deficiency and insufficiency associated with characteristics among adults ≥18 years in the National Health and Nutrition Examination Survey 2001–2010 (Adjusted prevalence ratios and 95 % confidence intervals)
25(OH)D, 25-hydroxyvitamin D.
Associations of characteristics with continuous serum 25(OH)D concentration are presented in Table 4. Serum 25(OH)D concentration was 3·7 nmol/l lower in old compared with young adults. Non-Hispanic blacks and Hispanics had serum 25(OH)D concentrations 22·5 and 9·9 nmol/l lower than non-Hispanic whites. Obese adults had 25(OH)D concentration 8 nmol/l lower than non-obese peers. Average 25(OH)D dropped by 5·7 nmol/l in winter compared with summer. Physical inactivity and infrequent milk consumption reduced serum 25(OH)D concentration by 4·8 and 6·2 nmol/l, respectively. However, current alcohol drinking increased serum 25(OH)D concentration by 3·1 nmol/l.
Table 4 Association estimates of characteristics with serum 25-hydroxyvitamin D (25(OH)D) concentration (nmol/l) among adults ≥18 years in the National Health and Nutrition Examination Survey 2001–2010 (Association estimates and 95 % confidence intervals)

Discussion
Using the NHANES as a representative sample of the US population, we found that the national prevalences of VDD and VDI were 28·9 and 41·4 %, respectively. This reflects a remarkable degree of deficient or insufficient vitamin D stores among US adults, as the overall prevalence of 25(OH)D <75 nmol/l accounted for 70·3 % of the civilian non-institutionalised adult population. Although we have recognised that the IOM report and the recent UK Scientific Advisory Committee on Nutrition report define VDD as a 25(OH)D concentration<30 and 25 nmol/l, respectively, we adopted the criteria recommended by the Endocrinology Society to define VDD (25(OH)D<50 nmol/l) in the present study because this cut-off is the point where PTH starts to rise, which is the physiological definition of VDD. Different cut-offs, diversity of the populations and seasonality may have affected the prevalence estimates of VDD and VDI from study to study. Using standardised information from 55 844 Europeans, Cashman et al.( Reference Cashman, Dowling and Sˇkraba ́kova 17 ) reported that 40 % of individuals had 25(OH)D concentrations <50 nmol/l, regardless of age group, ethnicity and latitude of study populations. Despite geographic differences, this is consistent with data from the last wave of the Mexican Health and Aging Study, showing that 37·3 % Mexican older adults had 25(OH)D concentrations <50 nmol/l( Reference Carrillo-Vega, García-Peña and Gutiérrez-Robledo 18 ). Clearly, VDD is highly prevalent globally, even in countries with adequate sun exposure.
Using the definition of serum 25(OH)D concentration <50 nmol/l, we showed that approximately 72 % of non-Hispanic black adults would be classified as deficient in vitamin D, with other minorities also displaying a higher prevalence of VDD compared with non-Hispanic whites. Higher prevalence of VDD and lower concentration of serum 25(OH)D among black adults persisted after controlling for other potential predictors (including age, sex, race/ethnicity, education, family income ratio, obesity status, smoking, alcohol use, physical activity and milk drinking). These results were consistent with the findings from previous studies( Reference Calvo, Whiting and Barton 37 – Reference Araujo, Travison and Esche 39 ). Several pathways may explain the difference in the prevalence of VDD across racial/ethnic groups. The higher prevalence in darker-skinned individuals may be due to the melanin pigmentation, which absorbs sunlight, reducing availability of sunlight to trigger natural vitamin D production( Reference Holick 1 , Reference Calvo, Whiting and Barton 37 ). Lower socio-economic status and worse behavioural and dietary patterns could be another reason for higher prevalence of VDD in minority groups. Our further analysis of racial/ethnic differences in socio-economic, behavioural and other factors reveals that non-Hispanic blacks were less educated, poorer, more obese, more likely to currently smoke, more physically inactive and less likely to frequently drink milk (online Supplementary Table S1). Moreover, lower socio-economic status including higher rates of poverty and lower education could limit knowledge about healthy diet and lifestyle modification, and hence food choices, particularly non-dairy sources of vitamin D in minority populations( Reference Calvo, Whiting and Barton 37 ). This is further confirmed by the finding in the present study that the prevalence of VDD was higher in subjects who were poor and received a high school education or below. Although non-Hispanic whites had the lowest prevalence of VDD, they were at greater risk of VDI, suggesting that factors other than skin pigmentation alone contribute to human vitamin D stores. Considering the potential for insufficient-to-deficient transition, non-Hispanic whites should not be considered exempt from concerns about serum 25(OH)D concentrations.
Consistent with prior reports( Reference Turer, Lin and Flores 26 , Reference Calvo, Whiting and Barton 37 ), we did find that obese adults had a higher prevalence of VDD than those who are non-obese. Obesity-associated VDD is likely due to the decreased bioavailability of vitamin D3 from cutaneous and dietary sources because of its deposition in body fat compartments( Reference Wortsman, Matsuoka and Chen 40 ). A recent study has shown that a higher BMI leads to lower 25(OH)D rather than the reverse, and effects of lower 25(OH)D on increasing BMI are likely to be small( Reference Vimaleswaran, Berry and Liu 41 ). Therefore, encouraging population-level physical activity to reduce BMI, as recommended by the CDC( 42 ) and other health agencies, will help decrease the prevalence of VDD. In addition, more outdoor physical activity could also increase 25(OH)D by more sunlight exposure, which is a major source of vitamin D.
After adjustment for other potential predictors, several behavioural and dietary factors were found to be associated with the prevalences of VDD or VDI, and/or continuous 25(OH)D concentration. Current smoking was linked to an increased prevalence of VDD, which was consistent with a previous report that smokers had significantly reduced concentrations of serum 25OHD( Reference Hansdottir, Monick and Lovan 43 ). One possible reason is that nicotine activates a pathway in the brain that suppresses appetite and reduces eating food fortified with vitamin D( Reference Brot, Jorgensen and Sorensen 44 ). Smoking can also decrease production of 1,25 di-hydroxyvitamin D in lung epithelia and affect 25-hydroxylase activity( Reference Jo, Talmage and Role 45 ). Whether the number of cigarettes per day or the levels of smoking are differently related to VDD or VDI needs to be further investigated. On the other hand, current alcohol consumption was associated with a decreased prevalence of VDD, which reflects an association between current alcohol use and significantly higher serum 25(OH)D concentration shown in this study. However, the finding stands in contrast to a previous report that linked excessive drinking with low or subnormal concentrations of vitamin D( Reference Wijnia, Wielders and Lips 46 ). However, our data lacked information on amount of alcohol use, and hence we could not evaluate a dose–response association of alcohol use with the prevalence of VDD.
Adults with physical inactivity had lower serum 25(OH)D concentration, and were more likely to have VDD and VDI. Obesity status may serve as a mediator for this association, as physical activity plays an important role in weight loss or reduced BMI. Indeed, lower BMI has been associated with reduced prevalences of VDD and VDI in other studies( Reference Carrillo-Vega, García-Peña and Gutiérrez-Robledo 18 , Reference Vimaleswaran, Berry and Liu 41 ). Increased physical activity, if outdoors, may also be associated with higher sunlight exposure. Compared with frequent milk consumption, rare or occasional milk consumption was associated with higher prevalences of VDD and VDI and lower serum 25(OH)D concentrations. Milk is fortified with vitamin D in the USA, and is one of the main dietary sources of vitamin D, although the levels of fortification may vary by brand( Reference Calvo, Whiting and Barton 37 ).
There were several limitations in this study. The NHANES was a series of surveys with a cross-sectional design, and the association estimates could not be used to reflect causal effects of predictors on VDD and VDI. Single 25(OH)D measurement for each participant in the NHANES may cause misclassification of VDD or VDI, which would affect the association estimates. Further, the biologic effect of 25(OH)D may not be reliably measured in serum owing to its fat-soluble characteristic. Vitamin D production also varies with geographic latitudes because of the duration and strength of UV rays from sunlight. Unfortunately, region-specific vitamin D data were not available in the NHANES, nor was specific information on sun exposure, such as time spent outdoors and sunscreen use. Vitamin D supplement use can influence serum vitamin D concentrations, but this factor could not be evaluated owing to the limited information provided in the present study.
In conclusion, the prevalences of VDD and VDI were high, and fewer than 30 % of US adults had sufficient vitamin D for optimal health outcomes. Our data indicate that vitamin D supplementation may be broadly needed perhaps at higher than currently recommended dosages to achieve repletion, particularly for racial and ethnic minorities, as well as for those who are obese, current smokers, physically inactive and infrequent milk consumers. The associations between low vitamin D, physical activity and milk consumption suggest that attention should be paid to increasing opportunities for outdoor exercise (at least 30 min/d) and sun exposure (at least 15 min/d) in leisure time and optimisation of vitamin D intake, either by diet or supplement. Because vitamin D is linked to skeletal, cardiovascular and other organ systems, screening indications and guidelines for supplementation of adults should be evaluated, taking into account latitude and identified influential factors. Health professionals should use these predictors for initiating strategies, both behavioural and dietary, to prevent VDD and monitor VDI, especially for people in old, minority and/or obese groups.
Acknowledgements
The authors thank the National Center for Health Statistics for the availability of NHANES data.
Research for this study was supported by a Health Resources and Services Administration grant (H2AIT16637).
X. L. designed the study, identified data sources, conducted the data analysis and wrote the first draft of the manuscript; A. B. participated in writing the method section, review of data analysis methods and critical revision of the manuscript; P. D. L. participated in the study design, determination of measurement cut-offs and critical revision of the results and discussion.
The authors declare that there are no conflicts of interest.
Supplementary material
For supplementary material/s referred to in this article, please visit https://doi.org/10.1017/S0007114518000491


