


Serum 25-hydroxyvitamin D (S-25(OH)D) concentration is the most useful marker of vitamin D status( Reference Ross, Taylor and Yaktine 1 ). Sufficient vitamin D status (S-25(OH)D>50 nmol/l) is essential for bone health, especially in the prevention of secondary hyperparathyroidism, which causes osteoporosis and fractures, and in reducing risk of falls( Reference Ross, Taylor and Yaktine 1 , 2 ). Vitamin D insufficiency (S-25(OH)D<50 nmol/l), which has also been associated with risk for many types of cancer and other chronic diseases( 2 , Reference Bischoff-Ferrari, Giovannucci and Willett 3 ), is a public health problem, affecting populations living at northern latitudes, especially during winter( Reference Holick 4 , Reference Cashman, Dowling and Škrabáková 5 ). Nevertheless, the situation is not always the same between indigenous populations and immigrants. Vitamin D status in the majority of the native populations seems to be more satisfactory than among immigrants in the Nordic countries( Reference Andersson, Björk and Kristiansson 6 , Reference Granlund, Ramnemark and Andersson 7 ).
Diet, namely fatty fish, fortified dairy products, fortified fat spreads and cod liver oil, and vitamin D supplements remain the main sources of vitamin D for the northern populations during the winter months, when sun-induced vitamin D synthesis in the skin is limited( Reference Granlund, Ramnemark and Andersson 7 – Reference Raulio, Erlund and Männistö 10 ). Unlike the indigenous populations, infrequent consumption of fatty fish and use of vitamin D supplements has been reported among immigrants of non-Western origin living in the Nordic countries( Reference Granlund, Ramnemark and Andersson 7 , Reference Wändell 11 ). Hence, in contrast to the case with indigenous populations, nutritional factors may contribute to the high prevalence of vitamin D deficiency observed among immigrants in the Nordic countries, especially among women( Reference Wändell 11 ).
In particular, higher risk of vitamin D deficiency (S-25(OH)D<30 nmol/l) among immigrants of African and Asian background residing in northern countries has been reported in several studies( Reference Andersson, Björk and Kristiansson 6 , Reference Holvik, Meyer and Haug 8 , Reference Islam, Viljakainen and Kärkkäinen 12 , Reference Andersen, Mølgaard and Skovgaard 13 ). Studies on skin colour and vitamin D synthesis have observed lower vitamin D status in individuals with dark skin than in those with lighter skin; skin pigmentation (melanin) interferes with vitamin D synthesis from UV-B (UVB) exposure( Reference Armas, Dowell and Akhter 14 , Reference Libon, Cavalier and Nikkels 15 ). Wearing concealing clothing also contributes to an increased risk of vitamin D deficiency( Reference Holick 4 , Reference Granlund, Ramnemark and Andersson 7 ). In Finland, high prevalence of S-25(OH)D<30 and S-25(OH)D<50 nmol/l was observed in two recent studies of Somali( Reference Cashman, Dowling and Škrabáková 5 , Reference Islam, Viljakainen and Kärkkäinen 12 ) and Kurdish immigrants( Reference Cashman, Dowling and Škrabáková 5 ). In contrast to the immigrants, sufficient vitamin D status was reported for the majority of Finnish adults in 2012( Reference Raulio, Erlund and Männistö 10 ). Insufficient S-25(OH)D concentrations have also been observed in other studies examining immigrants of East African( Reference Madar, Stene and Meyer 16 – Reference Osmancevic, Demeke and Gillstedt 18 ) and other ethnic origin( Reference Holvik, Meyer and Haug 8 , Reference Madar, Stene and Meyer 16 , Reference Andersen, Mølgaard and Skovgaard 19 ) in the Nordic countries.
Despite these disparities in vitamin D status between the dark-skinned and fair-skinned populations, similar vitamin D recommendations based on studies among Caucasian populations are currently followed among both groups in the United States and in the Nordic countries( Reference Ross, Taylor and Yaktine 1 , 2 ). However, there may be differences in vitamin D requirement and metabolism between the different population groups( Reference Cashman 20 ). Concerns about the vitamin D status and requirements of dark-skinned immigrants residing in the Western world, the impact of ethnicity and the need for dose–response studies were highlighted in the Institute of Medicine (IOM) Dietary Reference Intakes report( Reference Ross, Taylor and Yaktine 1 ).
Hence, the primary objective of this 5-month randomised controlled trial (RCT) was to investigate ethnic differences in the response of S-25(OH)D to vitamin D3 supplementation over an extended winter period in women of East African and Finnish (Caucasian) descent. We also examined ethnic differences in vitamin D status with regard to S-25(OH)D concentrations and vitamin D intake from the diet and supplements in these two groups of women.
Methods
Study design and subject population
This intervention study was implemented within the European Union (EU)-funded research project ‘Food-based solutions for optimal vitamin D nutrition and health through the life cycle’ (ODIN; FP7-613977-ODIN; www.odin-vitd.eu). Specifically, the study was part of ODIN’s Work Package 6 with the overall objective of delivering the proof of efficacy and safety of food-based solutions to prevent vitamin D deficiency by focusing on EU-resident adults who are most at risk of vitamin D deficiency owing to skin colour, sun exposure practices or dietary habits.
The study was a 5-month, randomised, placebo-controlled, dose–response (0, 10, 20 μg/d vitamin D3) trial conducted from December 2014 to May 2015. The study was tagged Marwo-D (the word was coined from the Somali word ‘Marwada’, which means lady, and the letter D, which stands for vitamin D). The participants were recruited from the Helsinki metropolitan area (latitude 60°N). The participants of East African descent were recruited from the register of subjects who were shortlisted for participation in the cross-sectional Migrant Health and Wellbeing Study (Maamu), a population-based health interview and examination survey among immigrants in Finland( Reference Castaneda, Rask and Koponen 21 ), and also from mosques and meeting places (outside Maamu sample). The indigenous Finnish participants were recruited from the Health 2011 survey, a study carried out among the Finnish mainland population( Reference Härkänen 22 , Reference Koskinen, Lundqvist and Ristiluoma 23 ), and through advertisements in social media and on the Viikki campus area of the University of Helsinki. Invitation letters were sent to participants from the Maamu and Health 2011 samples, and they were subsequently contacted by telephone. All women of East African descent were first-generation immigrants with Somali origin, dark-skinned and wore traditional clothing.
A total of 191 subjects were screened for eligibility. The inclusion criteria were female sex, Somali or Finnish origin, BMI≤40 kg/m2 and S-25(OH)D concentration >30 but <100 nmol/l. The inclusion criteria for S-25(OH)D concentration was based on ethical viewpoint (not to include deficient subjects, who need supplementation) and ability to evaluate the response to supplementation (which may not be obvious among participants with higher S-25(OH)D concentrations). Exclusion criteria included pregnancy or breast-feeding during the study, a vacation in a sunny destination before or during the study, use of a tanning bed before or during the study and medication or illnesses that interfere with vitamin D metabolism. Medical history, S-25(OH)D concentration and other inclusion and exclusion criteria were assessed during screening in October/November 2014. Subjects who did not meet the inclusion criteria owing to S-25(OH)D concentration <30 nmol/l (i.e. vitamin D-deficient) received information on dietary and supplemental sources of vitamin D, and they were advised to contact their healthcare services for further medical actions. In addition, they were given either 10 or 20 µg of vitamin D3 supplements for daily use, depending on the severity of deficiency. Altogether, 147 women (77 % of those screened) – 72 (49 %) of East African descent and 75 (51 %) of Finnish descent, aged 21–64 years – met the inclusion criteria and were studied at the Calcium Research Unit of University of Helsinki, Finland. Participants’ recruitment and randomisation are presented in Fig. 1 (Consolidated Standards Of Reporting Trials (CONSORT) diagram).
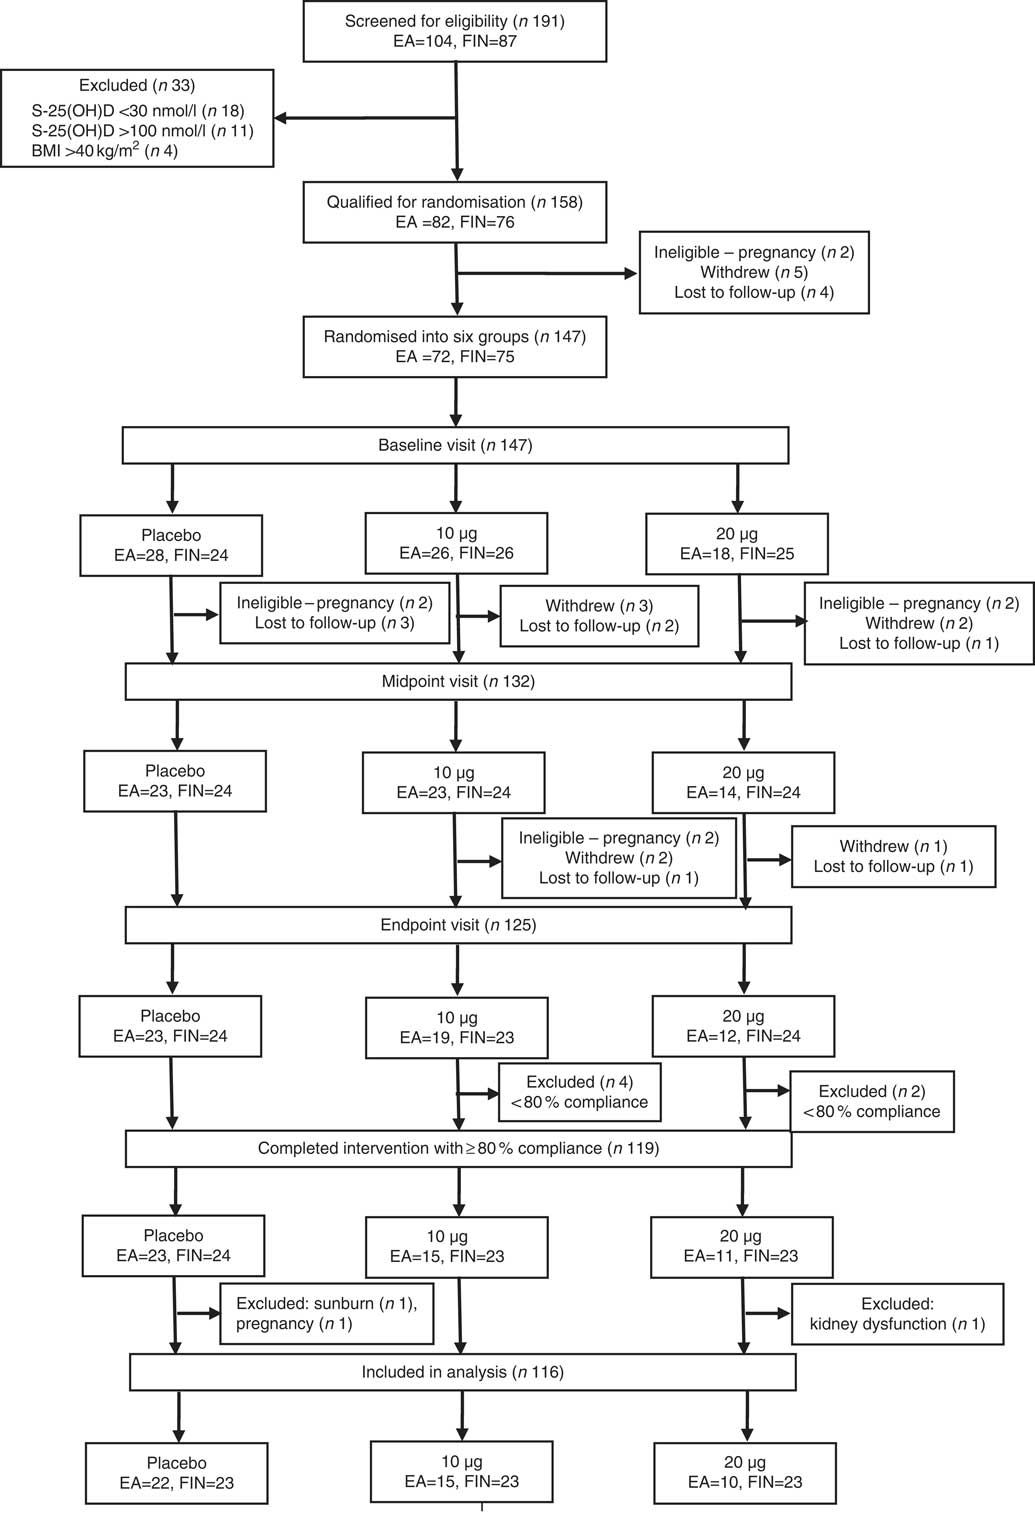
Fig. 1 Consolidated Standards Of Reporting Trials (CONSORT) diagram. Details of the recruitment, randomisation and distribution of the participants in the Marwo-D study. EA, women of East African descent; FIN, women of Finnish descent; S-25(OH)D, serum 25-hydroxyvitamin D.
The study was conducted according to the guidelines laid down in the Declaration of Helsinki, and all procedures involving human subjects were approved by the Coordinating Ethics Committee of the Helsinki and Uusimaa Hospital District. Written informed consent was obtained from all subjects. The consent form and the participant information sheet were provided in Somali and Finnish languages. The study was registered as a clinical trial on ClinicalTrials.gov (www.ClinicalTrials.gov; NCT02212223).
Randomisation and intervention
The East African and Finnish women who met the inclusion criteria were randomised into three supplementation groups: placebo or 10 or 20 µg vitamin D3/d (Fig. 1). Participants were evenly randomised into intervention groups, for group similarities with respect to the distribution of S-25(OH)D, BMI, age, habitual vitamin D intake from supplements at screening and ethnicity. Altogether, 125 subjects (85 % of those randomised) completed the study and twenty-two subjects (15 %) discontinued after randomisation. The reasons for discontinuation were as follows: withdrawal (n 8), lost to follow‐up (n 8) and ineligible because of pregnancy (n 6). Supplements containing 10 or 20 µg of vitamin D3 per tablet and identical placebo tablets containing 0 µg were provided by Oy Verman Ab. Supplements and placebo tablets were kept in similar jars identifiable only by the subjects’ ID numbers. Each 10-µg vitamin D3 tablet coincides with the Finnish national recommendation for daily vitamin D intake for the studied age group, whereas each 20-µg tablet is twice the Finnish national recommendation for daily vitamin D intake( 24 ).
Each participant received a jar containing placebo or vitamin D3 tablets at the baseline visit (in December) and subsequently at the midpoint visit (in February/March). They were advised to take one tablet daily and were given research diaries to keep a record of their study tablet use and occurrence of any side effects during the intervention period. At the midpoint and endpoint (in April/May) visits, compliance was calculated by counting the remaining tablets in the returned jars. The participants’ research diaries were evaluated at each visit during the intervention.
Participants were not restricted from taking their personal vitamin-D-containing supplements; those who used vitamin D supplements before the study were advised to continue in the same manner throughout the intervention period in order to avoid changes in their habitual vitamin D intake. Participants who had no previous personal vitamin D supplementation but wished to start were allowed to use supplements at doses ≤10 µg of vitamin D/d. Possible changes in the use of personal vitamin-D-containing supplements were monitored during the intervention period.
Background and dietary data collection
Background data were collected from all participants through a detailed questionnaire either delivered via interview (women of East African descent) or self-administered (women of Finnish descent). Vitamin D supplementation practices were assessed based on how often vitamin-D-containing supplements were used, dosage and trademark; questions on general health included any experience of health problem and specific medication; and habitual sunshine exposure was measured by type of clothing wore outdoors in summer, and working hours and leisure time spent outdoors during summer. Weight and height were measured at screening and BMI was calculated as weight (kg)/height (m2).
Habitual vitamin D intake was assessed in all participants, on the basis of a validated semi-quantitative interview-administered FFQ( Reference Itkonen, Erkkola and Skaffari 25 ), at the baseline and endpoint of the intervention. The FFQ used in this study covered nine food groups, comprising altogether forty-six food items, considered important sources of vitamin D (Table 1). Vitamin D intake during the previous month was assessed with closed questions on consumption frequencies (daily, weekly, monthly, less often or not at all) and portion sizes (e.g. 1 glass or 1 piece). Open questions were asked with regard to use of fat (such as spread on bread, in cooking and baking). Information on brand name of food products was also included in the FFQ.
Table 1 Food groups in the FFQ
Interviews with women of Finnish descent were conducted in Finnish. Some of the women of East African descent were interviewed entirely in the Finnish language, whereas others were interviewed with translation by Somali-speaking research assistants, when necessary. A picture booklet of products fortified with vitamin D was used to help participants identify consumed products. Pictures showing portion sizes were also used when needed. The questionnaire was piloted in a small East African population (n 5) before its administration in the study.
The dietary vitamin D intakes were calculated based on the FFQ consumption data for vitamin-D-fortified fluid milk products and fat spreads, fish and other sources (such as milk-based foods, main courses, mushrooms and other vitamin D-fortified products, namely cheese, bread, juice and mineral water), using the Finnish national food composition database, Fineli®, which was developed and is continuously updated by the Nutrition Unit of the Finnish National Institution of Health and Welfare (www.fineli.fi).
Blood sample collection
Fasting blood samples were collected at screening, baseline, midpoint and endpoint visits, between 06.45 and 12.30 hours. After serum separation, samples were stored frozen at −70°C until analysis. Total S-25(OH)D concentration was assessed from the serum samples (i.e. at screening, baseline, midpoint and endpoint) by the Cork Centre for Vitamin D and Nutrition Research at the University College Cork, Ireland, using liquid chromatography-tandem MS (LC-MS/MS), which is the central analytical platform for the ODIN project. The LC-MS/MS method measures S-25(OH)D2 and S-25(OH)D3 separately, and total S-25(OH)D concentrations were calculated as the sum of these values. The inter-assay and intra-assay CV for the analyses were <5 and <6 %, respectively, for both metabolites( Reference Cashman, Kiely and Kinsella 26 ). The quality and accuracy of S-25(OH)D analysis by the LC-MS/MS in the laboratory is guaranteed on an ongoing basis by participation in the Vitamin D External Quality Assessment Scheme (DEQAS) (Charing Cross Hospital)( Reference Cashman, Kiely and Kinsella 26 ). Moreover, the Cork Centre for Vitamin D and Nutrition Research’s method is certified under the Centers for Disease Control and Prevention Vitamin D Standardization Certification Program (http://www.cdc.gov/labstandards/pdf/hs/CDC_Certified_Vitamin_D_Procedures.pdf). In line with IOM S-25(OH)D thresholds for an adult population, we defined vitamin D status of S-25(OH)D<30 nmol/l as deficient; S-25(OH)D of 40 nmol/l as concentrations that cover the requirements of 50 % of the population; S-25(OH)D 30 to <50 nmol/l as insufficient; S-25(OH)D≥50 nmol/l as sufficient; and sustained S-25(OH)D concentration>125 nmol/l raised concerns about possible adverse effects( Reference Ross, Taylor and Yaktine 1 ). For study purposes, we also defined S-25(OH)D concentrations in the range of 75–125 nmol/l as higher concentrations.
Serum parathyroid hormone (S-PTH) concentrations were analysed by an immunoluminescence-based method using Immulite1000 (Siemens Healthcare Diagnostics) at the Department of Food and Nutrition, University of Helsinki, with inter-assay and intra-assay CV of <8·0 and <5·5 %, respectively. Serum calcium (S-Ca), albumin and phosphorus (S-Pi) concentrations were assessed with a photometric method using Konelab20 automatic analyser (Thermo Clinical Labsystems Oy) at the Department of Food and Nutrition, University of Helsinki. The inter-assay and intra-assay CV for S-Ca and S-Pi analyses were <4·6 and <4·6 %, respectively. S-Ca results were used as albumin-corrected.
Statistical analysis
A power calculation based on the S-25(OH)D concentrations was performed to estimate the number of subjects needed. On the basis of the distribution of wintertime serum 25(OH)D data from our previous study of white adult Finnish women( Reference Itkonen, Skaffari and Saaristo 27 ), we calculated that thirty-four volunteers per group should be recruited, with 90 % power to detect a minimum of a 10 nmol/l increase in serum 25(OH)D between groups, within an ethnic group, at α=0·5. However, this number was increased to forty for each dose group (placebo, 10 and 20 µg/d in each ethnic group) to account for possible dropouts. A total of 240 women (120 in each ethnic group) were aimed to be enrolled, but the targeted sample size could not be reached because of the seasonal time frame (i.e. wintertime) of the study. Hence, we could not extend the recruitment period for more participants. We assumed that the distribution of wintertime serum 25(OH)D would be similar for non-white adult Finnish women and used similar numbers per group.
Normality of the distribution of variables was tested with the Kolmogorov–Smirnov test. ANOVA was used to assess differences in normally distributed variables in intervention groups within both ethnic groups, whereas differences in non-normally distributed variables were evaluated with a non-parametric test (Kruskal–Wallis). Comparison of variables between the two ethnic groups was performed with t tests (normally distributed variables) and the non-parametric Mann–Whitney U test (non-normally distributed variables). Repeated-measures ANCOVA was used to evaluate the effect of supplementation on S-25(OH)D, S-PTH, S-Ca and S-Pi in the two ethnic groups. In ANCOVA, the baseline S-25(OH)D, S-PTH, S-Ca or S-Pi concentration was used as a covariate. Comparisons between intervention groups were carried out with contrasts. Results are presented as mean values and standard deviations, and in figures as means with their standard errors. All results were considered statistically significant at P<0·05. IBM Statistical Package for the Social Sciences Statistics for Windows, version 21.0 (IBM Corp.), was used for statistical analysis.
In the analysis focusing on the effects of intervention, three East African subjects randomised to the group that received 20 µg/d (initial n 21) were moved to the placebo group (initial n 25) because one of the three participants stopped the supplementation after 4 d, and the other two participants did not take the supplement at all. Final analysis included only the participants who completed the intervention and had ≥80 % compliance rate with study supplementation in each group. Nevertheless, three participants were excluded from the analysis for the following reasons: pregnancy (n 1), kidney dysfunction (n 1) and sunburn (n 1). Subjects on medications owing to hypothyroidism (n 5) and type 2 diabetes (n 5) were included in the analysis because their exclusion had no significant effect on the results. Altogether, data from 116 participants were analysed. Additional analyses were performed for the evaluation of vitamin D status in the two ethnic groups with regard to S-25(OH)D concentrations in all screened subjects (n 191) and vitamin D intake from the diet and supplements in all randomised subjects (n 147).
Results
Serum 25-hydroxyvitamin D at screening screened
We screened altogether 191 subjects (East African women n 104, Finnish women n 87). On the basis of the IOM thresholds for S-25(OH)D concentrations, 17 % (n 18) and 39 % (n 40) of the screened East African women were deficient (S-25(OH)D<30 nmol/l) or had insufficient status (S-25(OH)D 30 to <50 nmol/l), respectively( Reference Ross, Taylor and Yaktine 1 ). There was no vitamin D deficiency observed in Finnish women and the proportion of participants who had insufficient status (9 %) (n 8) was lower than in East African women. Sufficient vitamin D status (S-25(OH)D≥50 nmol/l) was observed in 44 % (n 46) of East African women and in 91 % (n 79) of Finnish women. Higher concentrations (S-25(OH)D 75–125 nmol/l) were seen in 7 % (n 7) of East African women and 33 % (n 29) of Finnish women. S-25(OH)D concentrations above 125 nmol/l were observed in 5 % (n 4) of Finnish women (Table 2).
Table 2 Vitamin D status of subjects (n 191) at screening according to serum 25-hydroxyvitamin D (S-25(OH)D) concentration thresholds (Numbers and percentages)
Characteristics of the participants in the intervention
Among the 147 randomised participants (East African women n 72, Finnish women n 75), the mean compliance with study supplementation in women of East African descent was 89 % (n 54) and in women of Finnish descent it was 98 % (n 71). The baseline mean S-25(OH)D concentrations were higher in Finnish women (mean: 60·5 (sd 16·3) nmol/l) than in East African women (mean: 51·5 (sd 15·4 ) nmol/l) (P=0·001) (data not shown). The characteristics of the 116 participants included in the final analyses are shown in Table 3. The intervention groups in each ethnicity did not differ from one another with regard to any background data. Nevertheless, women of East African descent differ from Finnish women in all characteristics, except for S-Pi concentrations.
Table 3 Characteristics of the participants stratified by intervention group and ethnicityFootnote * (Mean values and standard deviations; n 116)
PTH, parathyroid hormone.
* Vitamin D intakes calculated from FFQ (mean of baseline and endpoint).
† From non-parametric tests, ANOVA and t-tests (P<0·05).
‡ Significant differences between East African and Finnish women.
§ n 112 for serum PTH analysis.
Baseline vitamin D intake and sources of vitamin D
Total vitamin D intake at baseline, as well as that from diet and supplements (where relevant) separately, and stratified by supplement non-use and voluntary supplement use (participants who used their personal supplements in addition to study supplements) are given in Table 4. Higher mean habitual vitamin D intakes from the diet (11·2 (sd 5·8) v. 8·4 (sd=4·1) µg/d, P=0·003) and supplements (13·0 (sd 5·8) v. 6·9 (sd 4·1) µg/d, P<0·001) were observed in East African women (n 72) than in Finnish participants (n 75) (Table 4). The proportions of voluntary supplement users in East African women and Finnish women were 88 % (n 63) and 47 % (n 35), respectively. Meanwhile, similar mean intakes from supplements were observed among the voluntary vitamin D supplement users in both ethnic groups (East African women: 14·5 (sd=11·4) µg; Finnish women: 14·7 (sd 15·1) µg, P>0·05) (Table 4). Participants using personal vitamin D supplements showed higher total mean vitamin D intake than those not using personal supplements (East African women: 26·0 (sd 13·9) v. 8·7 (sd 7·4) µg, P=0·002; Finnish women: 23·9 (sd 15·1) v. 7·6 (sd 4·1) µg, P<0·001) (Table 4). The proportion of participants attaining the daily recommended vitamin D intake of 10 µg( 2 , 24 ) from diet and supplements was higher in East African women (83 %) (n 60) than in Finnish women (55 %) (n 41) (P=0·003) (data not shown).
Table 4 Daily vitamin D intake (µg/d) from the diet and supplements at baseline* † (Mean values and standard deviations; n 147)
* Mean vitamin D intakes (µg/d) calculated from baseline FFQ.
† Range from diet: 1·5–29·9 µg/d (East African women); 1·1–18·6 µg/d (Finnish women). Range from supplement: 0·0–60·0 µg/d (East African women); 0·0–57·5 µg/d (Finnish women). Range of total intake: 1·5–89·9 µg/d (East African women); 1·1–68·2 µg/d (Finnish women).
‡ Significant differences between groups of participants. P values <0·05 from Mann–Whitney U test.
The contributory food sources to the mean daily intake of vitamin D for both East African women and Finnish women are presented in Fig. 2. The major source of vitamin D for the two groups of women was fortified fluid milk products, with higher intake in East African women (East African women: 5·2 (sd 4·0) µg; Finnish women: 3·4 (sd=3·0) µg, P=0·003). Similar vitamin D intake from fortified fat spread and fish was observed in both groups (P>0·05).
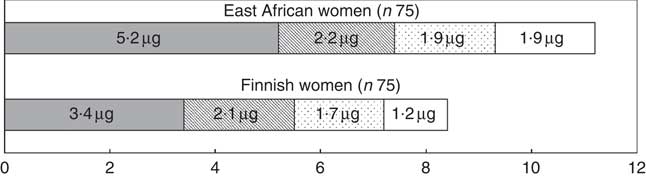
Fig. 2 Baseline daily vitamin D intake from dietary sources. Values are mean vitamin D intakes calculated from baseline FFQ. ![]() , Fortified fluid milk products;
, Fortified fluid milk products; ![]() , fortified fat spreads;
, fortified fat spreads; ![]() , fish;
, fish; ![]() , others (milk-based foods, main courses, mushrooms, vitamin D-fortified cheese, bread, juice and mineral water).
, others (milk-based foods, main courses, mushrooms, vitamin D-fortified cheese, bread, juice and mineral water).
Effect of vitamin D supplementation on serum 25-hydroxyvitamin D, serum parathyroid hormone, serum calcium and serum phosphorus
After the 5-month intervention, the effect of vitamin D3 supplementation on S-25(OH)D among the 116 participants included in the analysis are shown in Fig. 3 (repeated-measures ANCOVA, adjusted for baseline S-25(OH)D concentration); compared with placebo, vitamin D supplementation with both 10- and 20-µg doses significantly increased S-25(OH)D concentration in both ethnic groups. No significant differences were seen between 10- and 20-µg dosages (P>0·05) in either of the two ethnic groups. We observed no differences in the results when we excluded the three East African subjects who were moved from 20 µg to the placebo group. The results did not change after adjustment for personal supplement use, dietary vitamin D intake and BMI. Using a regression model, there was no significant difference in intake-S-25(OH)D response between women of East African descent and those of Finnish descent when baseline serum S-25OHD concentration was included as a covariate (P>0·3; data not shown). The mean changes during the study period in the 10-µg D3 supplement groups for Finnish women and East African women were +8·5 (+14·1) and +10·0 nmol/l (+19·2 %), respectively, and in the 20-µg D3 supplement groups they were +10·7 (+17·7) and +17·1 nmol/l (+32·7 %), respectively. The mean changes in placebo groups for Finnish women and East African women were −7·8 (−13·0) and −2·3 nmol/l (−4·4 %), respectively. Between the two groups of women, no significant differences were observed in response to vitamin D3 supplementation (P>0·05) (Fig. 3). No significant effect of vitamin D3 supplementation on S-PTH, S-Ca or S-Pi was seen in either East African or Finnish women (P>0·05) (repeated-measures ANCOVA, adjusted for baseline S-PTH/S-Ca/S-Pi, data not shown).
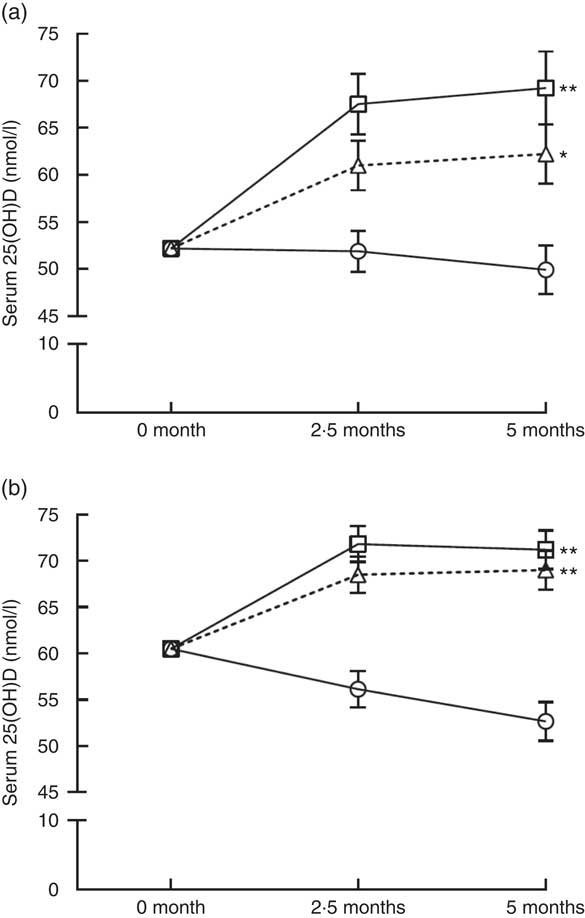
Fig. 3 Response of serum 25-hydroxyvitamin D (S-25(OH)D) to vitamin D3 supplementation in women of East African (a) and Finnish (b) descent (adjusted for baseline S-25(OH)D concentrations, repeated-measures ANCOVA). The time points are at 2·5-month intervals, representing mean values at each time point; error bars represent standard errors. Comparisons between intervention groups using contrasts: **P<0·001 and *P=0·003 for the differences compared with placebo; P=0·105 for East African women and P=0·308 for Finnish women for differences between 10- and 20-µg groups in both ethnic groups. ![]() , Placebo;
, Placebo; ![]() , 10 µg;
, 10 µg; ![]() , 20 µg.
, 20 µg.
Discussion
This 5-month intervention was the first randomised controlled vitamin D dose–response study in East African and Caucasian women starting during the winter months, without natural UVB irradiation. The study demonstrated that supplementation with 10 and 20 µg of vitamin D3 was effective in increasing S-25(OH)D in both East African and Finnish women, whereas a significant decrease in S-25(OH)D concentrations occurred with placebo in both ethnic groups. No ethnic differences in S-25(OH)D response to vitamin D3 supplementation between the two ethnic groups were present.
To date, only a few dose–response vitamin D supplementation studies have been conducted in ethnically diverse populations( Reference Aloia, Patel and Dimaano 28 – Reference Gallagher, Jindal and Smith 30 ). Our study found no ethnic differences in S-25(OH)D response to vitamin D3 supplementation between East African and Finnish women, consistent with earlier findings that the effect of dose on S-25(OH)D is independent of race( Reference Aloia, Patel and Dimaano 28 , Reference Gallagher, Peacock and Yalamanchili 29 ). The two groups of women responded to vitamin D3 supplementation in the same way.
Although our results did not change after adjustment for BMI, the higher BMI found in East African women might have contributed to their lower mean S-25(OH)D concentrations. Studies have shown an inverse association between BMI and S-25(OH)D concentrations( Reference Gallagher, Sai and Templin 31 – Reference Drincic, Armas and Van Diest 34 ) as large fat mass reduces the bioavailability of synthesised vitamin D deposited in the body fat compartment( Reference Holick 4 , Reference Wortsman, Matsuoka and Chen 35 ). Negative effects of BMI≥25 kg/m2 on S-25(OH)D have been described among African Americans( Reference Gallagher, Yalamanchili and Smith 32 , Reference Benjamin, Moriakova and Akhter 36 ). According to Drincic et al. ( Reference Drincic, Armas and Van Diest 34 ), lower S-25(OH)D concentration in obese individuals was attributed to volumetric dilution of ingested or cutaneous vitamin D in the large fat mass. On the other hand, inconsistent results on the effect of BMI on dose–response of S-25(OH)D to vitamin D supplementation have been reported in some studies( Reference Talwar, Aloia and Pollack 37 , Reference Zhao, Zhou and Bu 38 ). For instance, Grønborg et al. ( Reference Grønborg, Lundby and Mølgaard 39 ) found no association between body fat and vitamin D status, and also that body fat had no effect on the response to vitamin D supplementation. Genetic factors may also influence S-25(OH)D circulation( Reference Wang, Zhang and Richards 40 , Reference Hansen, Tang and Hootman 41 ). A probable link between genetic background and response to vitamin D supplementation or dietary vitamin D exists; for instance, polymorphisms of the vitamin D receptor, vitamin D-binding protein or other genetic determinates of S-25(OH)D have been reported( Reference Elnenaei, Chandra and Mangion 42 , Reference Engelman, Meyers and Iyengar 43 ). A similar situation with women of African ancestry may exist in our study. Studies are needed to investigate association between genetic factors and S-25(OH)D among dark-skinned populations as the findings may be different from those among the Caucasian populations.
In the screening, less than half of the East African women had sufficient S-25(OH)D concentrations, whereas nine of ten of their Finnish peers reached the 50 nmol/l as suggested by the IOM( Reference Ross, Taylor and Yaktine 1 ) to cover the needs of 97·5 % of the population with regard to bone health. Besides IOM recommendation, the Endocrine Society suggested S-25(OH)D concentrations above 75 nmol/l for both bone and non-skeletal functions( Reference Holick, Binkley and Bischoff-Ferrari 44 ), and this was achieved by 38 % of Finnish women but only 7 % of East African women. Similarly to our study, lower S-25(OH)D concentrations were observed in Somali women (East Africans) than in Finnish women in an earlier study carried out in Finland( Reference Islam, Viljakainen and Kärkkäinen 12 ). In other countries besides Finland, high prevalence of vitamin D deficiency (S-25(OH)D<30 nmol/l) is commonly reported in Somali subjects (East Africans)( Reference Madar, Stene and Meyer 16 – Reference Osmancevic, Demeke and Gillstedt 18 ). On the contrary, vitamin D status in the general Finnish population has improved over the years and it is satisfactory( Reference Raulio, Erlund and Männistö 10 , Reference Jääskeläinen, Itkonen and Lundqvist 45 ). The S-25(OH)D concentrations in this study are comparable to those of the general population. Nonetheless, variation in prevalence of vitamin D deficiency among the European populations has been described( Reference Cashman, Dowling and Škrabáková 5 ). The inexistence of vitamin D deficiency and low insufficiency observed in Finnish women of our study may not represent other European populations, as higher vitamin D deficiencies have been reported( Reference Andersson, Björk and Kristiansson 6 , Reference Kalliokoski, Bergqvist and Löfvander 17 ).
Effectiveness of 10- or 20-µg vitamin D3 supplementation has been observed in studies involving participants with baseline mean S-25(OH)D concentrations above 50 nmol/l( Reference Cashman, Wallace and Horigan 46 , Reference Nelson, Blum and Hollis 47 ). Our results were also consistent with previous RCT among Pakistani immigrants( Reference Andersen, Mølgaard and Skovgaard 19 ) and Finnish women( Reference Viljakainen, Palssa and Karkkainen 48 ), as we observed an increase in mean S-25(OH)D concentrations with 10- and 20-µg dosages of vitamin D3 supplementation in both East African and Finnish women during the 5-month intervention. The mean S-25(OH)D concentrations decreased with placebo in both ethnic groups. The previous studies( Reference Andersen, Mølgaard and Skovgaard 19 , Reference Viljakainen, Palssa and Karkkainen 48 ) reported greater increments, which means stronger response to vitamin D3 supplementation, owing to lower basal S-25(OH)D concentrations than in our study. Considering the effect of baseline S-25(OH)D concentration on response to supplementations, other RCT( Reference Gallagher, Sai and Templin 31 , Reference Viljakainen, Palssa and Karkkainen 48 , Reference Islam, Shamim and Viljakainen 49 ) carried out, spanning over 1 year or less, among subjects with vitamin D insufficiency found an increase in the S-25(OH)D concentration above 50 nmol/l. For instance, in the studies by Gallagher et al., 10 µg of vitamin D3 increased S-25(OH)D concentrations by an average of 32·5 nmol/l, whereas a 20-µg dose sufficiently increased S-25(OH)D above 50 nmol/l in 98 % and 97·5 % of both Caucasian (baseline S-25(OH)D=39 nmol/l) and African-American women (baseline S-25(OH)D=33 nmol/l), respectively( Reference Gallagher, Peacock and Yalamanchili 29 , Reference Gallagher, Sai and Templin 31 ). These suggest that daily vitamin D supplementation at doses between 10 and 20 µg is probably adequate to maintain optimal S-25(OH)D concentrations without sunlight exposure during winter. Hence, doses above 20 µg may not have substantial additional benefits among persons with sufficient vitamin D concentrations.
Of interest, there was a substantial contribution of dietary sources to daily vitamin D intake, fortified fluid milk products being the major source of vitamin D for both groups of women, with higher intake in East African women. Although lower consumption of vitamin-D-fortified milk was reported among immigrant women than the native Swedish reference group( Reference Andersson, Björk and Kristiansson 6 ), milk from camels, cattle or goats is one of the staple diets (also beverage) in Somalia, and this may explain high milk consumption in our study( 50 – Reference Decker 52 ). Vitamin D intake from fortified fat spreads and fish was similar in both groups. Similar frequent consumption of fortified milk products, as one of the main dietary sources of vitamin D, has been reported in the general Finnish population( Reference Raulio, Erlund and Männistö 10 ). In both East African and Finnish women, there was similar dietary vitamin D intake among supplement users and non-users. The mean dietary vitamin D intake in both groups of women almost reached the 10-µg daily recommended intake of vitamin D( 24 ). However, the use of supplements increased the total mean vitamin D intake above the daily recommendation among the supplement users in both ethnic groups. Unlike in previous studies( Reference Andersson, Björk and Kristiansson 6 , Reference Islam, Viljakainen and Kärkkäinen 12 ), the rate of supplement use in our study was higher among the immigrant group. Nonetheless, higher vitamin D intake may not necessarily translate to higher S-25(OH)D concentration( Reference Islam, Viljakainen and Kärkkäinen 12 ). Despite higher dietary intake and personal supplementation observed in East African women, their mean S-25(OH)D concentrations were lower than in Finnish women.
Our experience of higher vitamin D intake and lower S-25(OH)D among East African women reflects lower endogenous vitamin D synthesis from UVB radiation during summer. Such absence of vitamin D production in the skin emphasises the relationship between the use of concealing clothes during summer and lower S-25(OH)D concentrations, especially among women( Reference Holick 4 , Reference Granlund, Ramnemark and Andersson 7 ). According to Gallagher et al. ( Reference Gallagher, Peacock and Yalamanchili 29 ), absorption and metabolism of vitamin D in African-American and Caucasian women are similar. Hence, the reported lower S-25(OH)D concentrations in dark-skinned individuals probably occur owing to decreased formation of vitamin D in the skin( Reference Zhao, Zhou and Bu 38 ). Besides oral vitamin D intake, this result suggests the presence of other factors (such as BMI and genetic factors) affecting S-25(OH)D concentrations in these women.
Some factors emerged as limitations against generalisation of this study’s findings. First, the baseline mean S-25(OH)D concentrations of the two groups of women included in the trial were quite sufficient (baseline mean S-25(OH)D>50 nmol/l). This means that the results may be different in subjects with vitamin D deficiency. Second, the use of personal vitamin D supplement was not restricted during the intervention, and a high proportion of personal vitamin D supplementation was found in East African women. Third, the homogeneity of the participants with regard to sex (only women) limits the applicability of the results to men in the population. Fourth, although the FFQ used to assess the vitamin D intake of all subjects was piloted among East African women, it was only validated among Finnish women (Caucasians)( Reference Itkonen, Erkkola and Skaffari 25 ). Thus, complete vitamin D intake in East African women might have not been evaluated. In addition, measurement error of the FFQ, such as over-reporting, might have contributed to the higher vitamin D intakes among East African women. The reported high consumption of fortified fluid milk may be culturally related to perceived status of milk as important staple diet in their home country.
One of the strengths of this research lies in the study design (randomised, placebo-controlled), which allowed for an objective evaluation of the effects of vitamin D3 doses on S-25(OH)D. Evaluation of compliance with vitamin D supplementation in this study is considered a strength, and dietary vitamin D intakes that were assessed at two different points proved the reliability of our data. Compliance rates with study supplementation, blood sampling and questionnaires, including FFQ, in both ethnic groups of women were high. Use of the participants’ preferred language, including translation (when necessary), during interviews enhances the quality of our data. Our first of its kind study provides up-to-date data on vitamin D intake and status in Finnish and East African women in Finland.
Conclusions
Supplementation with moderate vitamin D3 doses increased the S-25(OH)D concentrations in both East African and Finnish women during the 5-month intervention. Our study supports earlier findings that ethnicity has no effect on the response of S-25(OH)D to vitamin D3 supplementation. Future studies should focus on identifying the factors, other than dietary, associated with the greatest risk of vitamin D insufficiency in dark-skinned populations.
Acknowledgements
The authors thank all volunteer subjects who participated in the Marwo-D intervention study. The authors are grateful to the researchers in the Maamu study for their advice on participants’ recruitment. The authors also thank technician Anu Heiman-Lindh for laboratory analyses at the University of Helsinki. The authors acknowledge Oy Verman Ab, Kerava, Finland, for providing supplements and placebo tablets.
This work was carried out within ODIN WP6 (www.odin-vitamin D.eu), which is funded by the European Commission (grant agreement 613977). The funder was not involved in the design, analysis or writing of this article.
C. L.-A. and K. D. C. are grant holders. F. A. A., S. T. I., T. Ö., E. S., E. M. S., M. E. and C. L.-A. were involved in the design of the study. F. A. A., T. Ö., E. S. and E. M. S. collected the data. K. D. C. was responsible for the S-25(OH)D analyses at the University College Cork, Ireland. F. A. A. drafted the manuscript and performed the statistical analysis with the guidance of S. T. I. Evaluation of the results and comments on and critical reviews of the manuscript were carried out by S. T. I., M. E. and C. L.-A. All co-authors reviewed and approved the final draft of the manuscript.
The authors declare that there are no conflicts of interest.


