


Impact statement
The significance of this work is most powerful when viewed as a collection of four problems that can be used to solve one another. First, through a long history of fossil-fuel use, humans have spent generations increasing the concentration of CO2 in the atmosphere, and to avoid the worst impacts of climate change, we need to deploy both carbon capture and carbon dioxide removal. Both capture processes require gigatonne-scale durable carbon storage which can be achieved in part through carbon mineralization using the alkalinity present in some coal ashes. Second, because of historic coal combustion, thousands of tonnes of combustion waste products are ponded and landfilled across the US. If improperly lined, these deposits can leach toxic metals into the groundwater and, if breached, can flood waterways on a large scale. Beneficially reusing these ashes as feedstocks can lessen this risk. Third, the US lacks a domestic supply of rare earth elements (REE) and many critical minerals (CM) which are essential in energy transition technologies like wind turbines and magnets. Coal fly ash has been proposed as a feedstock for REEs. Finally, the US has built its modern energy economy on the backs of coal communities, and as fossil fuels are phased out in favor of lower-carbon energy, we threaten to leave them in the lurch. Siting REE recovery and carbon storage processes within coal communities and leveraging their mining expertise allows for a just workforce transition. This study aims to help solve these four challenges with one another by examining the carbon storage and REE/CM potential of coal ash as a feedstock, benchmarking the energy and reagent carbon intensities necessary to achieve meaningful carbon removals.
Introduction
To avoid the most extreme impacts of climate change, we must limit global warming to 1.5–2.0 °C by 2050. In the suite of carbon emissions management strategies, point-source carbon capture and direct air capture are heavy players, and both strategies produce high-purity streams of CO2 that must be durably stored. Carbon storage can be done with subsurface geologic storage via supercritical CO2 injection and an in situ strategy but can also be done ex situ via various mineralization strategies. Carbon dioxide mineralization or mineral carbonation, neutralizes acidic CO2 with basic (alkaline) metal oxides and hydroxides, making mineral carbonation at its core an acid–base neutralization problem. One such mineralization pathway is indirect carbonation, reacting high-purity CO2 with dissolved Ca and Mg oxides or hydroxides to form geologically stable Ca and Mg carbonates. Analogous to natural processes like silicate weathering, which can uptake CO2 on a geologic timescale, engineering mineralization processes convert CO2 to environmentally benign and chemically stable carbonate minerals, taking advantage of favorable thermodynamics and enhanced reaction kinetics (Berner, Reference Berner1982).
Many industrial waste materials are promising for carbon storage due to their high Ca and Mg content and higher relative reactivity compared to natural alkalinity sources (Krevor and Lackner, Reference Krevor and Lackner2011). These sources include ultramafic tailings, red mud, Ni-laterite, steel slag, cement kiln dust and. as discussed in this paper, coal ash Walker et al., Reference Walker, Bell and Kerry2024). The mineralization products from these feedstocks vary in utility based on their major phase composition and impurities present. Carbonated products from some fly ashes can be used as supplementary cementitious material in construction materials, given it meets standards. Despite the breadth of secondary sources with potential for carbon storage, gigatonnes of material will be required to achieve measurable emissions management. Sourcing coal fly ash from coal-fired power plants and industrial facilities that use coal as a fuel requires a feedstock production rate that is dwarfed by the scale of CO2 emissions associated.
Presenting an auspicious solution to the volume of Ca/Mg demand without an associated scale of emissions is the United States’ (US) vast deposits of coal ash, which may be supplemented by the fresh coal fly ash produced each year. More than 1 billion tons of coal ash have been landfilled since 1991, and in 2022, the US produced more than 28 million short tons of coal fly ash (and as much as 50 million tons in 2014) (DOE, 2022; ACAA, 2025a). The coal ashes vary in Ca and Mg concentration and other properties depending on the class of coal being combusted and whether the ash is fresh or landfilled. Most coal combusted in the US is subbituminous (46% of US total) and bituminous (also 46%): subbituminous coal trends higher in total Ca concentration, and metals in subbituminous coal are more labile to acids due to the higher relative ratio of CaO to silica and alumina (Taggart et al., Reference Taggart, Hower, Dwyer and Hsu-Kim2016). Fresh fly ash is known to be beneficially reused in concrete products, as clinker feed, in structural fills and in soil modification, with approximately 75% of US-produced fly ash utilized annually (ACAA, 2025a).
Direct carbonation of coal ash allows for carbon storage, but not separation of potentially valuable coproducts like rare earth elements (REE) (Dananjayan et al., Reference Dananjayan, Kandasamy and Andimuthu2016). For samples with low alkalinity content, the carbon storage potential alone may be insufficient to offset the energy- and reagent-related emissions of processing. In these cases, coproduct recovery must be considered within the LCA boundary to evaluate whether avoided emissions from displaced conventional products can improve the life cycle performance of the system. Traditional REE sourcing methods use high-pressure acid leaching followed by scrubbing, stripping and precipitation steps to further purify. When coupling REE recovery with carbon mineralization, major ash components like iron and aluminum silicates must be separated and may offer pathways for avoided emissions in industry. A simplified mineral carbonation reaction with REE, iron, aluminum and silicon recovery is shown below.

Typical coal ash mineralogy sees the presence of mineral phases like mullite (Al2O3·SiO2), hematite (Fe2O3), quartz (SiO2), lime (CaO), periclase (MgO), gypsum (CaSO4·2H2O) and amorphous aluminosilicate glass (Dananjayan et al., Reference Dananjayan, Kandasamy and Andimuthu2016; Burgess et al., Reference Burgess, Chiu, Cain, Roth, Keller and Granite2024). The success of coal ash as a feedstock for carbon storage depends critically on the cost and efficiency with which the alkalinity and potential coproducts can be extracted from the feedstock, purified and subsequently carbonated.
Rare earth element recovery from coal ash has been avidly studied in recent literature (Dodbiba and Fujita, Reference Dodbiba and Fujita2023; Bisen et al., Reference Bisen, Sharma and Chattopadhyay2025; Saleh et al., Reference Saleh, Adeleke, Olosho, Ikubanni, Adesina, Aminu and Omotosho2026; Balaram and Manikyamba, Reference Balaram and Manikyamba2026). Furthermore, coal ash has been assessed as an alkaline feedstock for carbon storage (Gerdemann et al., Reference Gerdemann, O’Conner, Dahlin, Penner and Rush2007; Kirchofer et al., Reference Kirchofer, Brandt, Krevor, Prigiobbe and Wilcox2012; Wee, Reference Wee2013; Uliasz-Bocheńczyk, Reference Uliasz-Bocheńczyk2024). No study, however, has yet assessed the coupling of these processes, performing a scheme that optimizes energy and material use inputs and REE recovery and carbon storage outputs through a life cycle lens informed by experimental results. The goal of this paper is to assess coal ash processing with CO2 mineralization and REE recovery, allowing for the tracking of energy and material inputs and outputs, with a cradle-to-gate system boundary. This paper analyzes the carbon storage and REE recovery potential of high- and low-carbon-storage-potential coal ashes and aims to create a boundary-setting contribution to the fields of CO2 mineralization and industrial CDR through exploring an electrochemically integrated alkalinity recovery and mineralization platform.
Methods
Life cycle assessment
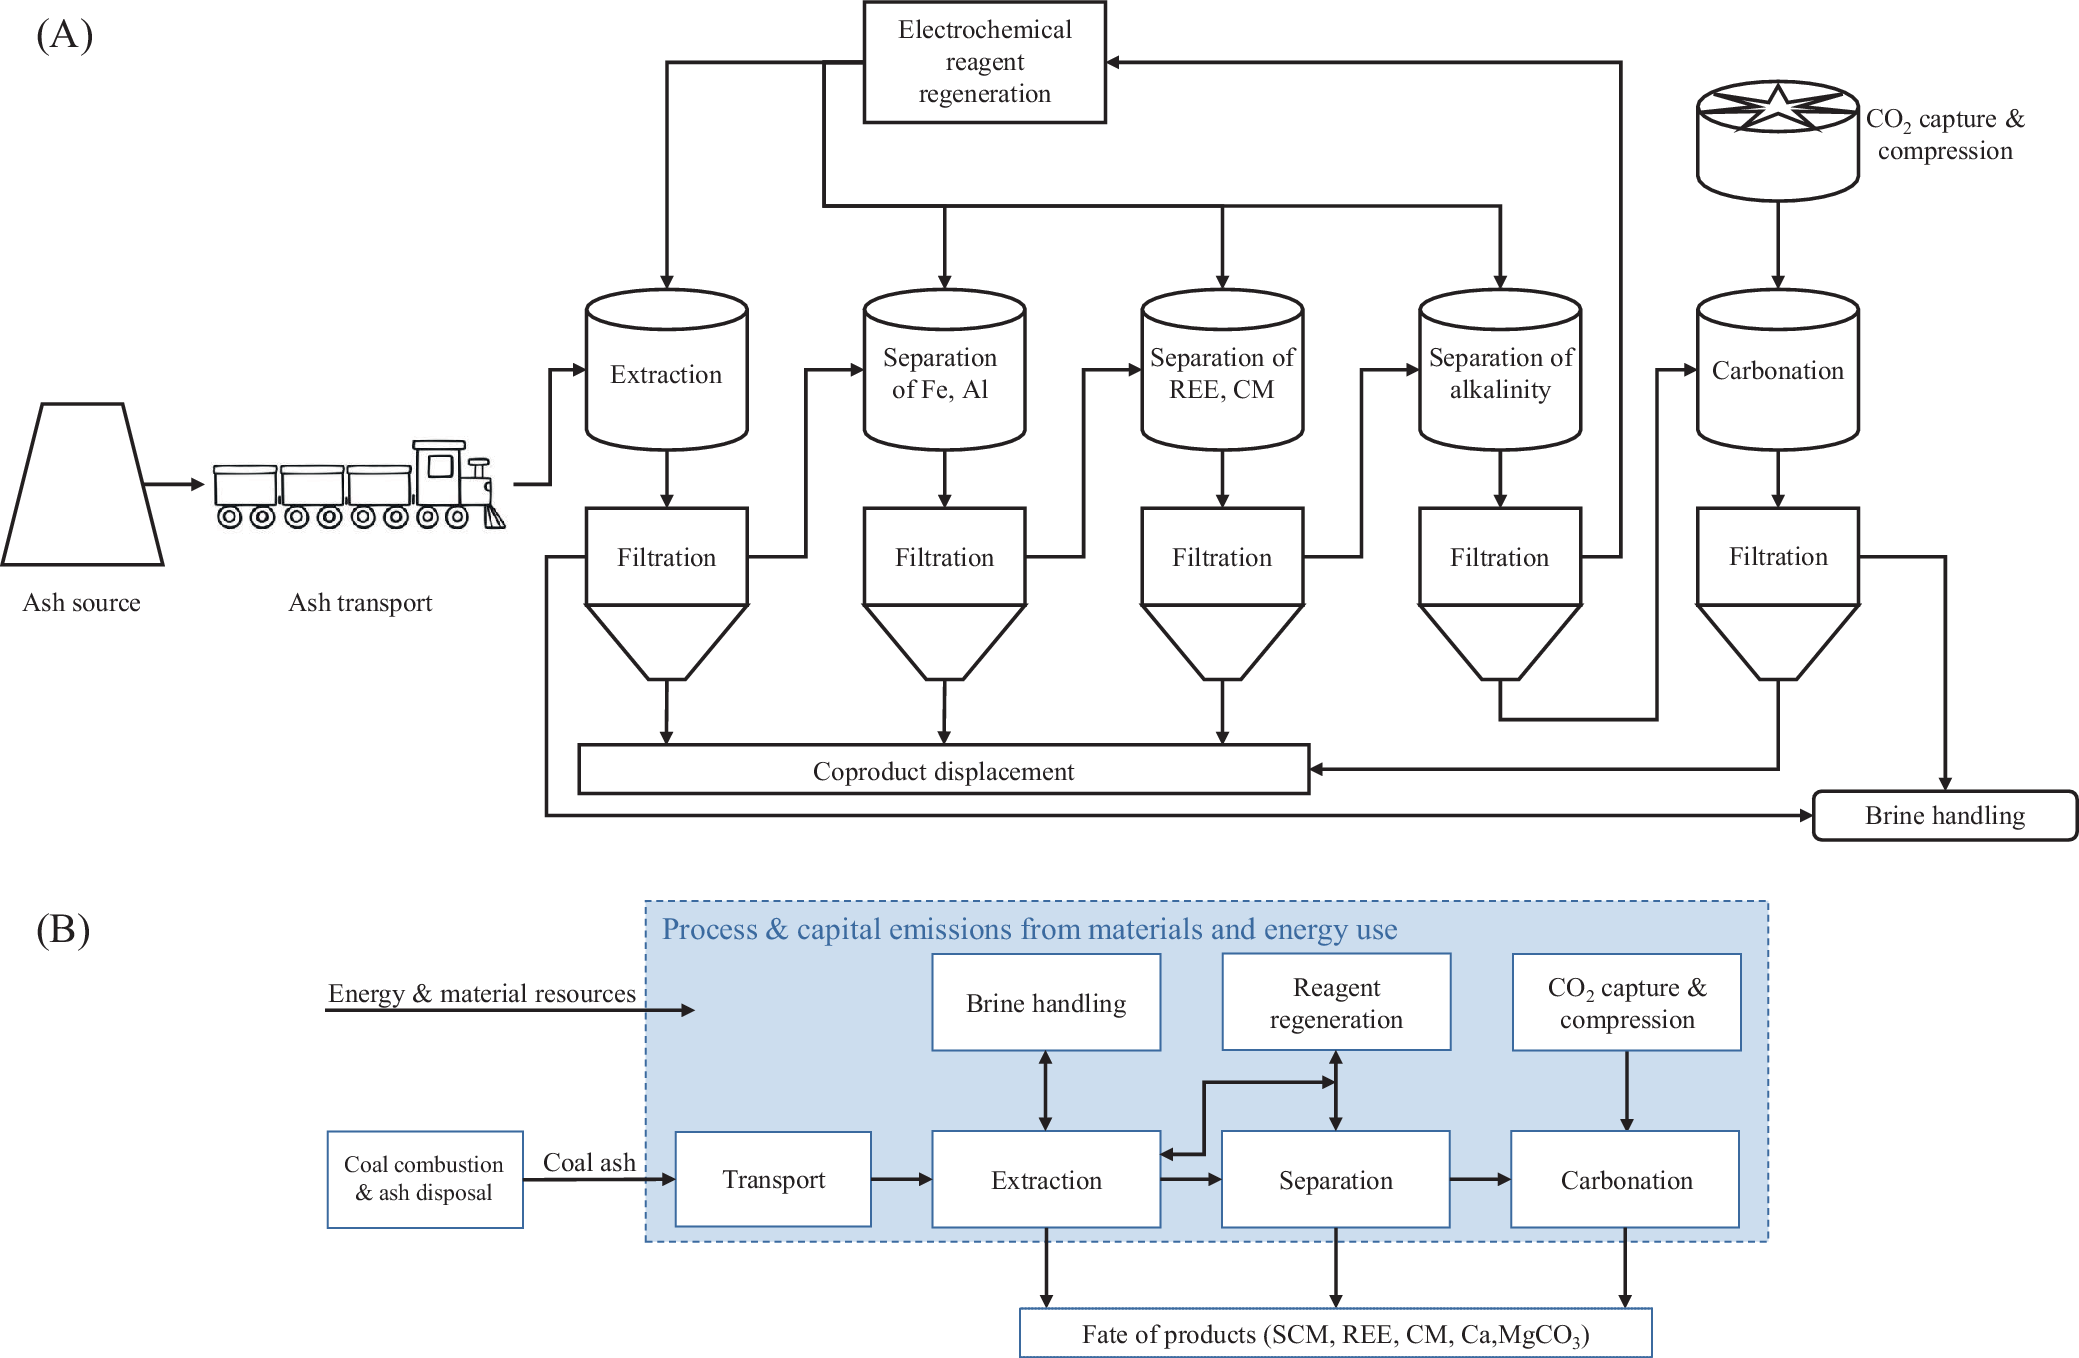
The goal of our life cycle assessment (LCA) is to compare the REE recovery efficiency and net CO2 emissions intensity of various coal ash feedstocks; energy, reagent and CO2 sources; and feedstock transport distances by determining the energy and material inputs associated with each process design. Our tool relies on experimental data acquired in-house, and peer-reviewed scientific literature (Zhang and Honaker, Reference Zhang and Honaker2020). The important process variables contributing to the overall LCA are (1) grid carbon intensity, (2) ash feedstock and its inherent elemental composition, particle size distribution and moisture content and the requisite grinding and drying extent, (3) CO2 source and the associated separation and compression energy, (4) the extent to which the chemical reagents are repurchased or electrochemically replenished each pass through the system and (5) ash feedstock transport distance. All main process stages are included in this LCA, and comprehensive system boundaries are applied throughout. In Figure 1A, we show the process schematic, and in Figure 1B, we illustrate the system boundary. Because this LCA models many unit operations within this process, the tool is built at a general, first-order level. Therefore, the downstream use, disposal or long-term management of produced carbonates and recovered critical metals is outside the scope of this study. Future work should expand the system boundary to cradle-to-grave by evaluating carbonate product fate, coproduct purification requirements, market acceptance and end-use or disposal pathways.
(A) Process schematic. (B) System boundary.

Figure 1. Long description
Panel A is a process flowchart. It begins on the far left with an Ash source and Ash transport via train. The ash enters a series of four vertical stages, each consisting of a tank atop a filtration funnel. These stages are labeled Extraction, Separation of F e, A l, Separation of R E E, C M, and Separation of alkalinity. A top-mounted box labeled Electrochemical reagent regeneration feeds into these tanks. Below the first four filtration units is a horizontal box for Coproduct displacement. To the right, a separate vertical line shows C O sub 2 capture and compression feeding into a Carbonation tank and Filtration unit. The final output on the bottom right is Brine handling.
Panel B shows the system boundary. On the left, external inputs include Energy and material resources and Coal combustion and ash disposal. These feed into a central blue-shaded box labeled Process and capital emissions from materials and energy use. Inside this box, a linear flow moves from Transport to Extraction to Separation to Carbonation. Above this line are boxes for Brine handling, Reagent regeneration, and C O sub 2 capture and compression, connected by bidirectional arrows. Below the central line, arrows point to a final box labeled Fate of products including S C M, R E E, C M, and C a, M g C O sub 3.
This comparative life cycle assessment model accounts for the following types of energy consumption and associated emissions: on-site energy consumption for running the process and the embodied energy of material inputs to unit construction (e.g., resource requirements and associated emissions of steel production to construct an on-site ball mill). Accounting for on-site and embodied emissions allows for a more comprehensive accounting of greenhouse gas (GHG) emissions of the process scheme. The functional unit for the model is 1 tonne of ash processed.
The process-model core of the ash processing LCA tool includes 11 process stages, illustrated in Figure 1.
-
1. Ash sourcing – sourcing the coal ash feedstock including energy accounting for mining, grinding and drying.
-
2. Ash transport – movement of ground, dried feedstock from ash pond/landfill or coal-fired power plant to processing location.
-
3. Extraction – chemical leaching of metals into acidic solution followed by solid–liquid separation via filtration resulting in metal-rich leaching liquor and metal-depleted aluminosilicate solids.
-
4. Separation of iron and aluminum – precipitation of iron and aluminum hydroxides via addition of base and pH increase followed by solid–liquid separation via filtration resulting in Fe- and Al-depleted liquor and solid hydroxides.
-
5. Separation of rare earth elements and other critical minerals (CM) – precipitation of REE and CM hydroxides via addition of base and pH increase followed by solid–liquid separation via filtration resulting in REE- and CM-depleted liquor and solid hydroxides (e.g., REE, Ti, Cr, Mn and Ni).
-
6. Separation of alkalinity – precipitation of calcium and magnesium hydroxides via addition of base and pH increase, followed by solid–liquid separation via filtration, resulting in aqueous NaCl and solid hydroxides.
-
7. CO2 sourcing – capture and compression emissions intensity factors for various pure, pressurized CO2 sources (e.g., amine point source capture, alkali hydroxide direct air capture).
-
8. Carbonation – reaction between alkaline hydroxide slurry and gaseous CO2 forming solid carbonate species.
-
9. Electrochemical reagent regeneration – emissions intensity factors for the production of HCl and NaOH from aqueous NaCl.
-
10. Coproduct displacement – system expansion via avoided burden as a methodology for coproduct emissions displacement.
-
11. Brine handling – treatment of mildly acidic brines and slurry/produced water from carbonation and disposal of brines for long-term storage.
Each of these stages is modeled using physical and chemical principles and, in some cases with experimental data, described in detail in Supplementary Information.
Case study: Break-even scenario
In this paper, we examine three case studies to achieve net removals. We first perform a baseline LCA to determine preliminary emissions analysis of the process flow. Then we examine a break-even scenario where we establish a fundamental constraint that the CO2e emissions produced for 1 tonne of ash flowing through the process must be lower than the carbon storage capacity of the ash feedstock. Based on the calcium and magnesium content, the stoichiometric potential for carbon mineralization assuming perfect alkalinity recovery. This parameter is capped by the reactive CaO and MgO content of the ash feedstock. Assuming 100% efficiency through extraction (Equation 2), separation (Equation 3) and carbonation (Equation 4), the process has an overall reaction of Equation 5. Based on stoichiometric mass ratios (
$ {m}_{a\_C{O}_2}/{m}_{a\_ Ca} $
 ), 1 tonne of Ca stores 1.098 tonnes of CO2, and 1 tonne of Mg stores 1.81 tonnes of CO2.


We recognize the limitation of treating calcium and magnesium as simple oxides but use this assumption for the calculation of a theoretical maximum. Clay mineral and quartz in coal melt to an amorphous glassy phase during combustion; this aluminosilicate glass is resistant to acid leaching and may limit metal recovery during extraction (Hower et al., Reference Hower, Kolker, Hsu-Kim, Plata, Karamalidis and Eggert2025). Studies on REE recovery from coal fly ash find limited extraction of REE due to encapsulation in this amorphous silicate phase (King et al., Reference King, Sham, Gordon and Dyar2013; Hower et al., Reference Hower, Dai, Seredin, Zhao, Kostova, Mardon and Gurdal2013a, Reference Hower, Groppo, Joshi, Dai, Moecher and Johnston2013b; Kolker et al., Reference Kolker, Scott, Hower, Vazquez, Lopano and Dai2017). Alkalinity encapsulated in this phase may be resistant to recovery.
To break even in terms of net CO2, and assuming our adaptable variables are electric grid carbon intensity, carbon intensity of the reagent makeup and capital emissions (for which steel dominates), we examine what carbon intensities are required for each variable. In Supplementary Table S4, we show the energy and mass demands for the system by stage. Assuming these values stay constant, we can adjust the electricity, reagent and capital (steel) carbon intensity (CI) to explore scenarios where removal is possible.
We examine break-even potential first by defining an analytical break-even expression in Equation 6, where a maximum emissions threshold is set based on the feedstock composition and carrying capacity. In other words, to achieve a net-zero process, the total emissions must be less than or equal to the carbon carrying capacity. Note that we combine HCl and NaOH reagent CI into a single variable because they are both regenerated through the same electrochemical system.

We vary capital steel CI by varying plant lifetime, setting two of the three variables and solving for the third.
Case study: Coproduct-displacement scenario
Using system expansion, coproduction of valuable metals and minerals can allow for avoided CO2 burden. Assuming the coproducts of this system (REE, critical metals and silicate residue) displace conventional, emissions-intensive production pathways, we calculate the mass of CO2e emitted through traditional means of producing the metal and mineral coproducts and count this value as potential CO2e avoided through coproduct displacement. The sum of emissions avoided through coproduct displacement plus the original carbon-carrying capacity is equal to the accounting-expanded carrying capacity (Supplementary Table S7).
The displacement assumptions for the emissions avoided from coproducts are optimistic, with full displacement of the primary metals. Alternatively, we can take the break-even modeling scenario described previously as a pessimistic coproduct displacement case where we see zero credit for coproducts. Market displacement of coproducts is uncertain, and products differ in quality from the primary materials. Market size (outside the scope of this paper) may be small compared to production scale. While acknowledging the vulnerability of crediting avoided emissions to these coproducts, we explore an optimistic system expansion scenario to understand avoided emissions from coproducts. Note the distinction between a physical carbon carrying capacity defined by ash alkalinity content with a stoichiometric and thermodynamic limit and accounting-expanded carrying capacity which includes market displacement credits arising from system boundary and accounting assumptions. Explicit equations calculating both carrying capacities can be found in the Supplementary Equation S1.
Case study: Coal fly ash counterfactual scenario
We assume that fresh coal fly ash carries no upstream emissions, and while this is a common assumption, it may be incomplete. As of 2023, 71% of fresh coal fly ash is beneficially reused in cement or concrete applications (ACAA, 2025b). Ash not beneficially reused is landfilled. From a supplementary cementitious material (SCM) perspective, fly ash is the most widely used SCM (over steel slag, silica fume and natural pozzolans) (NAHB, 2019; Lopez et al., Reference Lopez, Stempihar and Karam2024). End uses vary by fly ash class: class C is used in higher-performance mixtures where strength is important due to its good pozzolanic and cementitious properties; class F is effective in moderating heat gain during curing and is better for use in hot-weather climates. Use of fresh coal fly ash as a feedstock for carbon mineralization may divert fly ash away from use as an SCM. To strengthen LCA defensibility, we examine the break-even point at which an indirect carbon mineralization process stores or avoids more CO2 emissions than fly ash’s displacement of SCMs and ordinary Portland cement (OPC). The traditional use of coal fly ash can already displace up to 1.02 tCO2e/t-ash (the CI of OPC) (Hossain et al., Reference Hossain, Dong and Ng2021). If our process does not achieve an emissions intensity lower than −1.02 tCO2e/t-ash, then it cannot claim a better climate advantage than the counterfactual use. In essence: if fresh coal fly ash is already displacing clinker, then the relevant benchmark is not zero emissions, but the mass of CO2 avoided by displacing SCMs. We must reframe the feasibility statement: mineralization and avoided burden must outperform the existing clinker displacement benefit to claim climate advantage.
In our LCA, during the extraction stage, 1 tonne of ash enters the stage, and 0.9 tonnes of metal-depleted silicate exits the stage. Due to rinsing, we can assume there is no chemical residue on the solid silicates exiting the system, which are in turn used as SCMs. We seek to understand what conditions lead to more CO2 avoided than the standard use of fly ash as an SCM, as illustrated in Supplementary Figure S3. We study two fresh fly ashes in this LCA: sample S (class C) and sample M (class F), and we examine what reagent and grid energy intensities are required to achieve 1.02 tonnes of removal per tonne of ash (baseline for use displacing OPC).
Results and discussion
Baseline scenario modeling
The preliminary LCA results indicate that the current mineral carbonation pathway, based on high-molarity acid leaching, multi-stage precipitation with NaOH-driven pH adjustment, and ambient carbonation is not net CO2 removal under base, optimistic or pessimistic scenarios. Process emissions dominate the system, particularly from the extraction and separation reagents and energy flows. At baseline, the produced emissions are an order of magnitude greater than those stored, meaning the system is structurally dominated by chemical and energy inputs; even modest embodied emissions for HCl and NaOH can eliminate removal potential, and the extraction step is an emissions hot spot. The key question is therefore not whether the baseline configuration constitutes a CO2 removal pathway, but what chemical, energy and counterfactual constraints must be satisfied for the process to achieve net removal. This work is a boundary-setting contribution to the CO2 mineralization and industrial CDR field.
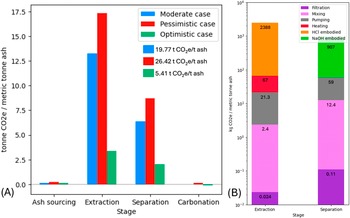
In Supplementary Table S1, we show the parameters used in each of the three base cases. Data specifics for these parameters can also be found in the Supplementary Information. In Figure 2, we show a stage-by-stage comparison for the three different baseline scenarios. In all scenarios, the extraction and separation stages dominate emissions. The optimistic scenario is closest to achieving removal, with 5.41 t CO2e emitted per tonne of ash processed, but it remains far from net-zero. To understand the specific sources of these emissions, we break down the extraction and separation stages by unit (e.g., filtration, pumping) and reagent (HCl and NaOH) in Figure 2B, confirming that reagent use is the primary driver of high emissions.
(A) Stage-by-stage comparison of the emissions per tonne of coal ash processed for three baseline cases: a moderate pessimistic and optimistic case. Data is shown for feedstock C. (B) Individual emissions breakdowns by unit for the optimistic case for the extraction and separation stages. HCl and NaOH reagent embodied emissions dominate. Capital emissions are not included; thus, the columns total 2478 and 979 kg instead of 3370 and 2002 kg shown in (A).

Figure 2. Long description
Panel A is a grouped bar chart. The Y-axis represents tonne C O sub 2 e per metric tonne ash, ranging from 0 to 17.5. The X-axis lists four stages: Ash sourcing, Extraction, Separation, and Carbonation. Three cases are compared: Moderate case in blue, Pessimistic case in red, and Optimistic case in green. Extraction shows the highest emissions, peaking at over 15 for the Pessimistic case. Separation is the second highest. Ash sourcing and Carbonation show negligible emissions. A legend indicates total emissions: 19.77 for Moderate, 26.42 for Pessimistic, and 5.41 for Optimistic.
Panel B is a stacked bar chart with a logarithmic Y-axis representing k g C O sub 2 e per metric tonne ash, ranging from 10 super minus 2 to 10 super 4. It breaks down the Optimistic case for Extraction and Separation stages.
For Extraction, the stack from bottom to top includes:
- Filtration: 0.024
- Mixing: 2.4
- Pumping: 21.3
- Heating: 67
- H Cl embodied: 2388
For Separation, the stack from bottom to top includes:
- Filtration: 0.11
- Mixing: 12.4
- Pumping: 59
- N a O H embodied: 907
At baseline, even in optimistic cases, the system uses high-concentration HCl for dissolution and NaOH for multi-stage precipitation with elevated dissolution temperatures. If these reagents are conventionally sourced (i.e., chlor-alkali supply chains), embodied emissions are extremely high relative to CO2 stored. Preliminary sensitivity analyses (Supplementary Figure S1) show reagent replenishment and grid CI as the dominant uncertainty drivers. The other parameters have a significantly lower impact on LCA variability, with the following deviation from baseline cases: CO2 source (± 0.3%), transport distance (± 0.1%) and moisture content (± 0.04%).
Break-even scenario
We examine a range of feedstocks, as shown in Supplementary Table S2; sample S has calcium content of 34.02%, while sample M has a Ca content of 3.2%; 0.52% and 0.47% are the respective Mg contents. With these assumed perfect conditions, these alkalinity values give carbon storage potentials between 44.2 kg CO2 stored per tonne of ash (sample M) and 463.6 kg CO2 stored (sample S). Thus, the total upstream emissions of the extraction and separation process must be lower than this threshold for net removal. This feasibility is constrained by stoichiometry to different extents based on the feedstock. As seen in Supplementary Table S3, sample M has a 10x lower carbon carrying capacity (0.044 t) than sample S (0.464 t).
We plot break-even potential by grid CI (g CO2e/kWh) and reagent CI (g CO2e/kg reagent) with contours by plant lifetime. Supplementary Figure S2 shows the contour plots for the break-even scenario for samples S and M. Optimistic models for a decarbonized electric grid estimate a CI of 50 gCO2e/kWh (Stauffer, Reference Stauffer2024). For a 20-year plant lifetime and a grid of 50 gCO2e/kWh, the required reagent CI is 14.67 gCO2e/kg reagent. Based on current chlor-alkali reagent regeneration technology energy demand and efficiency, with a decarbonized electric grid (50 gCO2e/kWh), estimated emissions are 115 gCO2e/kg reagent (Garcia-Herrero et al., Reference Garcia-Herrero, Margallo, Onandia, Aldaco and Irabien2017). Even with a deeply decarbonized grid, the required reagent CI is substantially lower than values estimated for current electrochemical regeneration technologies. Technology for the replenishment of HCl and NaOH must advance considerably for this case to be realistic. Because of the much lower carbon carrying capacity of sample M, the respective carbon intensities become even more constricted. Our LCA uses the electric grid as the energy source for the system, but lower emissions may be achieved by powering directly with a renewable energy system where the emissions intensity approaches zero.
This section presents our first pathway toward removal for the indirect carbonation of coal ash: to achieve net-zero or net-negative emissions via this pathway, the system must be powered by extremely clean power (in some cases cleaner than the predicted decarbonized grid) with near-perfect reagent regeneration powered by said clean grid.
Coproduct displacement scenario
One motivation for considering a reagent- and energy-intensive extraction, separation and indirect carbonation process is the potential recovery of coproducts that can offset process emissions through avoided burden accounting. These coproducts include REE and critical metals, metal-depleted silicate residue from extraction, and iron and aluminum hydroxides from separation. Supplementary Table S5 shows the mass of each coproduct produced through the experimental process for each of the four feedstocks and the corresponding CO2 emissions equivalents avoided given coproduct displacement. Samples S and M have the largest CO2e avoided (1869 and 1435 kg/tonne ash, respectively) based predominantly on the metals recovered in the separation stage. Including the coproduct avoided emissions, the accounting-expanded carrying capacity for the feedstock changes; compare Supplementary Tables S3 and S6.
Recall that samples M and C had the highest REE concentrations (490 and 460 ppm respectively), yet samples S and C show the highest REE extraction efficiency. Our findings, confirmed by literature, show increasing REE extractability with increasing Ca content, so despite sample S having the lowest total REE concentration, it has the highest extraction efficiency (averaging between 45% and 68% efficiency), resulting in the greatest REE recovery per tonne (Taggart et al., Reference Taggart, Hower, Dwyer and Hsu-Kim2016). This can be compared to sample M which has between 17% and 20% dissolution efficiency for REEs. This trend could be explained mineralogically by the ease with which light REEs substitute for Ca due to similar ionic radii: Ca2+ = 1.12 Å = Pr3+ (Shannon Reference Shannon1976; Elzinga et al., Reference Elzinga, Reeder, Withers, Peale, Mason, Beck and Hess2002). Thus, when the calcium-bearing phases dissolve, the REEs go into solution. Alternatively, the dissolution of the calcium-bearing phase could expose more of the recalcitrant aluminosilicate phase in which the REEs are present.
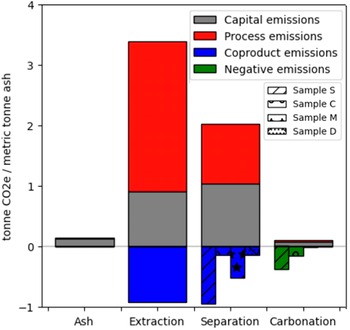
In Figure 3, we show the emissions (for the optimistic baseline scenario) for each of the four samples broken down by capital and process (as shown in Figure 1B, the system boundary) and negative and coproduct avoided emissions. There are negligible differences in the majority of emissions categories and stages, with the exception of the avoided emissions from coproducts of separation and the negative emissions from carbonation. The samples are differentiated by hatching pattern. Sample S has the most significant coproduct avoided emissions (−0.95 tCO2e/t ash) and negative emissions (−0.38 tCO2e/t ash). We can compare that to sample C, which has minimal avoided emissions from separation coproducts (−0.14 tCO2e/t ash) but the second-highest carbon storage potential (−0.16 tCO2e/t ash). At the other end of the spectrum is sample M, with low carbon storage potential (−0.02 tCO2e/t ash) but significant avoided emissions from separation coproducts (−0.52 tCO2e/t ash).
Total emissions (optimistic baseline scenario) broken down by process, capital, coproduct and negative. The four samples have negligible differences in most of the categories, with the exception of the avoided coproduct emissions during separation and negative emissions from carbonation. Samples S, C, M and D are plotted with various hatching to illustrate differences.

Figure 3. Long description
A stacked bar chart with a Y-axis ranging from minus 1 to 4 tonne C O sub 2 e / metric tonne ash. The X-axis lists four stages: Ash, Extraction, Separation, and Carbonation.
Two legends are present. The first defines emission types: grey for Capital emissions, red for Process emissions, blue for Coproduct emissions, and green for Negative emissions. The second defines sample hatching: diagonal lines for Sample S, circles for Sample C, stars for Sample M, and dots for Sample D.
* Ash: A single small grey bar at approximately 0.15.
* Extraction: A tall stack with grey at 0 to 0.9 and red extending to 3.4. Below the zero line, a solid blue bar reaches minus 0.9.
* Separation: A stack with grey at 0 to 1.05 and red extending to 2.05. Below the zero line, four distinct blue bars represent the samples: Sample S reaches minus 0.95, Sample C reaches minus 0.15, Sample M reaches minus 0.5, and Sample D reaches minus 0.15.
* Carbonation: A very small stack above zero with grey and red layers. Below the zero line, four green bars represent the samples: Sample S reaches minus 0.4, Sample C reaches minus 0.15, Sample M reaches 0, and Sample D reaches 0.
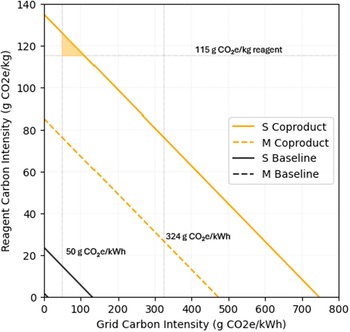
Without coproduct system expansion via avoided CO2 burden, feedstock S (20-year lifetime) requires a reagent CI of 14.67 gCO2e/kg reagent when using a decarbonized electric grid (50 gCO2e/kWh), almost ten times lower than current electrochemical processes using decarbonized electricity (115 gCO2e/kg). However, with coproduct accounting, the reagent emissions intensity can be as high as 126 gCO2e/kg reagent. The chlor-alkali process is used to electrochemically regenerate the HCl and NaOH reagents due to the high CI of virgin feedstock (1215 gCO2e/kg reagent average) (Herrero-Gonzalez et al., Reference Herrero-Gonzalez, Diaz-Guridi, Dominguez-Ramos, Irabien and Raquel2020). Given the respective carbon intensities of the recycled and virgin feedstocks, the maximum allowable percentage of virgin feedstock per tonne ash S is 1.0%. The shaded yellow section of Figure 4 represents the feasible break-even scenarios given a decarbonized electric grid and electrochemical reagent recovery powered by said grid.
Break-even plot comparing two scenarios (1) baseline, (2) including coproducts for feedstocks S and M. Note the axis break to add resolution to baseline and low reagent demand scenarios. 2025 US electric grid carbon intensity (324 g CO2e/kWh), the decarbonized grid carbon intensity (50 g CO2e/kWh) and chlor-alkali emissions intensity (115 g CO2e/kg reagent) are plotted for perspective. The filled-in yellow triangle represents an achievable range of emissions intensities that result in net-zero or negative emissions. The triangle borders are (vertical) the predicted carbon intensity of a decarbonized US electric grid, (horizontal) the carbon intensity of reagent regeneration using a decarbonized electric grid and (diagonal) the break-even line for feedstock S including coproduct consideration.

Figure 4. Long description
A line graph with the x-axis labeled Grid Carbon Intensity in g C O sub 2 e / k W h, ranging from 0 to 800. The y-axis is labeled Reagent Carbon Intensity in g C O sub 2 e / k g, ranging from 0 to 140.
Four linear trends with negative slopes are shown:
* S Baseline: A solid black line starting at y equals 24 and hitting x equals 0 at approximately 130.
* M Baseline: A dashed black line overlapping the lower left corner.
* S Coproduct: A solid orange line starting at y equals 135 and ending at x equals 750.
* M Coproduct: A dashed orange line starting at y equals 85 and ending at x equals 470.
Key reference points and regions include:
* A vertical dashed line at x equals 50 labeled 50 g C O sub 2 e / k W h.
* A vertical dashed line at x equals 324 labeled 324 g C O sub 2 e / k W h.
* A horizontal dashed line at y equals 115 labeled 115 g C O sub 2 e / k g reagent.
* A small yellow shaded triangle is located in the top-left corner, bounded by the y-axis, the horizontal 115 line, and the S Coproduct line.
A legend on the right side identifies the four lines: S Coproduct (solid orange), M Coproduct (dashed orange), S Baseline (solid black), and M Baseline (dashed black).
Feedstock M similarly experiences a dramatic increase in allowable energy and reagent conditions with coproduct displacement, with a 33-fold increase in carrying capacity (0.044 tonnes to 1.479 tonnes per tonne ash). Without coproduct displacement, even with the low reagent and energy case, feedstock M could have a maximum grid CI of 13.14 gCO2e/kWh (given an almost zero CI for the reagents). Net-zero is not achievable when using the decarbonized electric grid for sample M without coproduct allocation. Accounting for coproducts creates a possible scenario for carbon break-even for the feedstock. With a decarbonized grid, the reagent emissions intensity can be as high as 76.3 gCO2e/kg reagent. This is below the emissions intensity of the current electrochemical regeneration process at 100% efficiency and is unfeasible given current technology.
This section presents our second pathway toward removal for the indirect carbonation of coal ash: to achieve net-zero or net-negative emissions via this pathway, the system must efficiently recover valuable coproducts to contribute avoided emissions, be powered by a nearly decarbonized grid and have very little virgin feedstock added each pass through the system. Certain feedstocks are precluded from this scenario due to a combination of either or both low carbon storage potential or low coproduct recovery potential.
Coal fly ash counterfactual scenario
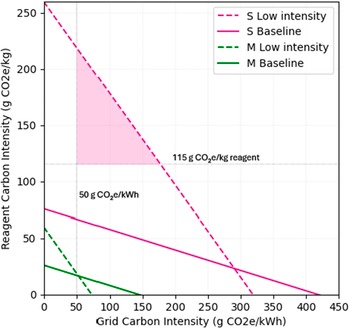
The counterfactual scenario evaluates the conventional use of fresh coal fly ash as a SCM. To strengthen LCA defensibility, we examine the break-even point at which the indirect carbon mineralization of coal fly ash stores or avoids more CO2 emissions than fly ash’s displacement of SCMs and OPC. For the fresh feedstocks, we determine the grid and reagent carbon intensities (for a 20 year plant lifetime) required to achieve 1.02 tonnes of removal. With the strong reagent concentration, high energy use and high coproduct recovery as the baseline scenario, we plotted the break-even curves for samples S and M in Figure 5. For a decarbonized grid (50 gCO2e/kWh), sample S requires a reagent intensity of 66.7 gCO2e/kg and sample M requires 17.0 gCO2e/kg, both lower than the benchmark technology. Using our experimental system as designed will likely not lead to removals greater than 1.02 tCO2e/t. Given this technological incompatibility, we examine a scenario where less concentrated reagent is used and energy is more efficient, sacrificing coproduct recovery efficiency. We make the assumption that reducing the reagent molarity will result in a 50% reduction in coproduct recovery. We then evaluate whether this tradeoff allows the system to outperform the counterfactual use of fresh fly ash as an SCM. The specific adjustments between baseline and low-intensity scenarios are shown in Supplementary Table S8. For sample M, with reduced operating intensity and decreased coproduct recovery efficiency, a decarbonized grid requires a reagent intensity of 19.0 gCO2e/kg, still far below current technology feasibility. While the process energy and embodied emissions from reagent use are reduced in this case, sample M has sufficiently low coproduct recovery, and reducing this value by 50% hinders the reality of reaching 1.02 t removals for this sample. Alternatively, sample S under the low-intensity conditions vastly widens the acceptable operating carbon intensities. The shaded section in Figure 5 represents the realistic grid and reagent carbon intensities based on the break-even curve and a decarbonized grid.
Break-even plot comparing samples S and M to determine what system conditions must be met in order to have greater emissions removal/avoidance potential than a counterfactual scenario where fresh fly ash is used as SCM. The filled-in purple triangle represents an achievable range of emissions intensities that result in net-zero or negative emissions. The triangle borders are (vertical) the predicted carbon intensity of a decarbonized US electric grid, (horizontal) the carbon intensity of reagent regeneration using a decarbonized electric grid, and (diagonal) the break-even line for feedstock S using low-intensity operating conditions (low-concentration reagent, high-efficiency electricity), sacrificing some coproduct recovery.

Figure 5. Long description
A line graph with the X axis labeled Grid Carbon Intensity in g C O sub 2 e per k W h, ranging from 0 to 450. The Y axis is labeled Reagent Carbon Intensity in g C O sub 2 e per k g, ranging from 0 to 250.
Four linear data series are plotted:
* S Low intensity: A dashed magenta line starting at Y equals 260 and ending at X equals 320.
* S Baseline: A solid magenta line starting at Y equals 75 and ending at X equals 420.
* M Low intensity: A dashed green line starting at Y equals 60 and ending at X equals 75.
* M Baseline: A solid green line starting at Y equals 25 and ending at X equals 150.
A purple shaded triangular region is located in the upper-left quadrant. Its boundaries are defined by:
* A vertical dashed line at X equals 50, labeled 50 g C O sub 2 e per k W h.
* A horizontal dashed line at Y equals 115, labeled 115 g C O sub 2 e per k g reagent.
* The diagonal dashed magenta line of the S Low intensity series.
This shaded area represents the achievable range for net-zero or negative emissions under specific decarbonized grid and low-intensity operating conditions.
This section presents our third pathway toward removal for the indirect carbonation of coal ash: to achieve net-zero or net-negative emissions via this pathway, the system minimizes reagent use and accepts lower yield and purity of separation coproducts. This pathway sacrifices mineral revenue and can dramatically lower emissions.
Conclusion
The LCA of coal ash as a feedstock for indirect carbon mineralization shows that net removal is possible, given system constraints on reagent and energy CI (the major emissions contributors to the system) and coproduct accounting. We examine four coal ash feedstocks: two waste ashes and two fresh ashes, spanning both high- and low-alkalinity cases. The LCA allows for the tracking of energy and material inputs and outputs, with a cradle-to-gate system boundary. To understand what conditions would be required to achieve removals, we perform analytical break-even modeling varying plant lifetime, energy CI and reagent CI. One limitation of the study is the dependence on a single chemical pathway to resource recovery and mineralization. We base the LCA’s chemical processing component on a single experimental throughput pathway, but teams with different expertise may take advantage of alternative chemical pathways. The process outlined in this work is based on well-established hydrometallurgical processing techniques with the assumption that these methods are scalable with high technological readiness levels (TRL). While not examined in this work, novel separation techniques (e.g., membrane, ligand or biological-based separations) with lower TRL may ultimately produce an LCA with lower total emissions.
In the Break-even scenario, with these assumed perfect alkalinity recovery and carbonation, sample S can store 0.464 tonnes of CO2 per tonne of ash. For a 20-year plant lifetime and a grid CI of 50 gCO2e/kWh, the required reagent regeneration CI is 14.67 gCO2e/kg reagent. Even with a fully decarbonized grid, the process requires a reagent CI an order of magnitude lower than current technologies at 100% reagent replenishment efficiency. Technology for the replenishing of HCl and NaOH must advance considerably for this case to be realistic or be performed on an extremely clean power grid.
When coproduct displacement is included in the life cycle accounting, we expand the carbon carrying capacity, allowing for less strict carbon-efficiency requirements. For the same system mentioned in the previous paragraph (20-year lifetime, 50 gCO2e/kWh grid), but this time with coproduct accounting, the reagent emissions intensity can be as high as 126 gCO2e/kg reagent, approaching the range estimated for electrochemical reagent regeneration using low-carbon electricity. We find critical metals like Ni, Mn and Co to have the greatest CO2 avoidance impact on the system, rather than REE, as some have hypothesized.
Finally, we calculate the system requirements to achieve life cycle emissions that outperform the counterfactual use of coal fly ash as an SCM. When reducing the reagent and energy use, accepting a reduction in coproduct recovery, we find a scenario where the system can outperform the counterfactual scenario. Sample S outperforms the counterfactual with grid and reagent carbon intensities as high as 177.6 gCO2e/kWh and 218.9 gCO2e/kg, respectively.
In summary, the three plausible pathways toward removal examined in this paper are:
-
1. Removals achieved via an extremely clean power-supplying system energy with near perfect reagent regeneration achieved with the same power supply.
-
2. Feedstock-constrained deployment with coproduct displacement via avoided emissions burden powered by a nearly decarbonized grid and little virgin feedstock.
-
3. Reduced chemical intensity, feasible only for certain feedstocks, sacrificing mineral revenue but lowering energy and reagent use and thus emissions.
Open peer review
To view the open peer review materials for this article, please visit https://doi.org/10.1017/cat.2026.10014.
Supplementary material
The supplementary material for this article can be found at http://doi.org/10.1017/cat.2026.10014.
Author contributions
Investigation (lead), Methodology, Writing – original draft: S.S.; Investigation (supporting):E.F.; Project Administration: A.L.; Investigation (supporting): A.U.; Supervision: G.C.; Supervision: J.H.; Conceptualization, Resources, Supervision: J.W.
Competing interests
The authors declare none.
Data availability statement
The authors confirm that the data supporting the findings of this study are available within the article and its supplementary materials.
Funding statement
This work was supported by the National Science Foundation Research Traineeship CLIMATE-CARE Fellowship (grant #2346010) and the Kleinman Center for Energy Policy “Industrial Waste Processing and Critical Minerals Goals in Pennsylvania” Project.


 Open access


Comments
No accompanying comment.