


Background
Understanding the determinants of longevity is central to planning health care and social services (Beard et al., Reference Beard, Officer, de Carvalho, Sadana, Pot and Michel2016; Beard & Bloom, Reference Beard and Bloom2015; Ben-Shlomo, Cooper, & Kuh, Reference Ben-Shlomo, Cooper and Kuh2016). There are studies that follow individuals starting in late life. Generally, these studies show that people with fewer co-morbidities (Ailshire, Beltran-Sanchez, & Crimmins, Reference Ailshire, Beltran-Sanchez and Crimmins2011, Reference Ailshire, Beltran-Sanchez and Crimmins2015; Yates, Djoussé, Kurth, Buring, & Gaziano, Reference Yates, Djoussé, Kurth, Buring and Gaziano2008), higher physical performance (Cooper, Strand, Hardy, Patel, & Kuh, Reference Cooper, Strand, Hardy, Patel and Kuh2014), and less disability (Ailshire et al., Reference Ailshire, Beltran-Sanchez and Crimmins2011, Reference Ailshire, Beltran-Sanchez and Crimmins2015; Klumb & Maier, Reference Klumb and Maier2007) are more likely to survive to be very old. Arbeev et al. (Reference Arbeev, Ukraintseva, Akushevich, Kulminski, Arbeeva and Akushevich2011) also show that those with a higher allostatic load have less ideal health trajectories than those with lower allostatic loads as they age. However, there are very few studies that assess predictors of longevity at different stages of life (Perls, Reference Perls2017). Understanding the relative importance of factors at different stages in the life course would be valuable. Some factors may differentially affect longevity by becoming more important – or less important – at different ages in life (Lynch & Smith, Reference Lynch and Smith2005). The World Health Organisation (WHO) suggests different approaches to health at different periods in the life course (Beard et al., Reference Beard, Officer, de Carvalho, Sadana, Pot and Michel2016). Early in life, interventions to reduce risk factors may be important. In mid-life, managing chronic illness may take on increasing importance. At older age, maintaining functional autonomy may become paramount. Although these considerations have been theorized, there has been limited study across a full adult life course. A rare opportunity to address this gap is possible with the Manitoba Follow-up Study (MFUS), a cohort study which began in 1948. The objective of this analysis was to identify factors at different periods during the life course of men which predict survival to the age of 90. We sought to identify general factors which predict a long life and determine if these general factors change across the life course. We did not intend to isolate the effect of any particular factor.
Methods
Details of the protocol of MFUS have been described elsewhere (Tate, Cuddy, & Mathewson, Reference Tate, Cuddy and Mathewson2015). MFUS is a prospective cohort study of men who qualified for aircrew service in the Royal Canadian Air Force (RCAF) during the Second World War. The cohort of 3,983 men was sealed on July 1, 1948, with an initial goal of determining the prognostic significance of nonspecific abnormalities on the routine electrocardiograms (ECGs) of young men. The cohort members have lived primarily in Canada, but some members have lived outside of Canada. Within Canada, the geographic distribution of MFUS members has been similar to that of the national male population (Statistics Canada, 1992). MFUS receives annual approval from the Bannatyne Campus Research Ethics Board, and adheres to the Declaration of Helsinki (which MFUS antedates).
Participants
Our study window for this analysis goes from July 1, 1948 to December 31, 2018. At entry, the mean age of subjects was 31 years. Only seven men were born after 1928. Therefore, 3,976 men had the potential to reach 90 years of age by the end of our study period. Among these, 3,233 men died before their 90th birthday, 22 men had his last contact with the study at an age younger than 90 years, and 721 men were confirmed to have lived past their 90th birthday. Our main comparisons were between the 721 men (18%) who lived to their 90th birthday and the 3,255 (82%) who did not. The vital status at age 90; that is. dead or alive, of the 22 men who had not had recent contact with MFUS is unknown. These 22 men would be considered “lost-to-follow-up” in some cohort studies, but our protocol has been to continue to attempt to maintain contact with all study members.
Measures
Data from an initial history and physical examination were gathered. Subsequent health data throughout the life course of these men come primarily from regular medical examinations conducted by each participant’s primary care provider. Data from the provider include height, weight, blood pressure (BP), and a resting ECG. In addition, health care contacts such as hospitalizations during the previous year were also received, and were reviewed by study physicians who code diagnoses of acute and chronic illnesses, and their date of onset. Data collection is ongoing, but we consider the end date to be December 31, 2018 for these analyses. For the present analysis, we considered BP and body mass index (BMI) as continuous measures. We considered any major ECG abnormality as a dichotomous variable. Throughout the study, this has been defined as one or more of the following abnormalities detected on a routine ECG: supraventricular tachycardia, atrial fibrillation or flutter, ventricular tachycardia or fibrillation, paced rhythm, ≥10% atrial or ventricular ectopic beats, coupled ventricular beats, second degree atrioventricular block (type I or II), third degree atrioventricular block, ventricular pre-excitation, complete right or left bundle branch block, a QRS complex ≥ 0·12 msec, bifascicular block, sinus arrest, change in size and/or duration of Q wave, voltage criteria for left ventricular hypertrophy, ST segment abnormalities, and inverted or elevated T waves.
We identified date and subject’s age for chronic health conditions from the medical records. We considered individual diagnoses of: diabetes, ischemic heart disease (IHD), chronic obstructive pulmonary disease (COPD), stroke, cancer (all types, except skin cancer), congestive heart failure (CHF), renal disease (including need for dialysis) and peripheral arterial disease (PAD); alcohol misuse; and notation of prescription of antihypertensive medication. We considered a chronic illness as a binary variable present from the time of diagnosis to the time of death. We therefore had a continuous record of the health status of the men throughout the majority of their adult life. At the time of analysis, there have been 180,669 person-years of observation, including 74,104 ECGs, 99,552 BP /weight recordings, and 90,240 clinical entries.
There were also supplementary surveys. A survey on childhood illness was included in 1948, which considered scarlet fever, diphtheria, and rheumatic fever. In 1972, a survey was sent to the men regarding smoking, lifestyle, and occupation. In 1984, a second lifestyle survey was sent inquiring about factors pertaining to cardiac risks, family history, and physical activity. In 1996, we added the Successful Aging Questionnaire (SAQ) to inquire about mental, physical, and social functioning and quality of life (QoL). The SAQ was administered again in 2000, 2002, and annually since 2004 (Swift & Tate, Reference Swift and Tate2013; Tate, Lah, & Cuddy, Reference Tate, Lah and Cuddy2003). The SAQ contains the RAND Medical Outcomes Study (MOS) 36-item Short-Form Health Survey (SF-36) (McHorney, Ware, Lu, & Sherbourne, Reference McHorney, Ware, Lu and Sherbourne1994; McHorney, Ware, & Raczek, Reference McHorney, Ware and Raczek1993; Ware & Sherbourne, Reference Ware and Sherbourne1992). The SF-36 assesses two domains: physical component score (PCS), which considers physical functioning, and the mental component score (MCS), which considers mental health functioning. For regression models, because continuous measures of BP, BMI, MCS, and PCS are on different scales, we present their effects per standard deviation unit to provide an equitable comparison.
Survival past age 90 years was ascertained from several sources. We were notified of death by family members or a physician. We subsequently requested and received a death certificate, proxy report, and medical records. Any contact, including a phone call, a letter, a medical update, or a questionnaire returned from a participant after his 90th birthday, confirmed his living beyond the age of 90 years.
Analysis
We constructed logistic regression models at sequential 12-year time points – 1948, 1960, 1972, 1984, 1996, and 2008 – to correspond with the special additional surveys. BP and BMI were available at all time points. A binary indicator for childhood illness and classification of smoking status as “ever” versus “never” smoked were available at all time points. Chronic diseases were considered to be present if they were diagnosed before the time point of analysis. A question on the special 1984 survey was used to identify self-assessment of sedentary lifestyle, considered as a binary variable. We constructed a full logistic regression model with all variables forced into the model. We then constructed a model by backward stepwise elimination, as well as a forward stepwise model for each time point. These resultant stepwise models were equivalent at all six times with the two modelling approaches. Age was included in all models. The c-statistic for discrimination and the Hosmer–Lemeshow χ2 test for calibration were presented for each logistic regression model. Comparison of how well the full and reduced (stepwise) models fit our data was assessed with the Akaike Information Criteria (AIC). The comparison of the AIC is only appropriate for models based on the same sample of men, not for comparison of models based on men at different points in time.
Results
The status of the participants over the course of the study is shown in Table 1. In 1948, the mean age was 31 years, and by 1984, the mean age of the cohort was 66 years, with four men over 90 years of age. By 1996, about half of the cohort had died, and the mean age of the survivors was 77 years. By 2008, about one quarter of the cohort were still alive, at a mean age of 86 years. Table 2 presents the descriptive data available for the cohort over the years considered for these analyses. There was a high proportion of cohort members who smoked at some time in their life. The prevalence of chronic conditions and incidence of new acute illnesses was low during the early years of the study, consistent with the young age at entry of the cohort. After the age of 55 years (corresponding to the years 1972–1984) the prevalence of cardiovascular diseases increased. Specifically, there was an increase in the prevalence of major electrocardiographic abnormalities, a doubling of the prevalence of IHD, as well as an increase in the proportion of men treated for hypertension. On the 1984 survey, 27 per cent of the cohort reported a sedentary lifestyle. Nonetheless, when the SF-36 was added in 1996, the surviving study members had a fairly high level of health-related QoL, with the mental functioning scores greater than physical scores.
Table 1. Status of participants at various time points over the course of the Manitoba Follow-up Study
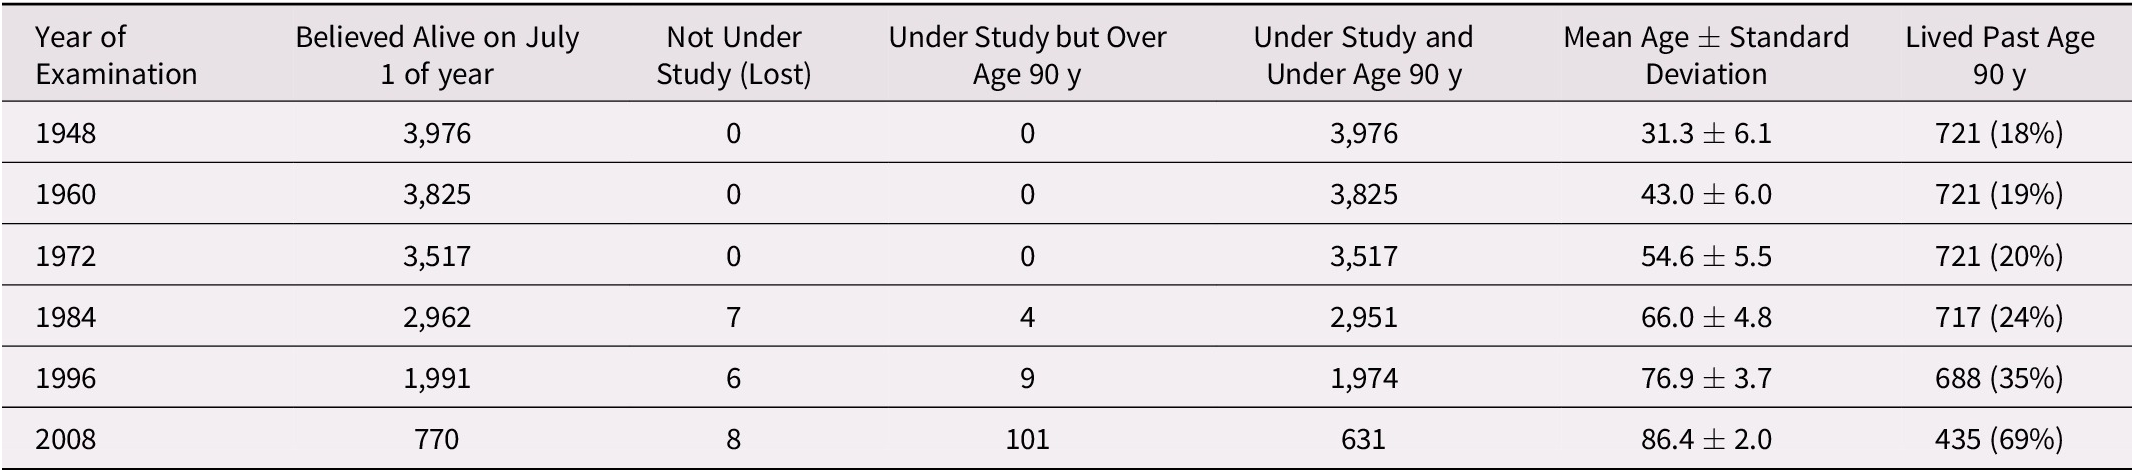
Table 2. Descriptive statistics of men at various time points over the course of the Manitoba Follow-up Study

Note. n/a = data are not available at that time point; SD = standard deviation; SBP = systolic blood pressure; DBP = diastolic blood pressure; BMI = body mass index; ECG = electrocardiogram.
The factors which predicted surviving to the age of 90 across the life course are shown in Tables 3 and 4. Table 3 presents the results of six age-adjusted logistic regression models for each of the time points, with all variables forced into the model. Some factors cannot be included because the prevalence was extremely low, or the factor was not measured at that time point. Note also that several of the factors, such as systolic BP (SBP) and diastolic BP (DBP), are highly co-linear at all time points. The outcome for each model was living beyond the age of 90 years. The odds ratios with 95 per cent confidence intervals in Table 3 show the relative importance of groups of variables in each model. As the cohort ages, there is a general shift in the importance of predictors of surviving to 90. Early in life, medical risk factors (BP and BMI) were important, but declined in effect size and/or became non-significant at later time points. In mid-life, chronic illnesses became more prevalent, and emerged as important predictors. In later life, risk factors and diseases declined in importance, whereas physical and mental health became most important. Also presented are statistics for model fit and discrimination. The statistics for model fit should be interpreted with caution, and not compared across time points, because the sample size differs at each time point, although they can be compared with models from Table 4 at the same time point. The c-statistic for discrimination is similar across all time points, and indicates a fairly good fit at each time point, even early in the life course of the cohort.
Table 3. Relative odds (95% confidence interval) from full multiple logistic regression models of surviving to age 90 based on characteristics of men at various time points over the course of the Manitoba Follow-up Study

Note. Age at each time point was in included in each model to control for potential confounding with other variables.
n/a = data for this factor were not collected at that time point; n/c = not considered in the model as its prevalence was < 1%; SBP = systolic blood pressure; DBP = diastolic blood pressure; BMI = body mass index; ECG = electrocardiogram; COPD = chronic obstructive pulmonary disease; Tx = treatment; CHF = congestive heart failure; PAD = peripheral arterial disease; AIC = Akaike Information Criteria.
Table 4. Relative odds of surviving to age 90 (95% confidence interval) from reduced multiple logistic regression models based on characteristics of men at various time points over the course of the Manitoba Follow-up Study

Note. Considered in stepwise model but not significant at p < 0.05 Age at each time point was in included in each model to control for potential confounding with other variables. n/a = not available; the data for this factor were not available at that point in time; n/c = not considered in stepwise logistic regression model, as there were too few participants with the disease; SBP = systolic blood pressure; DBP = diastolic blood pressure; BMI = body mass index; ECG = electrocardiogram; COPD = chronic obstructive pulmonary disease; Tx = treatment; AIC = Akaike Information Criteria.
Table 4 shows the results of the stepwise logistic regression models for each time point. The statistically significant (p < 0.05) odds ratios and confidence intervals estimated in the reduced models are shown. At early time points, BMI and BP were significantly associated with living to the age of 90 years. The prevalence of chronic diseases at younger ages was low and not valuable in models before 1972. Smoking was an important determinant of living to the age of 90 throughout the first five time points, but its relative odds decreased with advancing age. Chronic disease presence became increasingly prevalent and important in models as the cohort aged. Some chronic illnesses, such as renal disease and CHF, were not identified as important predictors, but these were conditions with a very low prevalence and a very short survival time. Therefore, the effect may not be apparent in logistic regression models. In 2008, there were 631 men alive who were under study and still under 90 years of age. The majority of these – 69 per cent – lived beyond age 90 years. However, only 435 men returned a completed survey to score the SF-36. Among these men, 111 lived to the age of 90 years. In these, only the PCS was significantly related to odds of living to the age of 90 years. Previous smoking, measures of BP and BMI, and indicators of all acute and chronic disease were all non-significant.
Discussion and Conclusions
We have followed a cohort of men over a period of 70 years, from early adulthood to late life, and noted that the predictors of surviving to their 90th birthday shift over the life course. In early life, risk factors appeared important, giving way to chronic illness as the primary risk factor, with a final shift to QoL in later life. Our intention was to determine the general predictors of a long life course using medical and lifestyle information from different stages of a man’s life. Our intention was not to ascertain if specific factors predict long-term survival. Some diseases were not identified as predictors of surviving to the age of 90. However, this may have been because of the low prevalence in the cohort, as well as to a close association with other diseases which share similar risk factors. Also, conditions with a very high case fatality rate may not be apparent in these analyses. Individuals who acquire one of these chronic conditions – such as renal failure or CHF – may have acquired it and died within the 12-year time frames we chose, thus not being considered as a prevalent case. Caution is therefore needed in interpreting the effect of any specific disease or risk factor from these analyses.
Our results are similar to those from some previous studies. Blackwell, Hayward, & Crimmins (Reference Blackwell, Hayward and Crimmins2001) considered the effects of childhood health on late-life health. But they considered surrogates of childhood health measured in mid-life, rather than direct measures of mid-life health. Analyses of the Physicians Health Study showed that not smoking, fewer chronic conditions, better health-related QoL, and being physically active determined who was more likely to survive to the age of 90 (Yates et al., Reference Yates, Djoussé, Kurth, Buring and Gaziano2008). Ailshire et al (Reference Ailshire, Beltran-Sanchez and Crimmins2011, Reference Ailshire, Beltran-Sanchez and Crimmins2015) analyzed data from the Health and Retirement Study. They noted that those with higher physical, cognitive, and mental functioning at age 85 were more likely to survive to extreme old age. Klumb and Maier (Reference Klumb and Maier2007) have found that functional status predicts mortality in late life, and Netuveli, Wiggins, Montgomery, Hildon, & Blane (Reference Netuveli, Wiggins, Montgomery, Hildon and Blane2008) analyses of the British Household Panel Survey report that generic quality of life measures predict mortality, results that were similar to ours. Our findings add new knowledge by considering how these factors operate at young, middle, and older ages within the same cohort.
There are both strengths and limitations to our approach. First, this a study of former air force recruits, most of whom have lived their lives in Canada. Their war and post-war experience may not be generalizable to other cohorts in other places and at other times. Importantly, we cannot generalize these findings to women. These men were also healthy enough to qualify for air crew training (Mathewson, Reference Mathewson1942; Mathewson, Wilson, Cameron, & Crocker, Reference Mathewson, Wilson, Cameron and Crocker1943). This selection effect of no limiting childhood illness may partly explain why childhood illnesses were not determinants of longevity. Related to this, the cohort had a fairly homogeneous birth date, with more than 90 per cent of men being between the ages 20 and 39 years at entry. Their experience may differ from cohorts born later, making it difficult to study age, period, and cohort effects. Second, some measurements in MFUS evolved over time. For example, the SF-36 did not exist before the early 1990s. It is possible that QoL predicts survival to age 90 at earlier ages, not only in later life. However, the prevalence of impaired physical functioning was low when we began collecting the SF-36, and presumably even lower in younger men. We also did not have direct measures of physical performance (e.g., gait speed, grip strength) (Cooper, Kuh, & Hardy, Reference Cooper, Kuh and Hardy2010) or cognition (Todd, Barr, Roberts, & Passmore, Reference Todd, Barr, Roberts and Passmore2013), which predict mortality. Third, some of the measures in the MFUS, such as physical activity, are fairly crude, which may explain the lack of an association with mid-life activity. Also, some of the measures were measured only at one point in time. For example, we can only compare the effect of “ever smoking” at any point, and cannot comment on the effect of smoking cessation on long-term survival. The effect of this bias is likely to result in a weaker observed association between smoking and longevity than actually exists. However, for most measures, we have continuous data throughout the 70-year time frame. Fourth, we did not consider the trajectories of the factors at play. The trajectory of these factors may predict death, independent of the baseline value (Arbeev et al., Reference Arbeev, Ukraintseva, Akushevich, Kulminski, Arbeeva and Akushevich2011.) In the future, we hope to examine the trajectory for each factor individually, as we have done with health-related QoL (St. John, Jiang, & Tate, Reference St. John, Jiang and Tate2018). Related to this is that some of the factors we considered may be in the causal pathway of other factors for which we adjusted. For example, the effect of greater physical activity may have acted through lowering cardiac risk factors. By considering both in the logistic regression models, we may be underestimating their effect on long-term survival. Finally, there are multiple possible ways to analyze these data, including survival analysis. Logistic regression is less influenced by changing associations over time with time-dependent covariates. Because we are postulating that the effect varies over time, logistic regression with the dichotomous outcome of a long life was the method we chose to present. Also, we are not interested in predictors of time to death, but rather with survival to the age of 90. Finally, we are not concerned with censoring, as there are very few individuals with censored time to event. There are also strengths to our approach. We modelled all men who had the potential to reach age 90 years during our window of study, with very few incomplete ascertainments of follow-up status. Hence, censoring to age 90 years was almost negligible. Also, the measures have been validated, and the diagnostic coding has been consistent across all time points.
Our findings broadly support the approach suggested in the recent World Health Organization Report on Aging (Beard et al., Reference Beard, Officer, de Carvalho, Sadana, Pot and Michel2016), which advocates a life course approach to late-life health. This life course approach suggests that with aging, we acquire risk factors, then chronic illness, then disability, and finally death. Consequently, prevention and health promotion may need to mirror these shifts. In younger adults, risk factor prevention may be most relevant. By mid-life, the focus may gradually shift to the management of chronic diseases. In late life, maintaining functional status and supporting those with limited social supports may gradually take priority. Further studies of this approach in other cohorts in other places will be central to studying aging populations, and in setting health care priorities at different points in a life course. Further study is also needed into the effect of each factor over the life course. Our analyses were not intended to study the isolated effect of each factor and how its effect changes over time. Nor are we able to ascertain the effect of the factor’s trajectory over time. These are important questions for future study in this and other cohort studies.
Data sharing
Data are available on reasonable request.
Acknowledgments
We acknowledge the ongoing engagement and participation of the members over the years, as well as previous staff and volunteers of the study. We also acknowledge previous investigators posthumously: Drs. Francis A. L. Mathewson and T. Edward Cuddy.
Funding
These analyses were funded by the Canadian Institutes of Health Research (CIHR) Project Grant Number PJT-152874. The Manitoba Follow-up Study also received bridge funding from the Dean’s Fund (Max Rady College of Medicine, University of Manitoba) and charitable donations from the participants and families of the Manitoba Follow-up Study. These sources of funding had no role in the design and conduct of the study; in the collection, analysis, and interpretation of data; in the preparation of the manuscript; or in the review or approval of the manuscript. Members of the study have provided input into the general study design, but had no role in these analyses or their interpretation. The analyses and conclusions are the authors’, and no endorsement from funding sources is implied.


 Open access