


Older adults rely on motor vehicles as their main form of transportation in Canada, with the majority driving their own vehicles (Turcotte, Reference Turcotte2012). Other forms of transportation (public transit, walking or biking, taxis or accessible transit) are much less likely to be used (Turcotte, Reference Turcotte2012). For the older population, driving represents independence and is important to quality of life (Dickerson et al., Reference Dickerson, Molnar, Eby, Adler, Bedard, Berg-Weger and Trujillo2007).
Although most older drivers are safe drivers, the effects of collisions, whether the driver is at fault or not, can be severe. Older drivers tend to experience greater injuries and fatalities in motor vehicle collisions due to increased fragility with age (Meuleners, Harding, Lee, & Legge, Reference Meuleners, Harding, Lee and Legge2006; Mitchell, Reference Mitchell2013).
Several research studies have investigated ways to enhance the safety of older drivers with respect to (a) the importance of continuing to drive in older adulthood, (b) possible functional and medically related changes with aging in driving performance, as well as (c) the increased risk of injury. This includes studies on screening for medical fitness to drive, interventions to improve their behind-the-wheel skills, as well as research that has examined how older adults drive and which behaviours increase their crash risk. Speeding, as a driving behaviour, has an effect on the propensity for crashing, as well as the severity of crashes (European Conference of Ministers of Transport, 2006). In older drivers, speeding has been identified as a factor leading to more serious injuries with motor vehicle collisions (Boufous, Finch, Hayen, & Williamson, Reference Boufous, Finch, Hayen and Williamson2008).
Within our society, there is a common assumption that older adults drive too slowly (Joanisse, Gagnon, & Voloaca, Reference Joanisse, Gagnon and Voloaca2012). This is supported by self-report studies which have suggested that older drivers are more likely to avoid high-speed conditions (Motak, Gabaude, Bougeant, & Huet, Reference Motak, Gabaude, Bougeant and Huet2014; Siren & Meng, Reference Siren and Meng2013). However, this has not always been evident in studies that have objectively measured speeding behaviours in older drivers. Until relatively recently, few studies had objectively monitored the actual speed or speed modification (acceleration and braking) behaviours of older drivers. Some initial work suggested that older drivers have a longer deceleration time and distance, and drive more slowly than younger drivers (Nakagawa, Kriellaars, Blais, Montufar, & Porter, Reference Nakagawa, Kriellaars, Blais, Montufar and Porter2006; Porter & Whitton, Reference Porter and Whitton2002). However, these early studies also showed that older drivers do exceed the speed limit. Other, more recent but still relatively small, studies have also found that older drivers do, in fact, drive over the speed limit (Choukou et al., Reference Choukou, Bluteau, Germain-Robitaille, Simoneau, Lavallière, Moskowicz and Teasdale2014; Crizzle & Myers, Reference Crizzle and Myers2013; Porter & Ash, Reference Porter and Ash2008; Porter, Reference Porter2013; Vlahodimitrakou et al., Reference Vlahodimitrakou, Charlton, Langford, Koppel, Di Stefano, Macdonald and Marshall2013).
Within the road safety literature, various theories have been posited to explain driver decision making, particularly regarding speed. Fuller (Reference Fuller2005) proposed that drivers try to achieve a balance between task difficulty and capability, such that when task difficulty increases, a driver is more likely to reduce their speed, which is an operational decision. In Fuller’s driving model, other factors were identified that can affect the task demand, including the presence of other road users. Fleiter, Lennon, and Watson (Reference Fleiter, Lennon and Watson2010) have qualitatively explored the impact of other people (not just road users) on speeding, and found that there are a variety of “others” (e.g., passengers, family, peers, etc.) that can affect speeding, in both positive and negative ways. Enforcement as well as various road features (e.g., width, surface, number of lanes, straightness, proximity of trees, etc.) may also influence speeding behaviour (Aarts, Brandenburg, & Van Nes, Reference Aarts, Brandenburg and Van Nes2011).
Another factor that Fuller (Reference Fuller2005) identified that could influence the tendency for speeding is the type of vehicle driven. Elements of importance include performance characteristics, mass, and height. For example, McCartt and Hu (Reference McCartt and Hu2017) found that vehicle power was positively associated with an increase in exceeding the speed limit, when examining roadways in Northern Virginia, US. Padget, Knapp, and Thomas (Reference Padget, Knapp and Thomas2001) also found that sport utility vehicles (SUVs) were driven faster in winter conditions. However, that same study did not find that larger vehicles like SUVs were driven faster in “normal conditions”. In a driving simulator study, younger drivers were found to drive faster when their seat height (distance off the ground) was manipulated to replicate a sport utility vehicle (SUV) height as compared to a sports car height (Rudin-Brown, Reference Rudin-Brown2004). The effect of vehicle seat height on the processing of visual information to determine a “comfortable speed”, although not always perceptible to the drivers, could have serious road safety implications.
The objective of this study, with a large sample of older Canadian drivers, was to determine whether the type of vehicle affects older drivers’ everyday driving behaviour, specifically speeding, accelerating, and braking. In this study, we focused on vehicle size - comparing smaller vehicles (i.e., cars) with larger vehicles that generally have higher seat heights (i.e., trucks, SUVs, vans). The primary hypothesis was that older adults driving larger vehicles would speed more than those driving smaller vehicles.
Methods
Longitudinal Study
Data for this study came from the Candrive cohort study (Marshall et al., Reference Marshall, Man-Son-Hing, Bedard, Charlton, Gagnon, Gelinas and Woolnough2013). Participants underwent annual assessments and had a device installed in their vehicle to monitor their everyday driving patterns. Across seven sites in Canada (Ottawa, Montreal, Toronto, Hamilton, Thunder Bay, Winnipeg, and Victoria) 928 drivers aged 70 years and older were recruited via newspaper article and other media reports, posters, and retiree newsletters, for example. Several inclusion criteria for enrollment in the longitudinal study included (a) driving at least 4 times per week, (b) having a driver’s license for at least 1 year, (c) living within 50 km of the test site, and (d) being in their province of residence for at least 10 months of the year.
All participants’ vehicles were equipped with an OttoView-CD Autonomous Data Logging Device (Persen Technologies Inc., Winnipeg, MB), which captured data at a rate of 1 Hz. The device included a GPS receiver, and an OBDII diagnostics receiver. The GPS receiver captured the position of the vehicle (as longitude/latitude), speed (km/h), and Greenwich Mean Time (GMT). The software that comes with the device also provides geographic information system (GIS) data (e.g., speed limits for the roadways within the cities of the test sites). Participants who were not the sole driver of the vehicle also had a radio frequency antenna and unique identification fob installed to identify their trips. More details on the device and resulting data are available in Porter et al. (Reference Porter, Smith, Cull, Myers, Bedard, Gelinas and Vrkljan2015).
Participants
The data from participants were included in these analyses, provided that each participant had at least 25 days (and 100 km) of usable driving data, between May and September in year 1 of the study. In addition, during those 25 days they could not have changed vehicles. This time frame was chosen to avoid the winter months inasmuch as driving patterns have been shown to change in winter conditions (Padget et al., Reference Padget, Knapp and Thomas2001). For those participants with a full 5 months (May-September) of usable data, we selected a random sample of 25 days of data. Figure 1 shows the participant selection process.
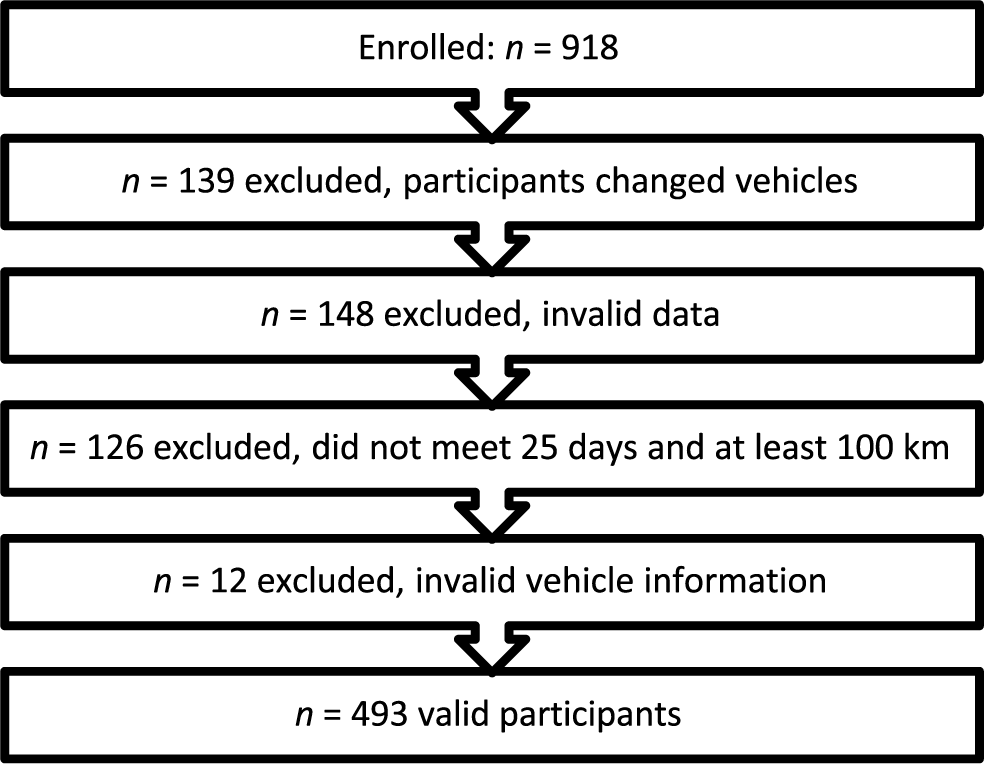
Figure 1: Flowchart illustrating participant selection
Data and Statistical Analyses
Vehicle Classification
The participant vehicle data included the year, make, and general model. Since only the general model was known, the exact performance characteristics of each vehicle could not be determined because these vary by model subtypes. In this study, vehicles were classified using the 2014 Canada Fuel Consumption Guide (Natural Resources Canada, 2014). Because we were primarily interested in larger versus smaller vehicles, we combined all cars into one category, and then combined all other vehicles (trucks, SUVs, and vans) into an “other” category.
Speeding
Speeding was defined as occurring at any point of time the GPS speed was greater than the posted roadway speed limit reported from the Candrive DTS software. Speeding, above each speed limit (10, 20, 30, 40, 50, 60, 70, 80, 90, 100, 110 km/hr) by ≥ 5 km/hr, ≥ 10 km/hr, or ≥ 15 km/hr, was normalized to the total percentage of driving time at each speed limit.
Acceleration and Braking
Acceleration values were calculated according to the GPS 1 Hz speed data using the backward difference method in Eq. (1), where k is the current value and k + 1 is the next time step. We obtained the G force from Eq. (1) by dividing by acceleration due to gravity (9.81m/s2). A value of ≥ 0.27369795918 g or ≤ –0.27369795918 g was considered to be a hard acceleration (or braking) event (Jun, Ogle, & Guensler, Reference Jun, Ogle and Guensler2007).
 $$acceleratio{n_{k + 1}} = {{\left( {spee{d_{k + 1}} - spee{d_k}} \right)} \over {(tim{e_{k + 1}} - tim{e_k})}}$$
In order to analyse the hard braking and accelerating events, we normalised the values to the total distance travelled during the appropriate time period, as well as number of stops for braking events.
Statistical Analyses
We performed multiple linear regression analyses with the proportion of time speeding for each posted speed limit as the dependent variables. Speed limits with insufficient numbers of cases (i.e., 10 km/hr, 20 km/hr, and 110 km/hr) were not analysed. Independent variables were vehicle type, age, and gender. As for acceleration, we tested and corrected normality through power transforms where applicable.
To determine which factors were associated with hard g force events per km and per stop, we performed multiple linear regressions using the independent variables of age, gender, and vehicle type. Normality was tested using the Shapiro-Wilks test, and we used a Yeo Johnson power transform to transform the data, when the data were not normally distributed.
Throughout all these exploratory analyses, p < .05 was deemed significant using R and SigmaPlot (Systat Software, San Jose, CA).
Results
Participants
In total, 493 participants (287 men and 206 women) met the criteria for these analyses. There were 396 driving cars and 97 other vehicles. Participants ranged in age from 70 to 93 years of age, with a median age of 77 years. Table 1 shows the characteristics of the participants by vehicle type. There was a higher percentage of men driving other vehicles. Those driving cars were significantly older than those driving other vehicles. Other significant differences between the two vehicle type drivers were in self-reported number of kilometers driven in a year, as well as types of licenses, both of which could be affected by the age and/or gender of the drivers. There were no differences in numbers of medical conditions, their performance on the Trails B test, or in the per cent of time driving at night.
Table 1: Participant characteristics by vehicle type

Note. aSignificant difference between drivers of cars versus other vehicles.
Speeding
All 493 participants exceeded the posted speed limit by 5 km/hr at some point. The per cent of participants speeding by at least 5 km/hr can be found in Table 2. For all speed limits (except 110 km/hr where only 5 participants had driven on this type of roadway), the vast majority of individuals did speed at some point. For the 50 km/hr zone, 99.8 per cent of individuals sped some of the time.
Table 2: Speeding behaviour by roadway speed limit

Descriptive statistics on the proportion of time spent speeding at each speed zone (using thresholds of 5, 10, or 15 km/hr over the speed limit) are found in Table 3. As indicated by the standard deviations relative to mean values, it can be seen that there is significant variability between participants. For all speed limits, there were individuals who did not speed at any time. At the other end of the range, some drivers were speeding 100 per cent of the time at several speed limits (20, 30, 40, 60, 70, 80 km/hr).
Table 3: Per cent of time exceeding the speed limit; means and standard deviations (SD) are reported for each speed limit

Significant multiple regression models for per cent of time speeding are shown in Tables 4, 5, and 6. Similar results were found for all speeding thresholds (5, 10, and 15 km/hr). In general, vehicle type (car or other, such as SUV or truck) was not a significant factor for explaining the per cent of time speeding. Where it was significant (speed limit of 80 km/hr, threshold of 10 and 15 km/hr) driving a car meant speeding more than the other type of vehicle. Both age and gender were significant in several models. Older age was associated with a lower per cent of time speeding, whereas being male was associated with a greater per cent of time speeding. Overall, the models did not explain much of the variance in per cent of time speeding (adjusted R 2 values ranged from 0.013 to 0.085), with the most predictive model for both speeding thresholds occurring on roadways with speed limits of 100 km/hr. For all of these models, age and gender were significant, but vehicle type was not.
Table 4: Results of the significant multiple regressions models of per cent time speeding for each speed limit with age, gender, and vehicle class (car or other) as predictor variables, with 5 km/hr as the threshold for speeding

*p < .05. ** p < .01. *** p < .001.
Table 5: Results of the significant multiple regressions models of per cent time speeding for each speed limit with age, gender, and vehicle class (car or other) as predictor variables, with 10 km/hr as the threshold for speeding

*p < .05. ** p < .01. *** p < .001.
Table 6: Results of the significant multiple regressions models of per cent time speeding for each speed limit with age, gender, and vehicle class (car or other) as predictor variables, with 15 km/hr as the threshold for speeding

*p < .05. ** p < .01. *** p < .001.
Acceleration and Braking
The results of the multiple regression for hard brakes per km showed that there were significant effects for age (older drivers having more instances, p = .002), gender (women having more hard brake events than men, p = .004), and vehicle class (cars having more than other vehicles, p = .009). The adjusted R 2 was found to be 0.060. The same analysis, with hard brakes per stop as the dependent variable, did not have any significant predictors.
For hard accelerations per km, age (older drivers having more incidents, p = .037) and vehicle class (cars having more than other vehicles, p = .005) were significant predictors with an adjusted R 2 value of 0.027. For hard accelerations per stop, vehicle class (cars having more than other vehicles, p = .004) was a significant predictor, and the model had an adjusted R 2 of 0.035.
Discussion
In this study, involving a large sample of older Canadian drivers, we explored the effects of vehicle type on how older drivers speed and modify their speed, using a device that objectively captured their everyday driving. Although older adults were speeding quite frequently, whether we used a threshold of 5 km/hr, 10 km/hr, or ≥ 15 km/hr, there were very small and limited effects of the size of the vehicle. Overall, the statistical models explained less than 10 per cent of the variance in speeding and speed modification, and in some cases, the effect of vehicle type was the opposite of what we had hypothesized.
Where there were significant effects of vehicle type, age, and gender on the number of hard accelerations and braking episodes, it is unclear how much of this very small effect can be attributed to these particular factors. It is possible that something else about driving cars versus other vehicles, men versus women, or younger versus older drivers also contributed to these findings. For example, it could be that drivers might have chosen to drive a specific type of vehicle due to health status, ease of ingress/egress, or feelings of safety. In addition, those driving other vehicles (SUV or truck) might adopt different driving styles to conserve gas, or they might drive on different types of roadways where fewer hard-braking episodes are required (e.g., no traffic lights). This might be why there were no significant factors explaining hard brakes per stop, but there were for hard brakes per km.
In this study, we were limited to knowing the make and model of the vehicle that participants drove, but we did not know why they chose to drive those types of vehicle. This research on vehicle type was also limited to older drivers, and it is not possible to extrapolate these findings to younger drivers who might have different speeding behaviours. Other limitations of the research, because we did not video-record trips, include not knowing whether the drivers had passengers in the vehicles with them, and we were unable to assess the trips for the traffic density and the effects this might have had on driving patterns. It is also possible that participants in this study and their driving patterns were not representative of all older drivers. It has been found, though, that many of the Candrive sample’s characteristics are very closely aligned with older drivers across Canada in the Canada Community Health Survey (Gagnon et al., Reference Gagnon, Marshall, Kadulina, Stinchcombe, Bédard, Gélinas and Vrkljan2016).
An interesting finding from this large cohort of older drivers is their propensity for speeding. The extent of speeding based on the number of participants who were speeding was generally higher on low-speed roadways. This effect is similar to that found by Feng (Reference Feng2001) who reported low compliance with speed limits on roadways with lower speed limits. However, the per cent of time speeding on lower speed limit roadways was lower than on higher speed roadways. It is likely that the per cent of time is affected by the fact that there is more stop and go driving on low-speed roadways (e.g., stop signs), and so more of the driving time on low-speed roadways is taken up by accelerating up to a stable speed as well as decelerating. On high-speed roadways, drivers are likely driving at stable speeds more of the time.
All 493 participants in this study were found to be speeding at some time during the 25 days, which were considered in these analyses. This supports previous studies that involved smaller sample sizes and/or shorter measurement time frames (Choukou et al., Reference Choukou, Bluteau, Germain-Robitaille, Simoneau, Lavallière, Moskowicz and Teasdale2014; Crizzle & Myers, Reference Crizzle and Myers2013; Nakagawa et al., Reference Nakagawa, Kriellaars, Blais, Montufar and Porter2006; Porter, Reference Porter2013; Porter & Ash, Reference Porter and Ash2008; Porter & Whitton, Reference Porter and Whitton2002; Vlahodimitrakou et al., Reference Vlahodimitrakou, Charlton, Langford, Koppel, Di Stefano, Macdonald and Marshall2013). Given the fact that so many were speeding, it could be difficult to find an effect specific to the type of vehicle. However, there was quite a bit of variability between individuals in the proportion of time that they did speed, and there were other factors, such as age and gender, that seemed to affect speeding more than vehicle type. The small effects of age and gender showed that the oldest drivers and women were less likely to speed. The fact that the type of vehicle driven was not a factor in explaining the per cent of time speeding is supported by previous studies that have used observational approaches to examine vehicle type, without examining the characteristics of the drivers (Hallmark, Knapp, & Grant, Reference Hallmark, Knapp and Grant2004; Padget et al., Reference Padget, Knapp and Thomas2001).
As mentioned earlier, there are many reasons for speeding. Driving in a familiar environment could be a factor (Charlton & Starkey, Reference Charlton and Starkey2013). In a simulator study examining extended practice over 3 months, drivers tended to increase their speed in scenarios that became familiar (Charlton & Starkey, Reference Charlton and Starkey2013). As the current study examined this behaviour in real-world driving, it is reasonable to presume that the majority of their driving trips were on familiar routes. However, we did not examine every trip made for the exact location relative to their typical driving, so we do not know if all driving analysed here was made on familiar routes.
Speeding is also related to the social context. For example, there is a “social contagion” for speeding, meaning that we tend to adjust our speed to the surrounding traffic (Feng, Reference Feng2001). Also, most drivers seem to perceive that other drivers drive faster than they do (Walton & Bathurst, Reference Walton and Bathurst1998). More specifically, other drivers can directly pressure those around them to speed by tailgating or flashing their lights (Feng, Reference Feng2001). Older drivers have reported feeling pressured to go with the flow of the traffic rather than remaining at or below the speed limit, even while having a special device in their vehicle that warned them about their speeding (Porter & Ash, Reference Porter and Ash2008). Homogeneity of speed across all drivers on a specific roadway is important for safety, with large differences between speeds of vehicles creating a safety hazard (Aarts et al., Reference Aarts, Brandenburg and Van Nes2011), so there is logic in their speed choices if almost everyone else is speeding (European Conference of Ministers of Transport, 2006; Feng, Reference Feng2001).
Research has shown that younger drivers speed more than older drivers (Molnar, Eby, Bogard, LeBlanc, & Zakrajsek, Reference Molnar, Eby, Bogard, LeBlanc and Zakrajsek2018; Nakagawa et al., Reference Nakagawa, Kriellaars, Blais, Montufar and Porter2006; Porter & Whitton, Reference Porter and Whitton2002). The problem in older drivers trying to “keep up” with younger drivers is that older drivers might misjudge their ability to drive at faster speeds, thus raising their crash risk. The fact that they are more likely to be seriously injured or killed, if in a collision, makes this type of behaviour potentially even more risky for an older driver. At present, it is unclear what the potential implications are for the safety of these older drivers related to speeding and hard brakes or accelerations. Future analyses with naturalistic datasets will allow for examining the speed and speed modification patterns of older drivers and their risk for collisions.
Conclusions
The results of this study showed that vehicle type seems to have little to no impact on the propensity for older drivers to speed or make hard brakes/accelerations. Speeding (5 km/hr, 10 km/hr, or ≥ 15 km/hr) was prevalent in these older drivers. Future research is needed to determine what effect these common driving behaviours (speeding or speed modification) have on the safety of older drivers.


