


1. Introduction
It is estimated that diarrheal diseases in less developed countries (LDCs) are responsible for roughly 6–7 per cent of mortality (two million deaths annually), which mostly affects young children (WHO, 2004; Prüss-Üstün et al., Reference Prüss-Üstün, Bos, Gore and Bartram2008). This high disease burden persists in spite of the fact that effective and affordable water, sanitation and hygiene interventions are thought to sharply reduce diarrheal diseases (Fewtrell et al., Reference Fewtrell, Kaufmann, Kay, Enanoria, Haller and Colford2005). However, the purported effectiveness of such interventions comes from studies that are generally not blinded, rely on self-reported measures of illness, and typically occur under very controlled, short-term conditions where high utilization rates can be readily achieved (Schmidt and Cairncross, Reference Schmidt and Cairncross2009).
The reality of adoption and long-term use of household water treatment outside such intervention studies is more nuanced. Across many locations in LDCs, various evidence indicates that demand for many point-of-use technologies is low (Whittington et al., Reference Whittington, Jeuland, Barker and Yuen2012). Economists point to measures of demand, both from revealed preference studies (i.e., observations of households’ choices with regard to water treatment), experiments with subsidies or auctions (Ahuja et al., Reference Ahuja, Kremer and Zwane2010; Berry et al., Reference Berry, Fischer and Guiteras2011), and stated preference studies (Van Houtven, Reference Van Houtven2011). Others in the water sector highlight the decay in reported and observed use of such technologies over time, due to lack of replacement of consumables such as chlorine, breakage of filters or other devices, dislike for the technologies or simply reversion to baseline behaviors once intensive promotion has ended (Hunter, Reference Hunter2009; Luoto et al., Reference Luoto, Mahmud, Albert, Luby, Najnin, Unicomb and Levine2012). A third set of studies show that baseline levels of water treatment are often low, and that behavior change interventions (e.g., information or social marketing) may be required to stimulate demand (Somanathan, Reference Somanathan2010; Hamoudi et al., Reference Hamoudi, Jeuland, Lombardo, Patil, Pattanayak and Rai2012). Finally, a number of researchers highlight the importance of user preferences for different attributes of water supply, in particular focusing on aspects related to reliability (Hensher et al., Reference Hensher, Shore and Train2005). Overall, the mixed results on adoption are important because low uptake and compliance with water treatment greatly reduce its potential health benefits (Brown and Clasen, Reference Brown and Clasen2012).
Several of the aforementioned reasons for low adoption suggest the possibility that users consider the inconvenience or taste disamenities of water treatment technologies to be greater than the perceived value of benefits they provide, including those related to health. This paper specifically focuses on the role that distaste may play in affecting demand for water treatment. Taste problems in drinking water can be caused by a variety of compounds, including sediment, decaying organic material or the bacteria that metabolize it, chlorine disinfection byproducts, and salinity, among others (Piriou et al., Reference Piriou, Mackey, Suffet and Bruchet2004; Doria et al., Reference Doria, Pidgeon and Hunter2009). We focused on taste preferences by combining basic survey questions about satisfaction with the taste and smell of existing water sources with a series of activities designed to elicit demand for clean water options that varied in taste. Each of 915 respondents in a representative sample of households from two communes in peri-urban Cambodia answered a series of choice tasks in which they indicated their preferred alternative from among two improved treatment options with varying levels of attributes (including taste and safety), or maintaining their current option. In addition, the paper tests whether respondents actually perceive distaste from water treated with chlorine, since this is commonly believed to suppress demand for chlorination. Besides completing the choice tasks, respondents participated in a double-blinded taste test of three different drinking water options – a bottled water control and two varieties of a chlorine-based water disinfection product, Aquatabs®.
We make several contributions to the literature on preferences for point-of-use water treatment. First, we conduct the first discrete choice experiment (DCE) that allows comparison – for the overall sample as well as specific population subgroups – of the importance of taste acceptability with more commonly considered aspects, notably effectiveness against diarrheal disease, price and convenience. Secondly, we present the first evidence from a blinded taste test in a low-income setting on sensitivity to chlorine, and consider whether these preferences may be related to observable respondent and/or household characteristics. In the next section, we describe the DCE methodology and previous applications in the water domain, and offer general comments on what is known about the demand for drinking water safety and taste acceptability, particularly in LDCs. Section 3 presents details on the study site and sample selection, our econometric strategy and the design of the choice experiment and taste test, and describes our data and analyses. The results and discussion follow in sections 4 and 5.
2. Background: the DCE methodology and demand for water treatment
DCEs, commonly known as stated choice experiments, have long been used to assess consumer preferences for goods and services across multiple dimensions, and are increasingly applied to environmental valuation applications (Louviere et al., Reference Louviere, Hensher and Swait2000). These methods are thought to better mimic individuals’ decision-making processes by structuring tradeoffs in an intuitive way. Specifically, choice experiments allow respondents to consider tradeoffs between different types of attributes of goods and services, in ways that other stated preference methodologies, such as contingent valuation, do not.
Discrete choice methods have been applied in a number of infrastructure service applications, but studies of water services have focused mainly on water supply and reliability (Hensher et al., Reference Hensher, Shore and Train2005; MacDonald et al., Reference MacDonald, Barnes, Bennett, Morrison and Young2005). Yang et al. (Reference Yang, Pattanayak, Carol Mansfield, Johnson, van den Berg, Gunatilake and Wendland2007) conducted a study in Sri Lanka that explored customer demand for several drinking water delivery options (private connections, mini-grids and metered stand posts) that varied in terms of daily volume available, the number of hours of supply, safety and the monthly water bill. They found that households care about service quality as well as price, and that households have diverse preferences for all features except number of hours of supply. One of the few DCE studies revealing a strong preference for water quality was conducted in middle- and upper-income areas of the Eastern Cape of South Africa, where both discoloration and bacterial count were found to be important determinants of choice (Snowball et al., Reference Snowball, Willis and Jeurissen2008). Also, Nam and Son (Reference Nam and Son2005) found that urban households not connected to the piped water network in Ho Chi Minh City place much greater weight on the potential for improved water quality from new piped connections, rather than on water pressure.
Perhaps the most similar previous study to the one considered in this paper pertains to consumer preferences for household water treatment and storage in Andhra Pradesh, India (Poulos et al., Reference Poulos, Yang, Patil, Pattanayak, Wood, Goodyear and Gonzalez2012). The authors found that household utility is most affected by the type of technology (which may reflect a variety of its features), its effectiveness in pathogen removal, the type and convenience of the water retail outlet, and the time required to treat drinking water. Although the aesthetic feature of water clarity was included as one of seven attributes in the choice tasks, the study did not consider tradeoffs between taste and quality. Avoiding this important economic tradeoff may not be possible since safety may be negatively correlated with aesthetic qualities of water, for example taste or turbidity (Hrudey and Hrudey, Reference Hrudey and Hrudey2007; Mann et al., Reference Mann, Tam, Higgins and Rodrigues2007).
Although we are unaware of any previous economic studies that have focused on the role that taste preferences play in determining the demand for drinking water quality improvements, previous research, using both stated and revealed preference methods, has explored other determinants of demand. This research is generally consistent in finding that demand is limited in many LDCs (Whittington et al., Reference Whittington, Jeuland, Barker and Yuen2012), perhaps due to a lack of perceived risk related to water quality problems, low income and various psychosocial attitudes, e.g., high rates of time preference (Pattanayak and Pfaff, Reference Pattanayak and Pfaff2009). This literature, and that for other environmental health interventions such as bed nets, vaccines or clean-burning fuels, also indicates clearly that demand is related to sociodemographic and economic factors such as wealth and education and the presence of young children in the household, as well as lower prices for these potential improvements, higher coping costs and factors related to institutional-level mobilization, e.g., inputs from health workers (Whittington et al., Reference Whittington, Pattanayak, Yang and Bal Kumar2002; Wood et al., Reference Wood, Foster and Kols2012).
In addition to these studies of demand, there is a small literature from the environmental sciences that addresses taste factors in drinking water. Researchers have identified a range of flavors and odors, related to chlorine disinfection byproducts, sediment, decaying organic material or the bacteria that metabolize it (e.g., MIB/geosminFootnote 1 ), and salinity, among others (Piriou et al., Reference Piriou, Mackey, Suffet and Bruchet2004; Doria et al., Reference Doria, Pidgeon and Hunter2009; Srinivasan and Sorial, Reference Srinivasan and Sorial2011). Such studies typically ask consumers to rank water taste on an ordinal scale, although taste acceptability is sometimes categorized in binary terms as ‘acceptable/likeable’ or ‘unacceptable’ (Puget et al., Reference Puget, Beno, Chabanet, Guichard and Thomas-Danguin2010). Interestingly, the acceptability of different flavors appears to vary a great deal across individuals and populations (Tano-Debrah et al., Reference Tano-Debrah, Amamoo-Otchere, Karikari and Diako2007); for example, ‘earthy’ (possibly from geosmin) flavors have been identified as pleasant among rural Cambodians and in South Asia (Jensen et al., Reference Jensen, Ensink, Jayasinghe, Van der Hoek, Cairncross and Dalsgaard2003), particularly those who consume rainwater or use ceramic filters (Brown et al., Reference Brown, Proum and Sobsey2009).
3. Methods
3.1. Household selection and survey design
Site selection for this study was based on the following criteria: (a) sufficient proximity to Phnom Penh to ensure water samples could reach laboratories within one day; (b) at least 400 households in each of the selected study locations to ensure sufficient statistical power for the research we were conducting; (c) sufficiently unreliable quality in piped water to potentially justify new treatment interventions; and (d) moderate to high incidence of diarrhea, as determined through pre-survey focus groups with village leaders and households in the communities. Based on these criteria, two peri-urban sites near Phnom Penh were selected and, following pre-testing with 56 households in a neighboring community, interviews were conducted with 915 households living in 37 villages in these locations.
Phnom Penh's peri-urban zone provides several advantages for a study of this nature. First, water access is rarely a problem for households living in this area: households have access to a variety of water supplies, including rainwater, community piped water networks, surface water and/or household and community wells or boreholes. Yet the water quality associated with such supplies – even piped water systems (for which tests failed to detect a chlorine residual) – is highly varied, and households generally perceive water safety to be an issue of concern (Orgill et al., Reference Orgill, Jeuland, Shaheed and Brown2013; Shaheed et al., Reference Shaheed, Orgill, Ratana, Montgomery, Jeuland and Brown2014). Households in LDCs often desire convenient water supplies, and we wanted to avoid confounding the results concerning the demand for improved water quality with perceptions of how particular interventions might improve access. Secondly, despite its very high cost-effectiveness relative to other treatment methods, it is widely believed that households throughout southeast Asia are resistant to water quality improvements because of taste concerns (Kotlarz et al., Reference Kotlarz, Lantagne, Preston and Jellison2009). Respondents from other surveys conducted in the region report liking the ‘natural’ taste they perceive in rainwater, well water, or in water treated using ceramic filters (Brown et al., Reference Brown, Proum and Sobsey2009). We therefore felt that a baseline study on taste preferences and on the taste acceptability of water treatment was necessary ahead of any intervention to improve the safety of drinking water in these communities.
The survey instrument included questions on: household demographics; diarrhea prevalence; water sourcing during different seasons; water storage, handling and treatment practices; opinions regarding the state of their drinking water supplies; and preferences for improved water quality. The preference exercises included: (i) the DCE in which respondents were asked to make general tradeoffs between four water treatment features – price, taste, effectiveness at reducing diarrheal disease and convenience; and (ii) a taste test of chlorinated and non-chlorinated water to assess the taste acceptability of such alternatives. All households giving consent to be enrolled in the study participated in these same preference elicitation tasks, although their order was varied. In particular, we were concerned that the experience of the taste test would influence responses to the choice tasks, so most respondents were assigned to complete the choice tasks first (n=739). A random half of those in the second community (n=173) completed the taste exercise first, however; we exploit this design to test for order or anchoring effects (Lucas et al., Reference Lucas, Jeuland and Deen2007). In addition, water samples were taken from storage containers and from taps in households connected to an active piped water network. These samples were tested for chemical and microbial quality, analyses which confirmed that water contamination is a widespread problem in the survey communities (Shaheed et al., Reference Shaheed, Orgill, Ratana, Montgomery, Jeuland and Brown2014).
3.2. Choice experiment and taste test
In the DCE, respondents were asked to compare generic (unlabeled) water treatment options that varied according to the levels of four attributes: (a) cost (100, 300 and 500 Riel; US$1 = 4,100 riel); (b) taste (good vs. poor taste)Footnote 2 ; (c) effectiveness at reducing the risk of diarrheal disease (40 per cent or 80 per cent); and (d) volume of water treated (10 or 20 L). These levels were described as relative to the status quo water supply used by respondents.Footnote 3
This set of attributes and levels was specified on the basis of experiences in four focus groups conducted in two communities similar to those included in the study, and adjustments to attribute levels (particularly cost) were made following the focus groups and survey pre-test in order to best induce a range of demand responses. The focus groups were especially useful for refining the description of two of the attributes in the DCE – taste and effectiveness. To help respondents understand the effectiveness attribute, enumerators showed them visual diagrams that were thoroughly pre-tested during focus groups. With the help of these visuals, enumerators explained the concept of diarrheal disease risk reduction (see the online Appendix, available at http://journals.cambridge.org/EDE, for the complete script used in the DCE). The focus groups also helped to confirm findings from prior literature (discussed above) documenting the subjectivity and variability in perceptions of taste acceptability, and provided some motivation for specifying the relative taste acceptability of different options in the DCE in binary terms.
Each household then completed six choice tasks in which they selected one of two treatment alternatives or neither (the status quo). Thirty-six cards with different combinations of the new treatment alternatives (figure A1 in the online Appendix provides an example) were randomized across households; attribute levels were obtained using SAS software on the basis of efficiency for measuring the main effects of the included attributes on utility (Kuhfield, Reference Kuhfield2010).
The possibility of opting out of a treatment option complicates our design, given that the characteristics influencing the choice to opt out varies across individuals depending on baseline household water-related behaviors. For example, some households in the study communities did nothing to treat their water and stored water in house for long periods of time, while some drank water straight from sources without storage, and others treated their drinking water on a daily basis (mostly by boiling, which is far less cost-effective than chemical treatment). As a result, respondents were asked to assume that the attributes of the hypothetical alternatives in each choice set were measured relative to their existing drinking water option (the finished water produced by their particular storage, handling and treatment practices), using a pivoting design (Train and Wilson, Reference Train and Wilson2008). We then characterized the levels of the reference water according to revealed baseline indicators: (a) price of daily water treatment; (b) taste defined as poor if the household said it was dissatisfied with the taste/smell of its water, and good otherwise; (c) relative effectiveness of zero given the low water quality measured in the survey communities – see Shaheed et al., Reference Shaheed, Orgill, Ratana, Montgomery, Jeuland and Brown2014 Footnote 4 ; and (d) a quantity of 100 L, essentially an unconstrained amount of drinking water since no participating households had limited water supply. Adjusted levels of the attributes, relative to the levels of the individual-specific opt-out alternative, were then used in the mixed logit estimation. (Tests of the sensitivity of results to exclusion of the characteristics of respondents’ reference water source are available from the authors upon request.) To the extent that new treatment is a substitute for baseline behaviors, this approach may somewhat overestimate the relative effectiveness of the new alternatives compared to opting out. Experimental evidence from these same households, however, finds little evidence for such behavioral adjustments following purchase of chemical treatment products (Brown et al., Reference Brown, Hamoudi, Jeuland and Turrini2015).Footnote 5
The second preference task tested perceptions of taste acceptability of chlorinated water samples. The task consisted of a double-blinded taste test of a non-chlorinated (UV and ozone-treated) bottled water control and two chlorine-based disinfection products: Aquatabs® and an experimental ‘taste-masked’ version of Aquatabs® (both of which are produced by Medentech; see http://www.medentech.com/).Footnote 6 The active ingredient in Aquatabs® is sodium dichloroisocyanurate (NaDCC), which produces a free-chlorine residual in treated water. In addition to randomizing the order of the three products each day, the concentration of disinfectant was varied through dilution (to yield 0.25, 0.5, 1.25, 2.5 and 5 mg/L of free chlorine; the World Health Organization recommended range for effective treatment is 0.2–5.0 mg/L of free chlorine (WHO, 2011), while a level of 2.0 mg/L is often recommended by studies of effectiveness (Clasen et al., Reference Clasen, Saeed, Boisson, Edmondson and Shipin2007). Respondents were asked to select their favorite and least favorite sample, and to indicate what they liked or did not like about those samples. To further assess satisfaction with the taste and smell of this favorite sample, enumerators asked respondents to compare the taste of that favored sample to that of their current drinking water.Footnote 7
3.3. Model for analysis of responses in the DCE
The analytical model we implement for analysis of responses to discrete choice tasks is based in random utility theory. The random utility model (RUM) assumes that the utility associated with a particular choice alternative can be written as a function of the attributes of the alternative. The individual's indirect utility is expressed as a function of the attributes of water treatment (price, taste, effectiveness against diarrhea and quantity of water treated) and household characteristics:
 $$U_{jt}^{i}=V^{i}\lpar p_{jt},\beta_{0}^{i},\, X_{jt},\beta^{i},Z^{i}\rpar +\varepsilon_{jt}^{i},$$
where:
- $U_{jt}^{i} =\ $
the utility of household i associated with water treatment alternative j in a given choice set, where t indexes the number of choice tasks;
$U_{jt}^{i} =\ $
the utility of household i associated with water treatment alternative j in a given choice set, where t indexes the number of choice tasks; -
$V^{i}(\cdot)=\ $
the non-stochastic portion of the utility function for household i;
-
p jt = the price of water treatment alternative j in task t;
-
$\beta_{0}^{i} =\ $
a parameter which represents the marginal utility of money for household i;
-
X jt = a vector of non-price attribute levels for water treatment alternative j in task t;
-
β i = a vector of parameters which represent the marginal utility for household i associated with the non-price attributes of the alternatives;
-
Z i = a vector of characteristics for household i; and
-
$\varepsilon_{jt}^{i} =\ $
a stochastic disturbance term.


Assuming that households maximize utility within a given choice task, they will select alternative j from among the set of K alternatives presented to them if and only if alternative j provides a higher overall level of utility than all the other alternatives, i.e., if U
jt
i
>U
kt
i
for all j in set K, where j≠k, such that V
jt
i
−V
kt
i
>ε
kt
i
−ε
jt
i
. Assuming a linear specification of utility $U_{jt}^{i}= \beta^{i} X_{jt}+\beta_{0}^{i}p_{jt}+\gamma_{1}^{i}Z^{i}+\varepsilon_{jt}^{i}$
and a type-1 extreme-value error distribution for the disturbance term, the probability that alternative j will be selected from choice set t corresponds to the standard conditional logit:
$U_{jt}^{i}= \beta^{i} X_{jt}+\beta_{0}^{i}p_{jt}+\gamma_{1}^{i}Z^{i}+\varepsilon_{jt}^{i}$
and a type-1 extreme-value error distribution for the disturbance term, the probability that alternative j will be selected from choice set t corresponds to the standard conditional logit:
 $$\hbox{Prob}[C_{t}^{i}=j] = {\hbox{exp}(\beta^{i}X_{jt}+\beta_{0}^{i}p_{jt}) \over \sum_{\rm k=0}^{\rm K} \exp (\beta^{i} X_{kt} + \beta_0^i p_{kt})},$$
where C t i is the selected alternative in each of the choice sets t (McFadden, Reference McFadden, Manski and McFadden1981). The conditional logit model is estimated using maximum likelihood; the coefficient values β0 i and β i are selected to maximize the likelihood that one would observe the choices actually observed in a given sample of respondents. The estimated coefficients thus reveal the relationship between the probability of selecting an alternative and the specific levels of its attributes.
The limitations of the conditional logit model are well known (Revelt and Train, Reference Revelt and Train1998).Footnote 8 Many of these limitations can be overcome using the mixed logit approach. Perhaps the greatest advantage of mixed logit is to allow for unobserved heterogeneity in preferences across individuals, by specifying individual-specific stochastic components for each of the estimated coefficients β in the model. In the mixed logit model, the probability that alternative j will be selected from choice set t can be written as:
 $$\hbox{Prob}[C^{i}=(C_{j1}^{i},\ldots, C_{jT}^{i})] = \int {\exp (\beta^{i\ast} X_{jt} + \beta_{0}^{i\ast} p_{jt}) \over \sum_{{\rm k}=0}^{\rm K} \exp (\beta^{i\ast} X_{kt} + \beta_{0}^{i\ast} p_{kt})} f(\eta \vert \Omega)d\eta,$$
where β*=(β+η
i
) and f(η|Ω) denotes the density of the individual disturbance terms η
i
given the fixed parameters Ω of the distribution. The stochastic portion of utility then flexibly accommodates correlations both across alternatives and choice tasks. Unlike conditional logit, there is no simple expression for the likelihood function for equation (3), so estimation of mixed logit relies on simulated maximum likelihood. Assuming a linear specification of utility and normally distributed random parameters, the marginal utility to individual i, expressed in money terms, of a one-unit increase in attribute k is given by the ratio $-\lpar \beta_{k}+\eta_{k}^{i} \rpar /\lpar \beta_{0}+\eta_{0}^{i}\rpar $
.
$-\lpar \beta_{k}+\eta_{k}^{i} \rpar /\lpar \beta_{0}+\eta_{0}^{i}\rpar $
.
In this paper, we estimate and present the results of the mixed logit estimation for model specifications that assume that these random preference parameters are normally distributed, except in the case of price, for which we impose a fixed coefficient, i.e., η0 i =0 (results assuming a normal or lognormal specification for the price coefficient are available upon request). We fix the price coefficient in order to avoid unrealistic (very large) or undefined values of willingness-to-pay (WTP) for the various attributes (Revelt and Train, Reference Revelt and Train1998).
3.4. Analyses
In the results section of this paper, we first present results from the DCE. The majority of our analyses focus on the most conservative measures of the demand for treatment alternatives in order to reduce the risk of hypothetical bias. We use answers to two debriefing questions following each choice card to obtain more and less conservative estimates (Lucas et al., Reference Lucas, Jeuland and Deen2007). For the less conservative responses, we include all choices initially selected by households. The most conservative measure considers only choices identified as ‘very certain’, using a four-point certainty scale (very certain, somewhat certain, somewhat uncertain, very uncertain), and excludes the 10 per cent of respondents who did not understand the choice exercise after completing the first choice set. Although the responses to such debriefing questions may be endogenous, we do not consider this to be a more serious threat than that posed by hypothetical bias, particularly given concerns over the general endogeneity problems that arise from the repeated choice tasks required by the DCE methodology. As an added justification for our reliance on the more certain responses, we find that the implied WTP for water treatment using these responses is also more consistent with CVM responses from the same households, in which a modified ‘cheap talk’ script and reminder of the budget constraint were utilized to achieve the same purpose (Cummings and Taylor, Reference Cummings and Taylor1999).
We also consider several additional questions related to the demand for water treatment among specific sample subgroups. Building on the literature for demand for water quality improvements, we hypothesize that demand for treatment alternatives might be related to a set of household characteristics. Thus, we consider separately the preferences of those falling into different socio-economic (e.g., poor and non-poor, literate and illiterate) or demographic (e.g., younger and older respondents groups, larger or smaller households or households with more young children) as well as those using different primary drinking water sources (piped, rainwater, vendor water, surface water or groundwater), engaging in different water treatment practices, or expressing different levels of satisfaction with their existing drinking water. All subgroup analyses were considered by interacting attribute levels with dummy variable indicators for households within the subgroups of interest. Finally, we test for anchoring effects, by assessing whether responses in the DCE section were systematically different among those who completed the choice tasks before the taste tests.
Following analysis of responses in the DCE, we present the full sample outcomes from the taste tests. Using multinomial logit regression, we test whether these taste preferences are related to observable household characteristics. One might think, for example, that those drinking rainwater might be less accepting of the taste/smell associated with chlorinated water, relative to those relying on piped water, which is sometimes treated with chemical disinfectants.
4. Results
4.1. Descriptive statistics
The average household size was 5.3, including 1.9 children (table 1). The average respondent was 42 years old. Adults in survey households had an average of 5.7 years of schooling, and 68 per cent were married at the time of the interviews. Eighty-two per cent of households relied on rainwater as a primary drinking water source, but households used a variety of other sources as ‘primary’ drinking water sources in one or both seasons, including vendors or bottled water (27 per cent), surface water (21 per cent), piped water (20 per cent) and wells (6 per cent). Seventy-seven per cent of households used different primary sources during the dry and rainy seasons. Most households (76 per cent) were satisfied with the taste and smell of their water, and those using rainwater as a primary source were most satisfied. Respondents did not consider their water sources to be very safe (averaging 3.7 on a 10-point scale with increasing quality). These results suggest that water quality was perceived to be a problem in the study communities.
Table 1. Descriptive statistics

Notes: a Because primary sources are for either season, these do not sum to 1.
b Ordinal scale: 1, <1 day; 2, ~ 1 day; 3, 1–3 days; 4, 4–7 days; 5, >7 days; 6 = Not applicable.
c Ordinal scale: 1, daily; 2, 3–4×/week; 3, 1×/week; 4, rarely or never.
A majority of households (77 per cent) reported treating their water at least daily, mostly by boiling (70 per cent), and very few claimed to use chemical-based disinfection. A minority of households treating their water reported mixing treated and untreated water (8 per cent), but 56 per cent of households admitted that household members sometimes or always drink untreated water from storage containers. On average, households stored water for slightly more than one day, and reported washing their storage containers slightly more than once per week (32 per cent use soap). After storage, handling and treatment, households reported that they believed their water to be safe (9.1 on average on a 10-point scale). Eighty per cent of households had soap on hand at the time of the interviews; 43 per cent admitted to practicing open defecation, and fewer than 20 per cent reported washing hands after defecation. Only 47 per cent could identify the key symptoms and causes of diarrhea. Cross-sectional prevalence of diarrheal disease based on seven-day recall was 5 per cent (8 per cent among children under the age of five). Sixteen per cent of households reported at least one diarrheal disease episode across all household members in the 24 hours prior to the survey.
4.2. Choice experiment results
The main results of the DCE data analyses, for different mixed logit model specifications with fixed price coefficients, are shown in table 2. Columns A–C, which include varying interactions with household expenditure status (from none in column A to full interactions in C), present results based on all choices made by study respondents; columns D–F show the results for the more conservative responses. The results reveal considerable heterogeneity in preferences (standard deviations for most of the random coefficients are significant). As expected, the relative size of the coefficients on price compared to those on the other attributes in columns D–F, and thus the implied WTP for these attributes, suggest a much greater price response among respondents than those in A–C, by a factor of about three. The bootstrapped estimates of average WTP (which show the mean and 95 per cent confidence intervals for WTP) for the different attributes suggest that the change from poor to good taste is similar in weight to a 30 per cent effectiveness of the water treatment method; these are both greater than the value placed on an additional 20 L of treated water.Footnote 9 Also, the large and negative coefficients on the alternative-specific constant (ASC) for the ‘new’ treatment type presented in the DCE in models D–F point to a predilection to choose known options over the perhaps uncertain newer treatment combinations. This preference for opting out implies that the welfare changes from new water treatment options would be overstated by simple summation of attribute-specific WTP.
Table 2. Mixed logit results from DCE data, attribute levels specified relative to reference alternative
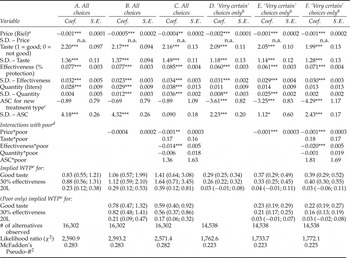
Notes: ***Significant at 1% level; **significant at 5% level; *significant at 10% level. Relative attribute levels specified as indicated in ‘Choice experiment and taste test’ subsection of Methods.
a Price coefficients assumed to be fixed (results for lognormal price coefficients are available from the authors upon request).
b Model excludes respondents who did not understand the DCE exercise after completing the first choice set.
c New treatment = 1 for the treatment alternatives and 0 for the status quo.
d ‘Poor’ classification is assigned to those with expenditures below the sample median.
e In 2011 US$; obtained from bootstrapping the ratios of relevant coefficients and interactions over 200 repetitions; reported values are means and 95% confidence intervals.
Columns B and E present the model specifications that differentiate the price responses of households above and below the median of expenditures; columns C and F include interactions between expenditure status and all attribute levels and the ASC. Poorer household respondents are more sensitive to price, as shown by the negative interaction term with price, and these coefficients are significant in all but model B. Columns C and F also show that below-median income households are less responsive to effectiveness and quantity (coefficients are negative and, for effectiveness, statistically significant), and place slightly more importance on taste (coefficients are positive but not statistically significant); the ASC is not significantly different for these households. The partwise WTP estimates for the different attributes among such respondents are therefore 35–65 per cent lower, depending on the specification. This sensitivity among poor households appears greater in the specifications that use the conservative demand estimates (columns E and F, rather than B and C), and in the ones that allow for differential responses to attributes other than price (columns C and F, rather than B and E).
Qualitative de-briefing questions offer confirmatory insights into the choices made by respondents. Following each choice task, respondents were asked about the importance of different features of the water treatment options. They generally identified taste acceptability as the most important attribute in their decision about which alternative to select, followed by effectiveness of treatment, price and finally the quantity of water.
We also evaluated the differences in choices made by a large set of sample subgroups (e.g., those drinking from different water sources, those who completed the choice tasks before the taste tests, those in different socio-economic groups) using the more conservative responses in the DCE. Several household demographic variables are related to demand: in particular, older respondents and respondents from larger households are more price sensitive. Illiterate respondents place less weight on treatment effectiveness, perhaps because the meaning of this attribute was harder to understand (table 3). Respondents in households with children appear more sensitive to taste, but surprisingly do not respond differentially to treatment effectiveness. Consistent with the trends observed for the poorest half of the sample, respondents in the lowest income quartile were more sensitive to price (p<0.001), and therefore had lower WTP for each of the attributes than the average respondent, and especially effectiveness (p=0.001) (figure 1 and table 3).

Figure. 1. WTP for a specified change in attributes among different subgroups. Notes: Change in taste is from unfavorable to favorable; effectiveness is for 30% additional protection from diarrhea; quantity of water treated is 20 L. The ASC remains negative and large for all subgroups; thus the total welfare change of adopting a new treatment alternative with the characteristics that are shown is not the sum of these amounts.
Table 3. Mixed logit results for subgroups a
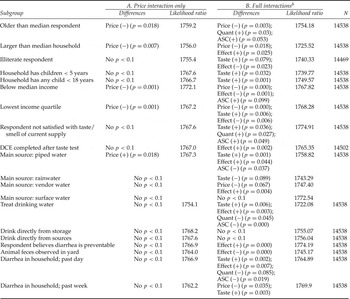
Notes: a Relative attribute levels specified as indicated in ‘Choice experiment and taste test’ subsection of Methods. The ASC is for the generic treatment alternatives. Price coefficients assumed to be fixed (results for lognormal price coefficients are available from the authors upon request). Only differences with p<0.1 are reported. Model excludes respondents who did not understand the DCE exercise after completing the first choice set.
b Full interactions model includes interactions between an indicator variable for the group and the price, taste, effectiveness and quantity attributes, and the ASC.
The average respondent in households not currently satisfied with the taste or smell of their water was willing to pay significantly more for favorable taste; this is also consistent with other findings from this location (Orgill et al., Reference Orgill, Jeuland, Shaheed and Brown2013). Households treating their water using some method have higher demand for both favorable taste and additional safety than households not treating their water, but also have a much greater preference for sticking with their status quo option (p<0.001); this is consistent with the idea that many such households might have perceived this opt-out drinking water to provide suitable protection against risk. There is little evidence that respondents completing the DCE exercise after the taste tests were more sensitive to the taste attribute than those who did taste tests later; the interaction of the taste attribute and a dummy for completion of the DCEanalysis first was positive but not significant. As shown in figure 1 and table 3, respondents in households relying on piped water were much less price responsive (p=0.018) and heavily weight taste acceptability; these respondents and those in households purchasing water from vendors also more strongly value improvements in effectiveness. In addition, respondents in households observed to have less clean living quarters (as indicated by the presence of animal feces in the yard) placed less emphasis on increased effectiveness, while those who believed that diarrhea could be prevented had the opposite preference. We do not find large differences in price sensitivity for respondents in households with a recent case of diarrhea, although such respondents were more interested in taste and effectiveness improvements.
4.3. Willingness-to-pay for treated water
Interpretation of the WTP for changes in attributes shown in figure 1 is complicated by the fact that the total demand for new water treatment must also incorporate the average preference for the existing water option used by households (as shown by the negative ASC in the rightmost columns of table 2). We therefore scaled the implied WTP values for the water treatment attributes (shown in Column D of table 2) according to the quantity of drinking water that would be required by a typical household in these communities and the 30 per cent effectiveness of chlorination that is commonly reported in the literature (Orgill et al., Reference Orgill, Jeuland, Shaheed and Brown2013), adjusting for the preference for opting out. This procedure yields an average WTP of US$1.2/month for treated water with favorable taste (95 per cent confidence interval: −US$2.98–4.97). Although the confidence intervals are overlapping, this is somewhat lower than the central estimate of US$2.8/month from a CVM study of demand for water quality improvements obtained from the same households, which however pertained to water that was ‘perfectly safe to drink’ (Orgill et al., Reference Orgill, Jeuland, Shaheed and Brown2013). For the various subgroups shown in figure 1, the range of average implied WTP is US$0.05–2.90 per month (or roughly 0.02–1.4 per cent of mean monthly household income). Respondents using piped water as a primary source, for example, are willing to pay about US$1.3/month on average, and those with rainwater as a primary source are willing to pay about US$1.9/month. The difference in WTP in these groups, while not statistically significant, is largely driven by a larger negative ASC among piped water users relative to rainwater users; those using other primary sources have lower demand. Crucially, the implied WTP is below zero in nearly all subgroups for treated water alternatives with poor taste.
4.4. Results from the taste tests
The previous section dealt with the issue of subjective preferences for taste and other attributes. We next assess whether respondents were objectively sensitive to the taste of a very specific taste in drinking water – that resulting from chlorination. Over the full set of concentrations of treated water, nearly half of respondents (48 per cent) identified the bottled water sample to be their preferred sample in the double-blinded taste test, with roughly equal percentages preferring Aquatabs® (28 per cent) and the experimental taste-masked Aquatabs® (24 per cent). Conversely, the taste-masked samples were most commonly identified as the least favored sample (43 per cent), followed by standard Aquatabs® (38 per cent) and finally bottled water (18 per cent).Footnote 10
When asked (in open response questions) what they like about their favorite samples, nearly all respondents mentioned taste (40 per cent), odor (26 per cent) or both taste and odor (28 per cent), rather than features such as consistency and appearance (6 per cent). Similarly, for their least favored samples, respondents said that they disliked taste (25 per cent), odor (61 per cent) or both taste and odor (8 per cent) more often than all other features (6 per cent). Across the full sample, slightly more than half of respondents preferred their favorite samples to their current water source, and only 3–4 per cent said they were not sure or that their favored samples were worse. In contrast, only about 18 per cent of respondents preferred their least favorite sample from the taste test to their current source, while 60 per cent said it was worse. These results suggest that nearly all respondents’ favorite samples were at least as good as their current water and that respondents’ least favorite samples were mostly worse than their current water, mostly because of taste and/or odor aspects.
Furthermore, at low concentrations (e.g., below 1.25 mg/L chlorine) there is little sign that respondents preferred specific samples (figure 2). The joint hypothesis of equality of percentages favoring each of the different samples is rejected at the 5 per cent level for 0.25 mg/L (p=0.061) and 0.5 mg/L (p=0.01), but t-tests only indicate significant preferences for bottled water over both types of Aquatabs at 0.5 mg/L. At 1.25 mg/L, the preference for bottled water was significantly higher than taste-masked Aquatabs (and not regular Aquatabs), and it was significantly higher than both at 2.5 and 5 mg/L (p<0.001).

Figure. 2. Preferences for safe water by concentration of chlorine product.
We find little evidence that observable characteristics of households are correlated with taste preferences, controlling for sample concentration (table 4). All else being equal, those consuming rainwater were slightly less likely to favor taste-masked Aquatabs®. In focus groups, respondents remarked on the bad smell of taste-masked Aquatabs®, which may play a role in the preferences of those consuming rainwater. However, the relationships between taste preferences on the one hand, and water sourcing and demographic characteristics on the other, are weak, and the explanatory power of the model is very low. Male and literate respondents are less likely to favor the taste-masked Aquatabs®, and respondents from larger households are slightly less likely to favor Aquatabs®.
Table 4. Multinomial logit model for preferred water sample

Notes: ***Significant at 1% level; **significant at 5% level; *significant at 10% level.
The reference category is bottled water preference.
Omitted primary water source is vended/bottled water; perceptions of water safety measured on a 10-point integer scale (0 = totally unsafe to drink; 10 = totally safe to drink).
5. Discussion
This paper reports on a study of how taste features influence the demand for drinking water alternatives in two peri-urban communes near Phnom Penh, Cambodia. We used a DCE to understand the tradeoffs that individuals are willing to make between the taste and other attributes of a generic water treatment technology. In addition, in order to test whether respondents were actually sensitive to the taste associated with use of one specific water treatment technology, we had respondents participate in double-blinded taste tests of chlorinated and non-chlorinated (control) bottled water samples. We chose to explore taste preferences for chlorinated drinking water in particular detail because this treatment technology is cheap, effective and commonly used, but is said to also cause taste and odor problems.
Respondent choices in the DCE showed that individuals heavily weight the taste acceptability of water treatment when choosing among options that vary in terms of price, taste, effectiveness against diarrheal disease and quantity of water treated. This result is consistent with literature that hypothesizes the importance of attributes that are direct experiences, such as flavor, rather than those that must be inferred, such as health risk reduction (Doria et al., Reference Doria, Pidgeon and Hunter2009). There is considerable heterogeneity in the response, but respondents in all of the subgroups we considered ranked taste acceptability as more important than a 30 per cent reduction in diarrheal disease risk, which is close to the level of protection cited in the literature for many point-of-use water treatment technologies (Clasen et al., Reference Clasen, Bartram, Colford, Luby, Quick and Sobsey2009). Exploring the variation across sample subgroups, we found that respondents in low-income households are more responsive to the price attribute than others. The WTP for respondents from households in the lowest income quartile was about 65 per cent of the WTP of the average across all respondents, and only 53 per cent of that among those living in households above the median of income. Respondents from lower income households also placed greater weight on the taste acceptability of water treatment (and lower weight on its effectiveness against disease). Other respondents who more heavily weighted taste acceptability were those who reported not being satisfied with the taste of their current supply, those already treating their drinking water and those who reported at least one case of household diarrheal disease during the week leading up to the survey. Meanwhile, some respondents placed greater weight on the treatment effectiveness attribute (e.g., those in larger households, in households already using water treatment, in households with a recent case of diarrhea and those believing that diarrhea is preventable), while respondents in households with poor hygiene weighted this attribute less. Finally, we found some differences in the demand for the different attributes of water treatment across households using different primary drinking water sources.
As noted in the literature, poor taste in drinking water is highly subjective and can stem from a range of factors, some of which are natural source characteristics. Other causes may be due to water treatment methods such as chlorination. Data from the taste tests revealed that the majority of respondents (50–60 per cent) express a preference for unchlorinated water once the dosage surpasses 1.25 mg/L of free chlorine, which is below commonly suggested levels for field use of 2.0 mg/L. Here it is important to highlight that our design does not allow us to determine whether the less favored chlorine samples had a taste that would be considered ‘acceptable’ as described in the DCE. As such, our study cannot isolate the specific effect that distaste from chlorination would have on the WTP for water treatment using this method. Even so, a majority of respondents (over 60 per cent) did assert that they preferred their current source to their least favorite samples in the taste test, largely due to the poor taste and odor of the latter. We can thus infer that taste disamenities may play a role in discouraging household use of this technology at recommended levels (Arnold and Colford Jr., Reference Arnold and Colford2007; Luoto et al., Reference Luoto, Mahmud, Albert, Luby, Najnin, Unicomb and Levine2012).
We also found few predictors of the preferences expressed in the taste tests, which suggests that targeting point-of-use chlorination technologies to those most likely to find their taste to be acceptable would be difficult. Thus, a more successful approach to encourage consumption of drinking water treated with chlorine – and which would perhaps take advantage of the fact that taste preferences may evolve over time – might be to deliver it directly through piped water networks or automatic dispensers outside the control of users. Even so, we caution that users can still act on their taste preferences by substituting across water sources, or by waiting for the distaste associated with treatment (and therefore much of its protective benefit) to dissipate.
Taken together, these results suggest that successful promotion of water treatment technologies, especially at the point of use, may be contingent on meeting a certain threshold for taste acceptability. Because not all individuals react in the same way to attributes such as taste, trial periods or other methods to promote experimentation with a range of water treatment options among target beneficiaries might help to achieve a better alignment of technological attributes with user preferences. More generally, interventions that put undue focus on a single technology without utilizing a demand filter may not deliver promised health benefits if they ignore the considerable heterogeneity in households’ preferences for those technologies’ attributes.


